IN THE GULF OF CALIFORNIA REGION
Thesis by
Wayne Thatcher
In Partial Fulfillment of the Requirements
For the Degree of
Doctor of Philosophy
California Institute of Technology
Pasadena, California
1972
ACKNOWLEDGMENTS
I have found the Seismological Laboratory of the California
Institute of Technology an exciting and stin1ulating cnvironrncnt in which to work, and this thesis owes much to the help and encouragen1cnt pro -vided by all of the staff and students of the laboratory. In particular I wish to acknowledge the generous interest and advice of Dr. Jim Brune. Much of Chapters I, II, and III reports on work done in collaboration with Dr. Brune, and several of his thoughts are crucial to the conclusions presented there. Help from Drs. Clarence Allen, Don Anderson, Charles Archambeau and Lee Silver is much appreciated. Among discussions with many fellow graduate students, those with Thon1as C. Hanks have been particularly lively and stimulating.
Special thanks are due to the Comission Federale de Electricidad and the National University of Mexico (UNAM) for aid and cooperation in carrying out field work in Baja California. In this respect Dr. Cinna Lomnitz of UNAM is particularly thanked. Ralph Gilman played an
important role in the deployment and maintenance of the seismic stations.
This manuscript was typed by Mrs. Alrae Tingley and the figures were carefully drafted by Lazlo Lenches.
ABSTRACT
A
number of aspects of seismic surface wave propagation andearthquake mechanism in the Gulf of California region arc investigated in this thesis. In addition, several associated problems raised by this study are also explored in some detail.
Surface wave dispersion and P-wave travel time delays are measured to delineate the crust and upper mantle structure in the
Imperial Valley-Gulf of California region. Crustal thicknesses beneath Baja California and Sonora are comparable and near 25 km, while within the Gulf crustal structure varies laterally from nearly oceanic on the western side to continental shelf thicknesses (--20 km) towards the north and east. Love wave group velocities for Baja California paths are unusually high and were not used to determine structure. P and
tcle-n
seismic P-wave delays are used in a reconnaissance survey of crustal structure in the Imperial Valley and across the Peninsular Range
batholith. The data are consistent with an increase in crustal thickness of 12 km from flank to crest in the Peninsular Ranges, and a decrease of 8 km across the Imperial Valley.
The high Love wave group velocities measured across Baja
California are shown to be similar to velocities of the first higher mode. It is also demonstrated that higher Love modes can have group velocities very close to fundamental mode velocities for a range of wave periods and realistic earth models. The mode interference which is a consequence
measured phase velocities, and this problem is investigated in detail. An important conclusion of this study is that anomalously high Love wave phase velocities reported for the United States rnidcontinent and Japan are straightforwardly explained by mode interference without
appealing to complex or anisotropic models, as had been done previously. Seismic processes associated with actively spreading oceanic rises are examined in the study of a strong swarm of earthquakes located near an inferred spreading center in the Northern Gulf of California. Close-in travel time data constrain the origin times of swarm events and demonstrate that the epicenters are confined to the upper crust. Teleseismic P-delays suggest unusually low seis1nic
velocities beneath the source. The previously suspected norrr1al faulting nature of swarm earthquakes is also confirmed. Seismic coupling across 200 km between adjacent spreading centers in the Northern Gulf is
indicated by a survey of recent seismicity.
It is noted in the study of the Gulf swarm that these sources have significantly higher surface wave amplitudes than events with similar assigned magnitudes in Northern Baja California. In the final chapter of this thesis a detailed analysis is made of the Baja earthquakes and it is concluded that as a group they have distinctly smaller source
effects are not likely explanations of the observed differences.
TABLE OF CONTENTS
Introduction
Chapter I
Crustal Structure in the Imperial Valley-Gulf of California Region
Abstract Introduction
Surface Wave Observations (a) Baja California (b) Gulf of California (c) Sonora
P-Delay Observations
Chapter II
Higher Mode Interference and Observed Anomalous Apparent Love Wave Phase Velocities
Abstract Introduction
Fundamental and Higher Mode Love Wave Dispersion Higher Mode Excitation
The Effect of Attenuation
Simple Theoretical Considerations
Biases in the Routine Analysis of Phase Velocity Data Discussion
Page l
7 8
9 12 17 23
23
32 33 35 37 40 41
TABLE OF CONTENTS (continued)
Cbapter III
Seismic Study of an Oceanic Ridge Earthquake Swarm in the Gulf of California
Abstract Introduction
Swarm Activity and Gulf Seismicity Location of March 1969 Swarm Events Origin Times and P-Wave Residuals Focal Mechanism
Seismic Moments and Apparent Stresses A Comparison with Earthquakes in Northern
Baja California Conclusions
Chapter IV
Regional Variations of Seismic Source Parameters in the Northern Baja California Area
Abstract Introduction
Geologic and Seismic Setting of Northern Baja California
High Apparent Stress Earthquakes SH Spectrum from Brune's Model Analysis of Data
Page
53 54 56 64
74
76
7879
8183 84
TABLE OF CONTENTS (continued)
Source Parameters Seismic Moments Source Dimensions Stress D:i:ops
High Frequency Spectral Amplitude Decay Radiated Energy and Apparent Stresses Radiated Energy Estimates
Spectral Amplitudes at High Frequencies Discussion and Speculations
Conclusions References
Page 107 110 112
114 116
117 118 126
131
INTRODUCTION
This thesis is concerned with surface wave propagation in the Gulf of California, crustal structure there, and the investigation of earthquake source characteristics in the northern Gulf-Baja California area. It expands and amplifies on previous observations, and although the focus of the study is regional, the results have important general implications for surface wave propagation, earthquake source
mechanism, and the seismic processes related with seafloor spreading. Many of the seismic observations reported on here have par-ticular relevance to the regional setting of the Gulf of California as an active site of seafloor spreading and a link between the East Pacific Rise and the San Andreas fault system. Various geological, geophysical, and oceanographic studies carried out as long ago as 1940 leave no doubt that the Gulf is the seismically active boundary between two separating lithospheric blocks, the Pacific and the Americas plates (Shepard 1950, Hamilton 1961, Rusnak and Fisher 1964, Wilson 1965, Sykes 1968,
Larson et al. 1969). Plate theory and presently-existing marine magnetic anomaly patterns have allowed inferences to be made concerning the
tectonic history of the region, and these reconstructions suggest that lithospheric consumption occurred off the west coast of Baja for most of the Cenozoic up to about 10 m. y. BP, and that spreading was initiated within the Gulf about 4. 5 m. y. ago (Larson et al. 1969, McKenzie and Morgan 1969, Atwater 1970). Chapters I and III have the largest bearing upon regional relations and on the seismological aspects of seafloor
Chapter I investigates the crustal structure from the Irnperial Valley, where the various strands of the San Andreas system begin, through the Gulf to its mouth, including the surrounding land areas of Baja California and Sonora. P-wave travel time delays in the Imperial Valley and surface wave dispersion in the Gulf region are used to infer the structure. Previous investigations include gravity and shallow seismic soundings in the Imperial Valley by Kovach et al. ( 1962) and Biehler et al. (1964) and a Gulf seismic refraction survey by Phillips (1964). The new studies made here have placed constraints on the crustal thickness in the Valley, suggested strong lateral variations in Moho depth across the Gulf, and obtained crustal structure in Baja California and Sonora.
Chapter III comprises a detailed seismic investigation of an unusually intense swarm of earthquakes which occurred in the northern Gulf during March
1969
close to one of the rhomb- shaped basinsoriginally mapped by Shepard (1950) and now inferred to be the median trough of an actively spreading oceanic ridge. Sykes (1970) had noted the close relationship of oceanic ridges to earthquake swarms, vulcanisn1 and normal faulting, but close-in observations and detailed study of
swarms had been lacking. Some of the achievements of this study in-clude precise location in time and space of oceanic ridge swarm earth-quakes, confirmation of the normal faulting nature of swarm events, and detection of teleseismic P-wave travel time delays for these ridge
In Chapter I it is shown that the group velocities of Love waves traversing the length of the Baja California peninsula are unusually high compared with those predicted on the basis of the observed Rayleigh wave dispersion for the same path. These results draw attention to similar anomalous observations reported for Love and Rayleigh wave phase velocities in Japan (Aki 1961, Aki and Kaminuma 1963) and the mid continent of the United States (McEvilly 1964). Explanations have been previously advanced to explain these data in terms of differences in SH and SV wave velocities (McEvilly 1964, Kaminuma l 966c} and thin soft layers in the lower crust and upper mantle (Aki 1968, Hales and Bloch 1969). These proposed explanations have been generally felt to be somewhat inadequate because they are not supported by other independent data and are not easily tested. Chapter II investigates the effect of
higher mode interference on measured Love wave phase velocities and concludes that mode interference must occur frequently in Love wave propagation and can successfully account for the discrepancies observed in Japan and the United States. Since this analysis has been carried out, James (1971) has convincingly demonstrated that mode interference
explains anomalously high Love wave phase velocities which he measured in the Andes. In addition, although the high group velocities measured across Baja California are not unambiguously explained by higher mode propagation, the discussion of Chapter II shows that first higher Love modes can have group velocities similar to those observed in Baja.
In Chapter III it is pointed out that long period surface wave
than for northern Baja California shocks with the same short period amplitudes. The low surface wave excitation of the Baja earthquakes had been previously noted by Brune ct al. (1963) and was interpreted by Wyss and Brune (1968) as being due to the existence of high shear
stresses in the source region of these events. Chapter IV is a study of these sources, which are compared with earthquakes within the Gulf of California. It is found that there are very striking visual differences in seismograms written in southern California from events in the two regions. This difference in the high frequency amplitudes recorded on standard Wood-Anderson instruments appears too large to be a near-source or path effect and is interpreted here as reflecting directly significantly larger source dimensions and seismic moments for the Gulf earthquakes compared with similar magnitude events in northern Baja California. This conclusion is supported by preliminary examina-tion of seismograms of southern California earthquakes, for which similar regional differences are indicated by the seismic records.
A comparison of the northern Baja California earthquakes with small magnitude underground nuclear explosions reveals only about a factor of two greater long period excitation and source dimensions for the Baja shocks, pointing out a clear difficulty in earthquake-explosion
~Salton Seo Imperial
Vol LU
---
( __Agua Blanco
---._y
S
FaultM()r"-'9.:
'co---GULF OF CALIFORNIA
REGION
0
100 200 km1!70
SONORA
u1°
Figure 1. The Gulf of California Region
30°
27°
·CHAPTER I
CRUSTAL STRUCTURE IN THE IMPERIAL VALLEY-GULF OF CALIFORNIA REGION
ABSTRACT
Crust and upper mantle structure has been determined for
several distinct portions of the Gulf of California region using seismic surface wave dispersion and body wave travel time delays. Funda-mental mode Rayleigh wave data from 10 to 40 seconds period and first higher mode waves from 6 to 10 seconds period are used to deli.neate structure for five distinct sets of paths in and adjacent to the Gulf. Baja California and Sonora (mainland Mexico) have similar crustal thicknesses, about 26 and 24 km respectively. Fundamental mode Love wave group velocities for Baja paths are unusually high with respect to values expected on the bas is of the observed Rayleigh wave dispersion, and were not used to determine structure. Short
period higher mode Rayleigh waves provide a particularly good constraint on the average crustal thickness beneath Baja. Within the Gulf itself there is considerable variation in crustal thickness normal to its axis. Along the western edge average structure is
near-oceanic with a crustal thickness of 9 km, but is near 20 km in the central and northeastern portions of the Gulf.
P and teleseismic P-delays are used to infer structure in n
California and Northern Baja Californiao Though such data alone are intrinsically ambiguous, they are consistent with a crustal thicken-ing of 12 km from flank to crest of the Peninsular Ranges and a crustal thinning of about 8 km beneath the Imperial Valley. The crust may thicken to as much as 43 km beneath the Sierra Juarez, Northern Baja California ..
INTRODUCTION
The existence of an actively spreading oceanic ridge within the Gulf of California makes the determination of crust and upper mantle structure in this region of considerable current interest. Though in general the location of spreading centers and transform fault segments is known within the Gulf itself, the nature of the transition from this pattern in the Northern Gulf to the beginnings of the San Andreas system northeast of the Salton Trough is not yet well understoodo The crustal structure from the mouth of the Gulf to its head has been delineated by the seismic refraction measurements of Phillips (1964), but there is little known of possible lateral variations in crustal thickness normal to the axis of the Gulf, and no data exist for
the adjacent land areas of Baja California and Sonora. Further north in the Imperial Valley of Southern California, even the crustal thickness has not been seismically determined, though shallow crustal structure is known in a few regions and an extensive gravity
survey has been carried out [Kovach et aL 1962, Biehler et aL
1964]
ousing wavetrains from earthquakes which traverse paths through and
adjacent to the Gulf and are recorded on long period seismographs of
the Caltech array in Southern Californiao Fundamental and first
higher mode Rayleigh wave group velocity data for five distinct sets
of paths (three within the Gulf, as well as Baja and Sonora) are each
interpreted in terms of a crustal velocity model.
In adaition to the surface wave data, relative arrival times
of P and teleseismic P waves observed at stations in the Imperial
n
Valley-Colorado Delta region are used to infer crust- upper mantle
velocities and crustal thicknesses in this region ..
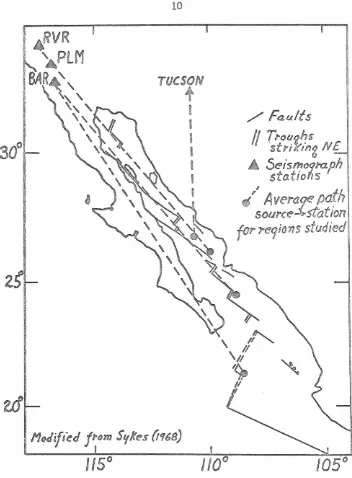
SURFACE WAVE OBSERVATIONS
Surface waves generated by earthquakes in the Gulf
tra-versing several specific regions have been analyzed from long
period records of Caltech stations in Southern California and the
WWSSN station at Tucson, Arizonao The location of stations and
some average source-receiver paths are shown in figure 2o The
epicenters and origin times for most of the events used have been
relocated by Molnar and Sykes [1969] and the remainder are
re-located here. Most epicentral distances are about 10° or less, and
thus differences in location between those determined by the USCGS
and the relocations used here (up to 30 km) produce significant
differences in computed group velocities o Since the relocations had
lower mean residuals than the CGS determinations, the relocations
2
4
RVR
l '
PLM
~
BAR
lTUCSON
lA
~
i
i
~i
~ ~I
/Faults
//
Trot.1?,hs
strril6ng NE
·
··
5eismoqraph
statioft
s
~
q1"
A
veraqe
path
so1..u
..
ce~stationfor re9it:ms
studied
\ \ II II
'"'
I~
' \II
"
105°
~-13.41-o
BAJA
CALI FOR
NIA
~ru..
,.An~
~
'
11~
/\ /\ J\Z6
Jan
.
1967BANOETT
L
PZ
-
--
. -
~ yvrr
VJil ·v~v-\.,yy
v
v- \
ZI. 36
°
N 108.88
w
L.\=
10.1./tJ
BARRETT
LPZ
~=
CJ.30
PAlO/fAR
LPZ
~
1
min.~WESTERN GULF
IoDec.
1'15824.61°N
109.
08"W
NORTHEASTERLY
GULF
3 J
!'1ar.
196026. ll./
0N 11002()/J
Figure 3. Typical long period Rayleigh wavetrains from sources in the Gulf travelling different paths to stations in southern
was often significant improvement in the agreement between group velocities for similar paths when relocated sources were used ..
Figure 3 shows some typical Rayleigh wavetrains for sources in the Gulf traversing different regions to Southern California. For
the Baja path note the well-developed short period higher modes of 6-10 second period superimposed on the longer period fundamental mode waves,, The dotted line on the seismograms is a visual
filter-ing of the short period waves, shown in order to display more clearly
the fundamental mode dispersiono A distinctive feature of many Gulf
path Rayleigh wave seismograms is the longer period (6-10 second)
S pulse, particularly clearly shown in the second trace of figure 3e n
The velocity and characteristic period of this arrival make it ex-tremely useful for obtaining constraints on upper mantle shear wave velocities. In this study S is regarded as a superposition of short
n
period higher modes, acting essentially as a body wave critically
refracted at an upper mantle velocity contrast.
We now consider in turn the observations made for each path, describe the data, and present crustal models which adequately fit ito
{a) Baja California
Three earthquakes, probably all on a small segment of
transform fault south of the tip of Baja, provide sou.rces with suitable
and his crustal structure has been used to subtract out the effect
of the oceanic segment of the path. The data,
sources g paths used, and the derived crustal model are all shown in
figure 4o The fundamental mode Rayleigh wave data have been fit to
a crustal model using the additional constraint on crustal thickness
provided by the higher mode data shown in figure 5. The position
of the first higher mode group velocity curve is very sensitive to
crustal thickness: once the slope of the curve between 6 and 10
seconds is obtained from the crustal velocity contrasts, its exact
position shifts significantly to the right or left with only a few
kilo-meters increase or decrease in crustal thicknesso Average crustal
thickness for the Baja path is 26 km and is well constrained by the
data shown in figure 5.
Next consider the Love wave group velocity data. Along with
the observations, figure 4 shows the fundamental and first higher
mode curves derived from the crustal model which fits the Rayleigh
wave datao It is immediately apparent that the Love wave data are
not in accord with the expected group velocities of the fundamental
modeo They agree only near 20 seconds period, are nearly 0 o 3
km/ sec high at 30 seconds and slightly higher at the longest periods
measuredo Past 30 seconds the data aa:e close to the first higher
mode curve. Two explanations for this discrepancy are possible, but
unfortunately neither may be directly tested at this time o A
hori-zontal long period station on the Baja penins.ula would be of help in
deciding between the two alternative explanations which follow. The
~
~
~ ':it 4.5' . l """"' == . 4.0BAJA
~,
CAUFORl\ttA
/"
v
., 6 .,,,.,,=,,,, ... _.....-"'""\Firs
I
Hiaher
11ode
~~ ~~ J---=-.... --""'
LovtZ
'\J 4J--"'r:P
---"-rondamenfal
---Love.--"'A
_,__.;
0 u ; ,,,,,., v ----..; ~5 ~ .... JJ ... 'A ..~-Fundomenfal
'Rayleigh
c)
g
w :> a. :J 0 Ct (.!)4.0
BAJ"A
CALIFORNIA
D
Crustal rhic.kness
=
26
Km.5
PERIOD, SEC
0
a
10
higher mode Love waves are being excited by the source and the resulting mixed mode wavetrain is not being interpreted correctly 0
It is show_n in Chapter II that for a representative range of earth models the fundamental and first higher mode group velocity curves approach each other closely or overlap in a period range up to about 100 seconds, details varying from model to modeL Though the closest approach of the curves in figure 4 is about 0 .. 3 5 km/ sec at T
=
35 seconds, the dlfference in arrival times at these epicentral distances is only 25 seconds and mode interference is still possibleo In addition, the first higher mode group velocities may be depressed more by decreasing shear velocities in the low velocity channelwithout significantly changing the fundamental mode Love and Rayleigh wave dispersion for periods less than 40 secondso However the
explanation here in terms of higher Love mode excitation is not
proven and the question is unresolvedo It should be noted here that in several other regions of the world anomalously high Love wave phase velocities have been observed, and this may or may not be related to the high $roup velocity measurements reported in this study (io e. measured phase velocities may be anomalously high if caused by higher mode interference, while corresponding group velocities are close to those expected for the fundamental mode). The effect of higher mode interference on measured phase velocities is dealt with fully in Chapter II and will not be considered further hereo
about 100 km, with sharp lateral gradients in crustal thickness on
both boundaries. It is possible that SH waves with wavelengths
greater than the width of the peninsula feel the adjacent oceanic and
Gulf velocities as well as those beneath Baja, and this would
ade-quately account for the higher velocities observed for Love
wave-lengths longer than about 80 km. Rayleigh waves, being
longitudi-nally vertically polarized P-SV motion, would presumably be
unaf-fected by this horizonal inhomogeneity. Unfortunately neither
numerical nor analytical solutions exist for Love wave propagation
with these boundary conditions, so again the suggestion cannot be
verified ..
(b) Gulf of California
The crustal models for various segments of the Gulf derived
by Phillips [1964] from seismic refraction results demonstrate that
there are great changes in crustal structure between the ·head of the
Gulf and its mouth, as well as suggesting from one refraction line
that there may be significant v_ariations across the Gulf as well.
With these indicated strong lateral velocity gradients it is to be
ex-pected that surface waves propagating up the Gulf may be guided or
late rally refracted by the structures, and that the great circle path
between source and receiver may not in all cases represent the
true transmission path. Without a large aperture array it is not
possible to accurately assess the importance of lateral refraction.
However in several instances earthquakes whose great circle paths
indicating the possible importance of non-least time paths, although source location error is another possible explanation of the discre-pancyo With these pos.sible drawbacks in mind, three groupings have been made of those Gulf surface wave data which (regardless of path) show similar <lispers ion. Though some paths from different groupings do overlap, each group does outline a general region within the Gulf. Each grouping of data shows the corresponding
great circle paths between sources and stations and intercomparisons may be easily made by the reader. Note that the group velocities for the mainland portions of the path have been subtracted out from all the data using the fundamental mode Rayleigh wave data from the Baja paths.
Figure 6 shows the data and paths for a grouping designated as ''Western Gulfo" The three earthquakes sources used are in the
southern Gulf, so the paths average the structure for almost its whole enclosed length. The Rayleigh wave group velocities between
15 and 25 seconds are the highest measured for Gulf paths. The fundamental (M
11) and first higher mode (M21) dispersion curves
for the crustal model which has been fit to the observations is shown in figure
6.
Also shown for comparison is the fundamental mode dispersion curve derived from the "Central Gulf" data. Note the differences in the shapes of the curves as well as their differing group velocities. The structure is close to oceanic and the indicated crustal thickness i.s about 9 km. The S n observations agree well with the M4 . 5~ r--v-w-I I I r I I rQO:Lf&!Ui · I I ~ ~ :.s ~ ~ ~
u w Cl) ...
4.0
:!
3.3
::..: )-.
...
0 0 ...J w > 0.. :;:) ~3.0
C>
,
..
,
,
!.. IM2t
+
0
e ~
WESTERN
GULF CENTRAL
GULF WESTERN GULF PATHS o 24.4i' 0N-o.BAR ~24 . Sl"N-BAR x 24. SI" N_,,PLM @ 25. I 3°N-RVR $i'lo 4.4T(lll) Sn .. 4.38(I)
Sns4.38{Y) NO
Sn OBS • U FOR BAJA PORTION OF PATH HAS BEEN SUBTRAC.'TED
OUT CRUSTAL
curveo Such high group velocities had previously been observed for
oceanic data in this period range by Sykes and Oliver (1964) ..
Additional independent evidence for near-oceanic structure close to
the ''Western Gulf" surface wave paths is provided by a refraction
profile of Phillips
[1964].
This profile, parallel to the axis of theGulf, lies between
Angel
de la Guardia Island and the Baja mainlandand indicates a Moho depth at 11 kme All of Phillips profiles from
Guyamas sou.th show approximately oceanic crustal structure.
A group of data from six earthquakes whose paths very roughly
define a central region of the Gulf are shown in figure 7 o These data
comprise the least distinctive spatial grouping of Gulf great circle
paths: a wide region of the Gulf is enclosed by the paths and several
of them are close to those for the two other Gulf regions.. The
like-lihood is greatest in this, group of data that some or all of the paths
may be non-least time ones or they may traverse more than one
distinctly different crustal structure. Again these possibilities are
difficult to unambiguously ascertain, and we have again fit all of the
data with one average crustal structureo The crustal thickness is
about 18 km and all the fundamental mode and S data adequately n fit
the derived dispersion curveso
Figure 8 is similar to the previous two and shows the results
for paths in the Northeasterly Gulf regiono The earthquake sources
are more towards the mid-Gulf region, and hence this group of data
may differ from the previous set only because the average crustal
thickness is slightly greater over the paths shown in figure 8. At
4.f'i I 1 I = I 1 I I...,.~ V I nrn!ii$$0 ws:a ~~ fm:Jwom .w ~
u
w (/)'
~ ~4.0
)-. t:
3.5
<.J 0 ...J w
r-b-\
:M21
I I I
,_
I I I I I I,
I I> 0.. ::::> 0 a:: ~
3.0 1--CW/ CENTRAL GULF ar ·Mil II CENTRAL GULF PATHS (ANO/OR MIXED PATHS) m 23.SS @N-RVR Silo 4.24 (If) 0 23.96"N-PLM Sn =4 .3 2 {II) ~ 24.47"N-RVR Sna4.47 (U) X 25.IS"N-RVR + 25.18" N-BAR v 25.83° N-BAR T 25 . 83° N-RVR A 26.11° N-RVR Sn"4.27 {ll) 025.13°N-BAR Sna4.i7tDl) CRUSTAL THICKNESS 11.7 KM
~ a
h a
/3
1.00 1.52 0.00 1.10 2.41 1.40 2 . 25 5.04 2.94 6.00 5.93 3.46 6.75 6.83 4.10 20.0 7.80 4.50 20.0 7.75 4.45 40 .0 7.70 4.34 oO 7.95 4.55 2.~ • 10 20 30 40 50 PERIOD, SEC. p1.02 1.50 2.291 2.55
"'~
-~"
I
2.89 3.13 3.38 3.40 3.46
4,~g' I -I ~ ~<=:="""''="~i""""""',,_~ • ..,,,if""""""..,.,"""'F,~fr,.i"""""z="""'r-="""'""""""''""""""',_,."""""""'"""'=""'""""~"""'"""""""''"""'~"""'""""""""'"""""""'"""""'"'1
u I.LI Cl> ...
:e
4.0
x
3.5
>-' l- o 0 ..J w > Q. :::> 0 ~
3.0
NORTHEASTERLY
GULF
Ill 0v
NORTHEASTERLY GULF PATHS v 26.14"' -PLM Sn a 4.4S (Ill) c 26.62°N-PLM m 26.82°N-RVR h a/3
0 27.23°N-PLM 0 27. 23°N-RVR 1.20 t.52 0.00 1.90 2.41 1.40 2.50 5.04 2.94 U FOR BAJA PORTION OF PATH 1.00 5.93 3.46 HAS BEEN SUBTRACTED OUT S.15 S.83 4.10 ~ 7.80 4.50 CRUSTAL THICKNESS 20.8 KM 20 30 40 50 PERIOD, SEC.p 1.03 t.50
2.29 2.56 2.1!4 3.13
fits the data has a crustal thickness of about 21 km.
(c) Sonora
Fundamental mode Rayleigh wave dispersion for surface wave paths between the Gulf and Tuscon Arizona has been measured and is illustrated in figure
9.
Compared to the Baja observations, the Sonora path data are about 0.1 to Oo 2 km/sec higher beyond 20 sec-onds and this increases as a function of period. The crustal thick-ness of the derived model is similar (24 vso 26 km) but upper mantle velocity for Sonora is considerably higher, 4o45 km/secoP-DELAY OBSERVATIONS
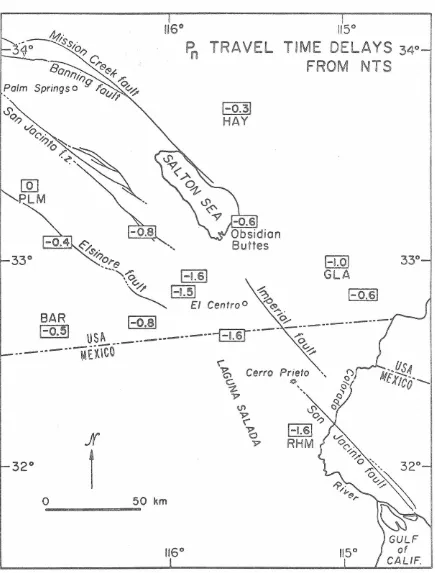
En echelon patterns of fault traces, high heat flow and relative topographic depression all suggest that the Imperial Valley-Colorado Delta region may be a northward structural continuation of the Gulf of California. Relative arrival times of P and teleseismic P waves
n
observed at stations in this area comprise the best presently-available seismic data on the crust-upper mantle velocities and crustal thick-nesses in this regiono Observatioraby several different investigators have been utilized here in order to make some tentative statements concerning crustal structure in this interesting region.
4.S
·
-·
u w Cf) ... :! :i.:
4.0
>-.
3.5
t-
u
g w > Q. J 0 a: C>3.0
Figure
9.
m 10
SONORA fundamfJ'nfol, 'Rayleigh
•
20 h2.0 2.0 2.0 6.0 12.0 45.0 OQ
ct
4.28 4.~e 5.20 5.73 6.30 7.8
0 G!Jt.F TO TUCSON @ 26. 7QN 110.8"\Y 29.JUN 19S4 A 2.S.S 0N 110.8\v 2MAR1966 8 27.8°N 1 II .1°W II SEP 1966
fJ
p 2.50 r.ao 2.60 2.00 3.00 2.30 3.50 2.57 .3.87 2.43 4.45 3.20 e.oo 4.53 3.40 CRUSTAL THICKNESS 24 KM II
II
I 30 40 PERIOD, SEC I-'
I
50difference in velocity structure between the Imperial Valley and adjacent regtons in Southern California is clearly demonstrated in
figure 10, a P travel time plot which compares arrivals at
per-n
manent Caltech stations with those from a temporary array within the Imperial Valley. These data are taken from an unpublished
pre-liminary study of the region carried out by D. N. Clay of Caltech., It is clear that P times to Imperial Valley stations are one to two
n
seconds early with respect to a P line through Goldstone, Riverside
n
and Palomar stations with an apparent velocity of 7 o 8 km/ sec. This difference can be due to increase in P velocity along the path to
n
the Imperial Valley, increase in crustal velocities in the Valley, decrease in crustal thickness, or all three factors.. Let us consider each of these factors in turn. A revetsed refraction line between
NTS and Ludlow, California yields a P velocity of about 7., 8 km/ sec n
and a crustal thickness of about 28 km [Gibbs and Roller, 1966]. If all
of the early P arrival time in the Valley were due to an increase
n
in upper-mantle velocity along the path from Ludlow, the P velocity
. n
on this segment would be about 8. 4 km/ sec e Realistic changes in average crustal velocities in the Valley could not by themselves
account for the early P times o Crustal thinning alone could explain n
them if Moho depth decreased by about 8 km beneath the Imperial
Valley.
Unfortunately there is no direct evidence on P velocity within n
the Imperial Valley, and an increase from 7.8 km/ sec is not definitely
precluded. However, it should be especially noted that if the P n
u
GJ
rn 60
G> > 40
0
....
t-Pn-Travel Times
NTS
Jon. 20, 1967km/sec
x Imperial Voffey Stations • Other So. California 11
460 km
!
f
I sec. 20~~...i..~~-'-~~-'--~---l--~--s-~~~~_.._~_.~--'--~.___,200 300 400 500
Distance,
km
then the P ail:omalies would increase with e picentral distance, and
n
this is not seen in the data examined here (see figure 12, to be
dis-cussed below). Also, a P velocity near 7. 8 km/sec has been
n
measured both north of the Valley and within the Northern Gulf.
Phillips' [1964] refraction results show P velocities between 7. 8
n
and 8. 3 km/ sec on 4 of his 16 Northern Gulf profiles, but none of
these 4 are reversed, and he feels the lower value is much more
probable for the Northern Gulf region.
In addition to the P delays, an unpublished study has been
n
made by Brune of teleseismic P delays at stations from Barrett east
to the California-Arizona bordero He used earthquakes in the Western
Pacific and was careful that their paths all had about the same
axi-muth from source to stationso The results are shown in figure 11,
which is a plot of travel time residuals with respect to Palomar as
the standard. Variations in P delays can again be caused by changes
in average crustal velocity and crustal thickness, as well as vertical
changes in sub-Moho velocityo Thus, for example, a teleseismic P
arrival which is Oo 5 seconds early with respect to Palomar (eo go
Barrett or Signal Mtna) could indicate an increase in upper mantle
velocity of 0.4 km/sec in a thickness of about 75 km, or a crustal
thinning of nearly 12 kmo With these numbers in mind the teleseismic
P-delays can be compared with the P delays, which are plotted
n
on the map in figure 12. The P-delays may be suggesting a
thicken-ing of the crust by as much as 12 km from Barrett towards the crest
of the Peninsular Range batholith (Palomar, Jacumba stations). To be
consistent with the P delays there must be a significant increase
0.8 P-Delay Profile: Peninsular Ranges to Colorado River
0.4
),
I
\
t
u
I
'
<l>
x
'
(,/)
1!\
~
I
...
0
0 ...
Q)
!\
I
...-0
x
"->!:I
f,
I
a..
I
I
'
\,r!
-0.4
I
'
r
'
La.at
-:2: ~
Q 2 2 QQ
<C
~t---
0:::0::: ::::r.;:--
::z: --' --'-0.8
-
<<C _c::::. -..JV> -c ~ Cl.I') ...,..., ..a.::z: < 0::: 0 ::c: =: =
0:: c::::><
=
u..I <.>t>o-c:: -..JI-- ~o... V ) .q; <
:!>--West a:> < <V) a _ _ V ) -::::> V ). C!Q
=
...! East --'=
«"..:ll CS> coFigure 11. Teleseismic P-wave travel time residuals along a west to
in upper mantle velocity beneath the crust of the Peninsular Ranges, and rather less to the west of it. East of the batholith the large P-delays (O o 4 sec early) and P delays (1 o 5 sec early) at Superstition
n
and Signal Mountains are consistent with 8-12 km of crustal thinning and a P n velocity of 7 o 8 km/sec. However the upper mantle
veloc-ities could be high, perhaps 80 2-8a4 km/ sec without any thinning required. Further east at Obsidian Butte the P delay is
+
O. 2 secand P delay - 0 o 6 sec, suggesting either crustal thickening or lower
n
crust and/or upper mantle velocities as compared with the stations to the west, Superstition and Signal mountains. Recent volcanic activity and locally high heat flow and potential geothermal steam support such speculation about lower seismic velocities in this area. Coachella is similar to Obsidian Butte, the P-delay decreases at Glamis, and by Blythe, on the California-Arizona border both P
n
and P delays are near zero.
A quarry blast in Corona, Califo:ll.'nia was recorded at Barrett and at two portable stations in the Sierra Juarez, a continuation of the Peninsular Ranges into Northern Baja California. P was the
g
first arrival at Barrett (~ = 150. 8 km, and P was recorded at the n
two Baja stations (277.1 and 3380 9 km distant). Assuming a crustal velocity of
6.
2 km/sec and a P velocity of 8. 0 km/ sec gives ann
average crustal thickness near 43 km beneath the Baja stations.
However at the further station, which is both nearer the crest of the Sierra Juarez and across the Agua Blanca fault, the P arrival
n
-0.4
~ij
use
115°
Pg,
TRAVEL TIME DELAYS
34°
FROM NTS
1-0.3)
HAY
':/._r. ...
33°
/~~:.~...
H.ol
33°
"oc::..
(-LS]
GLA
·~
EL5]
~
[-o.sl
~ El Centro o ;o('Q
-
·
BAR
1-o.el
-0~---!-o.SI
USA
---·---~----
'o
----
"
---~E~\CO ' l
~
Jr
32°
1
0 50 km
116°
1b
Cerro Prieto ',~ ~~\
'9 '
O' 'V
~
~
v
Figure 12. Pn travel time delays in the Imperial Valley-Colorado
SUMMARY
CHAPTER II
HIGHER MODE INTERFERENCE AND OBSERVED ANOMALOUS APPARENT LOVE WAVE PHASE VELOCITIES
ABSTRACT
For a representative selection of spherical earth models
com-patible with seismic observations, there is a significant frequency range over which the fundamental and first higher Love mode group velocity curves approach each other closely or actually overlap.
Higher Love modes can be excited comparably to the fundamental
mode for both shallow and deep sources under a variety of c
ircum-stances, and thus higher mode interference is an important factor to be taken into account in the proper interpretation and analysis of Love waveso
Simple theoretical computations reveal the nature of the effect
of mode contamination on measured phase velocities, and biases in
the selection and analysis of surface wave data make it appear likely
that fundamental mode Love waves experiencing higher mode
inter-ference will exhibit anomalously high apparent phase velocities, as
observed in the United States mid-continent and in Japan. Thus it is suggested that it may not be necessary to resort to complex or
anisotropic models to explain these observations.
important in determining dependable fundamental and higher Love
mode phase velocity dispersion over a broad frequency band. Phase
velocity filtering across a large array could effectively separate
the modes. Love waves traversing continental regions from the
source will suffer little or no contamination from higher modes for
wave periods less than about 60 seconds, and thus are preferred to
oceanic paths in obtaining reliable fundamental mode data in this
restricted frequency range.
INTRODUCTION
Unexpectedly high Love wave phase velocities have been
ob-served in several different parts of the world: Aki and Kaminuma
[ 1963] in Japan, and Mc Evilly [ 1964] in the mid-continent of the
United States, found it impossible to explain both Love and Raleigh
wave observations with a single simple plane isotropic la ye red
earth model.
Two different explanations have been advanced to account for
these anomalous observations. By assuming that the SH wave speed
was 6 - 8% higher than that for SV, both McEvilly [ 1964] , and
Kaminuma [ 1966c] were able to explain their observations with a
single anisotropic model. Takeuchi et al. [ 1968] showed that
elliptical magma pockets in the upper mantle could alter the
effective rigidities felt by SH and SV waves and account for the
anisotropy the above models required. Aki [ 1968] proposed a
and upper mantle beneath Japan, and he demonstrated that such a model could fit all of the surface wave data. Hales and Bloch [ 1969] suggested the same is true for the central and western United States and perhaps world-wide.
The only other comprehensive study of regional surface wave dispersion, which includes both Love and Rayleigh wave data, is the paper of Brune and Dorman [ 1963] on the Canadian shield, and they found no difficulty in fitting all observations with one simple model.
the deeper mantle.
FUNDAMENTAL AND ffiGHER MODE LOVE WAVE DISPERSION
Phase and group velocity dispersion for the fundamental and first two higher modes have been computed for three standard spherical earth models using the accurate "earth-stretching approximation" of Anderson and Toksoz [ 1963]. Figure 13 shows the oceanic model CIT11A of Kovach and Anderson [ 1964] . Note especially the broad region of overlap of the fundamental and first higher mode group velocity curves and the distinct separation of the
corresponding phase velocities. Results for a shield model almost
identical to the Canadian shield model of Brune and Dorman [ 1963]
(CANSD with an increasing gradient below 400 km taken from Anderson and Harkrider' s [ 1968] shield model) are shown in
Figure 14. Note that the fundamental and first higher mode group
0
Q)
5.5
~ 50 ~
4.0
CIT rt A Bullen A . Oceanic
Love Dispersion (Spherical Eo.rth)
352'-o ---~40.,---. _ _ __.,60~---e_,_o·----,-'oo
Period, sec
. Fig .. 13 Love wnve .plinse and group wlot:it.y
d1spers10n for the first three mo<lC's of the' sphericnl
oceanic earth model CITllA.
6.0 ~---~~--~---,
CANS D Shield
Love Dispersion (Spherical Earth) 3·52'--0 -"---41Q----io--·---·--01a·---·-1oc>
Porlod, ~oc
Fig. :1.4 Love wnvc phnHc und group velocity
dispen;ion for the find; three rnodPS of a splwrical
shield earth model slightly modified from CANSD.
velocity curves approach to within 0. 01 km/second of each other near a period of 65 seconds, close to where Brune and Dorman's Love wave data terminate (they stopped their analysis where the Sa phase was expected to arrive on the seismogram). Finally, in
Figure 15 is the dispersion for Anderson and Harkrider's [ 1968]
tectonic model.
6.0~--- Group vel. / /
---Phase vel. / /
u
..
5.5
~ 5.0
~
~ _...,,.
/ / /
/ /
/
---:g4.5..-..:----~
4.0
@
Anderson Tectonic Love Dispersion (Spherical Earth) 3·52'-o--'----'-40 _ _ _ _ 6_,__o _ _ _ _,ao _ _ _ __,100
Period, sec
Fig. t.5 Love wave phase and group velocity
dispersion for the first three modes of the spherical tectonic earth model of Anderson and H arlcrider [1968].
Thatcher and Brune [ 1969]
to those described above.
The group velocities of the two modes need not exactly coincide at a given frequency in order to produce mode mixing: it is only necessary that both modes be in the same group velocity window used in the phase velocity analysis, or, in the case of the graphical method, that the time separation of the mode arrivals be of the order of a wave period or less o
HIGHER MODE EXCITATION
The degree to which higher modes are excited relative to the
fundamental depends on both the source parameters of the earth-quake (type, depth, orientation) and on the earth model through which the waves are being propagated.
Ben Menahem and Harkrider [ 1964] have studied the far-field displacement produced by dipolar sources in plane layered media, and several conclusions from their study are relevant here. The surface radiation pattern was shown to be a function of the depth and orientation of the force configuration, and differed for different wave periods o Furthermore, it was illustrated that
the fundamental and first higher mode Love wave radiation patterns for the same source and wave period may differ considerably.
an oceanic and a shield model (refer to their Figures 4 and 5,
p. 2976). Their results for an oceanic model and buried horizontal point force are reproduced here in Figure 16. Note that for periods less than about 100 seconds the energy densities of the first 2 modes are comparable even for surface sources (for Rayleigh waves this
is not the case, the fundamental having about an order of magnitude more spectral energy for a surface force). The importance of the first higher mode relative to the fundamental does not increase a.s rapidly with depth for the Love modes as it does for the Rayleigho Hence higher Love modes should in general be observed more often for
shallower source foci than higher Rayleigh modes. It should be noted that the observation of first higher mode Rayleigh waves by Kovach and Anderson [ 1964] are in qualitative agreement with the energy partitioning among the various Rayleigh modes computed by Harkrider and Anderson [ 1966].
Fig. 1.6 Love wave spectrum energy densities per unit oceanic propagation path in units of
1015 ergs/km for buried horizontal forces of strength (L)
=
2 X 10111dynes sec (from Harkrider
and Anderson {1966], p. 2978, figure 9).
The same authors have also computed the spectral energy
density partitioning among modes for surface waves propagating
through a shield-type velocity structure. For a surface source
they s hawed that the fundamental Love mode has about a factor of
two greater amplitude than the higher modes in the period range
less than 100 seconds. We might surmise that the degree to which
the low velocity channel is developed exerts a strong influence upon
the relative excitation of the higher Love modes. Of course the
actual ground displacements due to the different modes depend on
the displacem~nt versus depth curves for the individual modes at
specified wave periods, as well as on the partitioning of spectral
energy density. If we refer to such curves in Anderson and Toksoz
[ 1963] for example, we see that surface displacements are
com-parable to the maximum displacements for several of the higher
modes throughout a wide period range.
Jobe rt [ 1962, 1964, 1966] has computed Love wave spectral
amplitudes in spherical earth models due to buried torque sources
by summing toroidal oscillations up to order number n
approxi-mately 2000. For a "Gutenberg type" continental model she found
that the spectral amplitudes of the higher modes were in general
about one-fifth as strong as the amplitude of the fundamental. Her
models were not derived from surface wave observations however,
and none produced the overlapping of fundamental and higher mode
group velocity curves which we have illustrated for CAN SD, CIT11A,
and Anderson's tectonic model. As we have noted previously,
how pronounced the low velocity channel is and to the structure
below 400 km depth. However at present we cannot with complete
certainty say whether the lower amplitude of the higher Love modes
computed by Jobert is a result of sphericity or of the details of the
mantle structures studied by her. At any rate, even if these
ampli-tudes are taken as a minimum, interference of fundamental and
first Love modes will still significantly alter the observed phase
velocities, as is shown below.
It should be pointed out that examination of the excitation
curves of Jobe rt and those shown in Figure 16, as well as from particle
displacement versus depth curves and radiation patterns, reveals
that the ratio of fundamental to first mode ground motion is
rela-tively constant as a function of frequency for shallow sources, but
may fluctuate considerably for deeper ones.
THE EFFECT OF ATTENUATION
The amplitude decay versus period observed for surface
waves and free oscillations is consistent with an upper mantle
relatively more attenuating than regions above or below it, and this
highly attenuating zone may well be confined to regions of phase
change and/or partial melt [Anderson and Archambeau, 1964;
Anderson et al. , 1965] . Then, taking the low velocity zone to be a
region of low Q (high attenuation), it follows that surface waves
with particle motions largely confined to this channel will be
dis-placement versus depth plots for the higher mode waves in realistic earth models [viz. Anderson and Toksoz, 1963; Kovach and
Anderson, 1964] would lead us to expect the shorter period higher mode waves to be more attenuated than fundamental mode waves of corresponding periods, but that for periods of about 40 seconds and greater, differential attenuation of higher modes should not be im-portant. This may explain, along with the shape of the group
veloc-ity curves, why contamination by higher modes does not appear at periods less than about 20 to 30 seconds.
SIMPLE THEORETICAL CONSIDERATION
In order tocpantitativery understand the physical consequences of the mode interference we have shown will occur between funda-mental and higher mode Love waves, consider the s upe rpos it ion of two sinusoidal waves. Let these waves have the same frequency but differing wave numbers, and let them arrive at an observation point x at approximately the same time t (and hence, have about the same group velocity). Ignoring terms corresponding to the initial phase at the source, we then have
A(k) exp (-ik
1x + iwt)
+
A.A(k) exp (-ik2x+
iwt) k=
w/c
2 l
=
A(k){i +A. + 2A. cos [ (k1 - k2)x] }
2 exp
(-i4;
+
iwt) (1)where
tJ;
=
tJ;(x) =tan -1sin k
1x +A. sin k2x cos k
and A. is an amplitude scaling factor (in general A.= A.(k)). We observe that the composite waveform is modulated in amplitude by the square root term in (1), and the beat wavelength is given by
A.
=
b 1T
1
(2)Table 1 shows the beat wavelength as a function of wave period for fundamental and first higher mode interference in the three earth
models CIT 11A, CANSD, and Anders on tectonic. Observe that in all cases the beat wavelength is greater than 850 km, and that at 50 second period and beyond is greater than about 1700 km and varies
only mildly as a function of frequencyo
We note that the position of minima will be modified if the initial phase at the source varies as a function of frequency and i_s
TABLE 1. Beat Wavelength as n, Function of Wave
Period for Fundamental n,nd First Higher Mode
Interference in Three H.epresentative Enrth Models
Anderson
T, sec CITllA CAN SD Tectonic
30 2385.0 1136.0 855.2
40 2461.3 1812.6 1276.6
50 2429.9 2153.4 1682.5
60 2:)62. 7 2241.3 1907.2
70 2287.7 2263.8 1965.2
80 2216.8 2~24.8 2o:30.9
90 2228.5 2372.9 2040.4
100 2240.1 2554.1 2064.3
different for the two modes o However, in analogy with the result of Knopoff and Schwab [ 1968] for the apparent initial phase of Rayleigh waves, we expect the effect to be small and vary little with frequency at teleseismic distances.
Examining the special cases A.= 0, 1 in equation (1) we have
(3)
If the true wave number is k
1 when only the fundamental mode is excited, then we must conclude that when both modes are excited comparably, the apparent wave number is ~ (k
1
+
k2), and hence the apparent phase velocity is.!.
=
±(-1-
+
_1_)
(4)C c
1 c2
except across a node in the beat pattern {see discussion below).
For A. not near 0 or 1 we consider the apparent phase velocity measured between two stations on the same great circle as the
earthquake. Using, for example, the formula in Brune and Dorman [ 1963] (p. 1 70, equation 1), we obtain that
xb - xa
c
=
T
[
6l)J
+N
J
2rr ·
( 5)
where o4i
=
4i(xb) - 4i(xa) which must be evaluated numerically for specific values of xa' xb' kspectra, values of n are chosen for each frequency such that the phase is a continuous function of frequency. In equation 5 the value of N is chosen which results in the most "reasonable" phase veloc-ity curveo In practice, this ambiguity is almost never a problem for station separations less than about 600 km or so (for smaller separations all but the appropriate curve are highly unreasonable).
We observe that since the interfering waves are beating, there is in general a phase shift across each amplitude minimum, the sharpness and character of which depends on the relative excitation
A.. When the excitation of the two modes is comparable, the phase shift is approximately ir, all of it occurs very close to the minimum, and the jump in phase is infinitely sharp for A.= 1. For A.< 1
the phase shift is positive, decreases from 7T as A. decreases, and may be spread over a few hundred kilometers about the minimum.
For A.> 1 there is a negative phase shift whose sharpness decreases
and whose magnitude increases for increasing A. such that c - c 2
as A. - OOo If the beat wavelength is large compared to the station
separation (see figure 1 7), most measurements made of phase velocity will not be across an interference minimum, and hence
7T' phase shift
I
-·---,...,2oookm---·IFig. f 7 Illustration of the effect of equal-modt~
interference on the measurement of phase ve-locity. Phase velocity measured between a and b
will appear to be between the two phase vcloc.:iticH. Observations between stations c and d will give quite erratic results and low amplitudes and will usually be discarded.
the apparent phase velocity will appear to be between that of the
fundamental and the higher mode o The probability of crossing a
minimum is approximately proportional to the ratio of station
separation to beat wavelength. Whenever two stations do happen
to straddle an amplitude minimum there will be a strong tendency
to disregard the data, both because the amplitudes are low and
be-cause the phase spectra will often appear incoherent. Such
measure-ment biases are discussed further in the next section.
Figures 18 through 20 show curves of apparent phase velocity
computed from equation 5 for three spherical earth models and a
range of appropriate values of station separation, epicentral distance,
and relative excitation. In each curve we assume for simplicity that
A., the relative excitation, is not a function of frequency (the
restric-CIT llA
.--..,...---,--,.--~--..--....---~ ~-.---,~..---.---.--r--,
A 6.0
~4.0 c. .. 200
f Ila " 30CO •o • 3400 )lb .. 3200 )(b • 3800
f
3030L,--40~-d-50~60f.:.--±70~00L,--+,90--,.!IOO 30.30·'=--+-40~!l()~60f.:.--±70~00!=--+-90c---!.10QC D
~ao
/:i.•ll 600 40 ,6~o 800
•o c 3800 "a • 4400
.b" 4400 .b s 5200
"":io'.,___,.,40~50.,__.,.,,60_..,,10~00~~90,...-..-,100 3030.,_40~....,.50~60-=--·""'10____,00~""'90~,oo Period In sec Period in sec
Fig. 1..8 Apparent phase velocity computed for interference between fundamental and first higher mode Love waves, CITllA earth model, for rep-resentative values of relative excitation parameter
X, station separation L\x, and epicentral distances
Xa, Xb. Numbers on each curve refer to values of X.
Dotted curves are fundamental (X
=
0) and first higher mode (X=
oo) phase velocity curves."b. 5C><Xl
30.lO 40 ~o'flo-qt-··-irXJ 30y,
Period 1n sec
•tic'JAl)(J
J J • J 40 !'-.0 6() le) Ji() q()
Period m sec:
Fig. i 9 Apparent phase velocity computed for interference between fundamental and first higher mode Love waves, CANSD earth model, for
rep-resentative values of relative cxr.itation
pnram-eter X, station separation L\x, and epicentrnl
dis-tances Xa, Xb. Numbers on cnch curve rC'fer to
values of X. Dotted curves are fundnmentnl
(X
=
0) and first higher mode ('1.=
oo) phase ve-locity curves.tion is one of convenience, not necessity). We have attempted to be as representative as possible in the cases shown in the figures~
the range of possibilities and their approximate frequency of occur-rence are represented as accurately as possible in the number of cases illustrated. By avoiding all amplitude minima in our choice of plotted results we could have eliminated all of the irregularly fluctu-ating curves. Since the beat phenomenon is periodic, the same pat-tern of phase velocity curves will eventually occur, and the approxi-mate "wavelength" over which the predominant variations will repeat themselves is of the order of the average beat wavelength, or in the vicinity of 2000 km. This is about the range in epicentral distances computed for each earth model shown in the figures. The fundamen-tal (A.
=
0) and first higher mode (A.=
oo) phase velocity curves areAnderson Tectonic
.--..-~--.---.---r-r---, ,...--,--.,---,--.-~·
A
~ 40 ---©---~.-
.--=-e- '•. 3400
.s 11b•~OO
i-3{) g 30,..,,_4.,,_0~50,---;!;60___,7/;<-0 -;1r;---,;,.--,t.
~
.6.x• 600 Xa•400Q x0 •4600
3~ ~
50 60 ro oo oo 100
Period in sec
6.0
Period in sec.
Fig. 20 Apparent phase velocity computed for interference between fundamental and first higher mode Love waves, Anderson's tectonic earth model, for representative values of relative cxcitn-t.ion parameter X, station separation L\x, and
cpi-ccntral distanres Xa, Xb. Numbers on each curve
refer to vnlurs of X. Dotted curves arc funda-mental (;>..


![Figure 15 is the dispersion for Anderson and Harkrider's [ 1968]](https://thumb-us.123doks.com/thumbv2/123dok_us/7836183.1298633/44.532.138.343.233.394/figure-is-the-dispersion-for-anderson-and-harkrider.webp)
![Fig. p. 2978, per and Anderson {1966], path 101.6 Love wave spectrum energy densities unit = oceanic propagation in units of 15 ergs/km for buried horizontal forces of strength (L) 2 X 10111 dynes sec (from Harkrider figure 9)](https://thumb-us.123doks.com/thumbv2/123dok_us/7836183.1298633/46.544.81.441.442.632/anderson-spectrum-densities-oceanic-propagation-horizontal-strength-harkrider.webp)
