A Model For Predicting Influential Users In Social
Network
Sriganga B K1 , Ragini Krishna2, and Dr. Prashanth C M3
1
Post Graduate Student, Dept of CS&E, SCE, Bangalore, India.
2
Mrs.Ragini Krishna, Asst Prof, Dept of CS&E, SCE, Bangalore, India.
3
Dr. Prashanth C M, Prof and HOD, Dept of CS&E , SCE, Bangalore, India.
Abstract— In the recent past and in the envisaged future of
global business scenario, social networking platform such as : Face book, Twitter, Google plus +, LinkedIn, Orkut etc are visioned to get information, opinions, likes and dislikes, profile matching etc. These inputs are very essential parameters in order to design, devise and deliver many of the marketing and CRM strategies for corporates and organizations. In computational theory a social network can be represented in terms of defined structure either by tree or a graph. The network of nodes could be either static in nature or dynamic in nature as it evolves over period of time by adding or deleting nodes and edges. The study of influential members in a social network is an important research question in social network analysis. In order to find the most influential person, the most central node has to be identified. Centrality is the measure of most influential node, which is measured in terms of centrality metrics. There have been various definitions given by different researchers for centrality metric or variants of centrality metric, such as : degree centrality, closeness centrality, graph centrality,
between-ness centrality, dynamic centrality, α-centrality,
Eigen vector centrality, page rank, Katz Status score etc. It has been observed that most of the existing methods for measuring centrality metrics are suitable for static networks and the existing methods of computation of centrality either underestimate or overestimate centrality of some nodes. In this work concentration is laid on dynamic network in terms of dynamic centrality scores considering different values of tunable parameter. Then based on dynamic centrality score the most influential individual in a social network can be declared.
Keywords— Centrality, Dynamic Centrality, Graph Theory, Social Network Analysis.
I. INTRODUCTION
Social network is a network of people and their relationships. Social network will be consisting of a set of actors i.e. individuals and the ties which link them up. Social media can be seen as interaction among actors in a social network in which they generate large amounts of data in virtual communities and networks. Out of the data generated through social media, one can think of two major mining activities, which are content mining and structure mining. Content mining of social media includes discovering patters from the text, images, audio, video and other data generated by social media sites. Structure mining of social media includes network analysis of the node and connection (graph) structures underlying social media sites.
Social network analysis (SNA) falls under structure mining category and it is the study of social network in
order to identify different patterns which may be local or global, to identify the influential individuals and to analyze the dynamics in the network. Thus social network analysis involves a methodical analysis of social networks to view relationships in terms of network theory, consisting of nodes , which represents individual people within the network and edges, which represent relationship or link between the individuals, such as friendship, organizational position[1].
The most important problem in SNA is to measure the centrality of nodes in social networks. Centrality is used to identify important nodes. Many network centrality measures have been proposed such as : degree centrality, closeness centrality, graph centrality, between-ness centrality, α-centrality, eigen vector centrality, page rank, Katz Status score etc. All these metrics and algorithms have been applied to static networks. However the real world networks are dynamic in nature, because their topology can change over time with addition of new nodes and edges or removal of existing ones. It is important to find influential node using centrality metric for dynamic networks [2]. To achieve this, a metric generalized to the path-based centrality can be used in network analysis [3] which measures centrality of a node by the number of paths, of any length, that connects it to other nodes.
The dynamic centrality metric can be based on the intuition that in order for a message sent by one node in a network to reach another after some period of time, there must be a path that connects the source and destination nodes through intermediaries at different times.
Tunable parameters to be considered for measuring dynamic centrality are α which is to set length scale of interaction and γ to set time scale of interaction. As α
increases we will consider global measure and distant interactions are also considered and if α equals zero, then only direct edges are considered. As γ increases, older interactions are also considered, if γ equals zero, then only most recent interactions are taken into account and if γ
equals one, then it’s perfect retention, where in every past interaction is remembered.
II. RELATED WORK
In the year 1948 for the first time Bavelas introduced the idea of centrality as applied to system of human communication. References [4] give us insight into few aspects of history of centrality through the mid of 20th century. First studies on centrality conducted by Harold Leavitt in 1949 and Smith in 1950, these were reported by Sriganga B K et al, / (IJCSIT) International Journal of Computer Science and Information Technologies, Vol. 5 (3) , 2014, 4047-4053
Bavelas and Barrett in 195l , and first described in detail by (Leavitt, 1951). These reports all concluded that centrality was related to group efficiency in problem-solving, perception of leadership and the personal satisfaction of participants.
In the year 1958, Cohn and Marriott [5] used the centrality idea in their attempt to understand political integration in the context of the diversity of Indian social life. They sought to see how a nation as large and heterogeneous as India could be administered at all. Their conclusion was that every aspect of Indian social life was knit together by network centers that “bound and intertwined” diverse strands into a coordinated structure. Reference [6] explains that, Pitts in 1965 used consequences of centrality in communication paths for urban development. He reconstructed the twelfth century network of river transportation in central Russia in an attempt to explain the preeminence of the modern city of Moscow as it emerged from among the many hamlets in the area.
Beauchamp in 1965 and Mackenzie in 1966 explored the implications of centrality for the design of organizations. Beauchamp suggested that the efficiency of a new organization combining two or more existing one, could be optimized by connecting the subunits together at their most central points. Mackenzie, on the other hand, argued that the relationship between organizational structure and efficiency should depend upon the complexity of the organizational task
Phillip Bonacich et al., in “Eigenvector-like measures of centrality for asymmetric relations” [3] have outlined two approaches, eigenvectors and alpha-centrality. The second is always applicable regardless of the type of relation in the network while the first is only applicable to some networks. The two are equal when both apply. This provides a justification for calling the alpha-centrality approach a generalized eigenvector measure of centrality. Its identity to the eigenvector when both apply means that it can be interpreted in a parallel manner.
In the year 2003, Costenbader et al., in their work “The stability of centrality measures when networks are sampled” [9] have empirically analyzed the stability of centrality measures when networks are sampled.
In the year 2006, Dan Braha et al., in “From Centrality to Temporary Fame: Dynamic Centrality in Complex Networks” [7] have developed a new approach to the study of the dynamics of link utilization in complex networks using records of communication in a large social network. Counter to the perspective that nodes have particular roles, they find roles change dramatically from day to day. "Local hubs" have a power law degree distribution over time, with no characteristic degree value.
Phillip Bonacich in the work [7] mentioned centrality is equivalent to power, and proposed a new family of centrality measures C(α , β). The magnitude of α reflects degree to which centrality C(α , β) is local or global measure. The parameters α and β can be interpreted as a probability and C(α , β) as expected number of paths in a network activated directly or indirectly by each individual.
α can be thought of as a radius within which researcher wishes to access centrality.
Reference [8] tells dynamic network can be represented by time series, or snapshots, of the network, each of which aggregates links over a time scale much shorter than the entire observation period and will study how degree centrality evolves in a dynamic network. The focus in this work is to define an intuitive metric that enables us to rank nodes in a network. Generalization of centrality to dynamic networks is done. Using this metric one can rank nodes by how well they are connected to other nodes in the network through time, thereby identifying important or influential nodes
III. CENTRALITY IN SOCIAL NETWORKS
Centrality is an important notion in network analysis and is used to measure the degree to which network structure contributes to the importance of a node in a network. The centralization of any network is a measure of how central its most central node is in relation to how central all the other nodes are [4]. Centrality measure can be used to tell how influential a particular individual is in a social network.
Centrality as a measure of influence in social network According to Oxford English dictionary, the word influence is defined as “The capacity to have an effect on the character, development, or behaviour of someone or something, or the effect itself”. Pool and Kochen in [6], have stated that “influence in large part is the ability to reach a crucial man through the right channels, and the more the channels in reserve the better." Centrality can be used as a measure of influence factor, which is discussed further. In specific if we consider a social network, which is a network of individual, centrality would facilitate us to identify the most influential individual in that social network.
Social network can be represented by a graph G = (V, E), Where V nodes and E edges exist between them . Let A be adjacency matrix corresponding to graph G, such that Aij = 1 if an edge exists from i to j and Aij = 0 otherwise. The metric of influence depends only not on direct edges between nodes, but also on the number of ways a message can be transmitted through other intermediate nodes. Therefore, the capacity of node i to influence node j can be measured by the weighted sum of the number of n-hop paths present from the i to j [10]. Hence it would be correct to say that when ever there exists more number of paths from one node to another, there will be greater capacity to influence.
Phillip Bonacich in the work [7] mentioned centrality is equivalent to power, and proposed a new family of centrality measures C(α , β). α and β are the attenuation factors considered in centrality calculation, which set the length scale of interaction. Both these values ranges from 0 to 1. The magnitude of α reflects degree to which centrality C(α , β) is local or global measure. The parameters α and β
can be interpreted as a probability and C(α , β) as expected number of paths in a network activated directly or Sriganga B K et al, / (IJCSIT) International Journal of Computer Science and Information Technologies, Vol. 5 (3) , 2014, 4047-4053
indirectly by each individual. α can be thought of as a radius within which researcher wishes to access centrality. Bonacich in another work [3] has defined α-centrality, to measure total number of attenuated paths of any length between nodes i and j.
As we have considered A to be the adjacency matrix of a network, such that Aij = 1 if an edge exists from i to j and Aij = 0 otherwise. α-centrality matrix is given by the following equation 1
C(α,β)=βA+βαAA+……+βαnAn+1 (1)
Where,
β is the attenuation factor along a direct edge (from the originating node) in a path,
α is the attenuation factor along an indirect edge (from any intermediate node) in a path.
The first term in the equation 1 gives the number of paths of length one (edges) from nodes i to j, the second the number of paths of length two, the third the number of length three and so on.
The tunable parameter α sets the length scale of interactions. For α = 0, α -centrality takes into account direct edges only and reduces to degree centrality . As α
increases, C(α , β) becomes a more global measure, taking into account more distant interactions. Nodes can be ranked according to the number of paths that connect them to other nodes.
Work carried out in the project considers length scale of interaction ( α ) to find dynamic centrality matrix for a social network also uses time scale of interaction( γ ) to formulate retained dynamic centrality matrix as discussed in further chapters. Using which particular individuals in a social network can be declared as influential.
IV. METHODOLOGY
As centrality is used to identify important nodes in a social network. Though many centrality measures exists, most of those are applicable to static networks. But real time networks such as social networks are dynamic in nature, as the nodes and edges keep on getting added and deleted from network with time. Dynamic centrality measure can be done using the main methodology, based on the intuitive principle discussed in [2] which says:
“In order for one node in a dynamic network to influence another over some period of time, there must exist a path that connects the source and destination nodes through intermediataries at different times”
Approach: The measure of centrality for dynamic network here is a metric which generalizes path-based centrality and measures centrality of a node by the number of paths of any length that connect it to other nodes.
This metric is parameterized (uses) by factors that set both time ( γ ) and length ( α ) scale of interactions. Hence the methodology used here for dynamic centrality calculation to rank nodes of a dynamic network is by calculating number of time-dependant paths that connect them to other nodes in the network.
Methodology to represent dynamic network:
Dynamic network can be represented at time ti ( iϵ
1,2,…..n) by a graph Gti = (Vti,Eti), Where Vti nodes and Eti edges exist between them at time ti .
Let Ati be adjacency matrix corresponding to graph Gti, such that Aij = 1 if an edge exists from i to j and Aij = 0 otherwise.
A time series of network snapshots Gt1, Gt2, Gt3…Gtn can be used to represent a dynamic network over the time period {t1….tn}
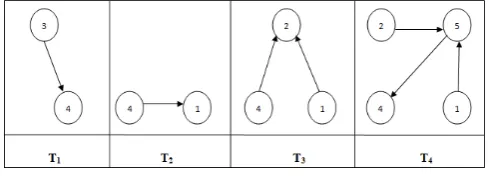
Figure 2 shows snapshots of the network showing only connected nodes at times T1,T2,T3 and T4
Figure 2. Network Snap Shots
Node i will only be able to send a message to node j at time tk iff there exists an edge between i and j at that time.
“The methodology employed in dynamic centrality metric for dynamic networks computes the number of paths between nodes i to j that exists over a period of time”.
Two important methods of dynamic centrality calculation discussed in [2] are elaborated next.
A. Memory-less Formulation
Assumption: Future state of the network Gtk+1 depends only on its current state Gtk, and none of its past states.
Each node propagates information it receives in current time step at the very next time step. Expected amount of information sent by node i at time t1 that reaches node j at time tn via sequence of intermediate nodes, given by (i ,j)’s element of dynamic centrality matrix is calculated using mathematical model shown in equation 2
Cd
t1->tn (β , α) = β A(t1) + βα A(t1) A(t2) +………..βαn-1
A(t1)…..A(tn) (2)
Where Cd is dynamic centrality matrix ; α and β are attenuation factors and A(tn) is adjacency
matrix representing the network at time instance tn.
Algorithm for memory less formulation of dynamic centrality:
Step 1 : Defining X co-ordinates of graph G(V,E) and Defining Y co-ordinates of graph G (V,E)
Step 2: Calculating total number of vertices Step 3: Plotting graph using marker for nodes
For Adjacency Matrix formulation
Step 4: Initialize n-dimensional adjacency matrix will all zeroes.
Step 5: Based on connectivity (edge availability) create different instances of adjacency matrix.
Step 6: Show the connectivity with respect to time in different instances.
Sriganga B K et al, / (IJCSIT) International Journal of Computer Science and Information Technologies, Vol. 5 (3) , 2014, 4047-4053
For Dynamic centrality matrix calculation
Step 7 : Assume constant values of attenuation factors α
and β
Step 8: For each pair of vertices (i , j), calculate expected amount of information sent by node i at time t1 that reaches node j at time tn via sequence of intermediate nodes, given by (i ,j)’s element of dynamic centrality matrix.
Cd
t1->tn (β , α) = β A(t1) + β α A(t1) A(t2)
+………..βαn-1 A(t
1)…..A(tn)
For Cumulative Dynamic centrality matrix calculation Step 9 : Let in the interval {t1….tn} the information
propagate from i to j.
Then the cumulative expected amount of information reaching j from i in {t1…tn} is calculating :
Cd ( β , α, {t1…tn} ) = ∑ Cd tk->tn( β , α )
B. With Memory Formulation
Assumption: In dynamic network the future state of the network Gtk+1 may depend not only
on its current state, but also on its past Gti. Retained dynamic centrality matrix calculation is
done using the equation 3 RCd
t1->tn (β , α, γ ) = β R(t1,γ) + βα R(t1,γ) R(t2,γ) +...β αn-1 R(t
1,γ)..R(tn,γ) (3)
Where Cd is dynamic centrality matrix ; α ,β and γ are attenuation factors and R(tn,γ) is retained adjacency
matrix representing the network at time instance tn.
Algorithm for with memory formulation of dynamic centrality:
Step 1 : Defining X co-ordinates of graph G(V,E) Defining Y co-ordinates of graph G (V,E) Step 2: Calculating total number of vertices
Step 3: Plotting graph using marker for nodes
Step 4: Declare a label vector and label the nodes respectively
For Adjacency Matrix formulation
Step 5: Initialize n-dimensional adjacency matrix will all zeroes.
Step 6: Based on connectivity (edge availability) create different instances of adjacency matrix.
Step 7: Show the connectivity with respect to time in different instances.
For Dynamic centrality matrix calculation
Step 8 : Assume constant values of attenuation factors α , β
and γ
Calculate Retained Adjacency Matrix as shown in next step
Step 9:
R( tn; γ) = { A(tn) + γ A(tn-1) +_ _ _ + γn-1A(t1); if n < m
R( tn; γ) = { A(tn) + γ A(tn-1) + _ _ _+ γ m-1A(tn-m+1);
otherwise
Step 10: For each pair of vertices (i , j), calculate expected amount of information sent by node i at time t1 that reaches node j at time tn via sequence of intermediate nodes, given by (i ,j)’s element of retained dynamic centrality matrix
RCd
t1->tn (β , α, γ ) = β R(t1, γ) + β α R(t1, γ) R(t2, γ)
+………..βαn-1 R(t
1,γ)…..R(tn,γ)
For Cumulative retained dynamic centrality matrix calculation
Step 10 : Let in the interval {t1….tn} the information propagate from i to j.
Then the cumulative expected amount of information reaching j from i in {t1…tn} is calculating :
RCd ( β , α, γ, {t
1…tn} ) = ∑ RCd tk->tn( β , α, γ ).
Below shown in algorithmic flow
V. RESULTS AND DISCUSSIONS Cumulative Dynamic Centrality Matrix is given by :
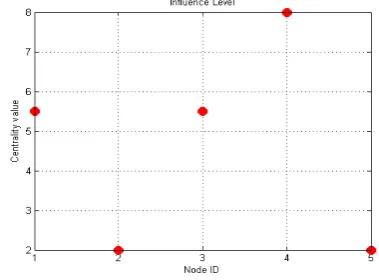
The Graphical representation of Influence level for different nodes taken on X-axis against centrality value on Y-axis as calculated using dynamic centrality matrix is as shown in figure 3
Figure 3 Influence level by dynamic centrality matrix Sriganga B K et al, / (IJCSIT) International Journal of Computer Science and Information Technologies, Vol. 5 (3) , 2014, 4047-4053
Retained Cumulative Adjacency Matrix is given by :
The Graphical representation of Influence level for different nodes taken on X-axis against centrality value on Y-axis as calculated using retained dynamic centrality matrix is as shown in Figure 4
Figure 4 Influence level by retained dynamic centrality matrix
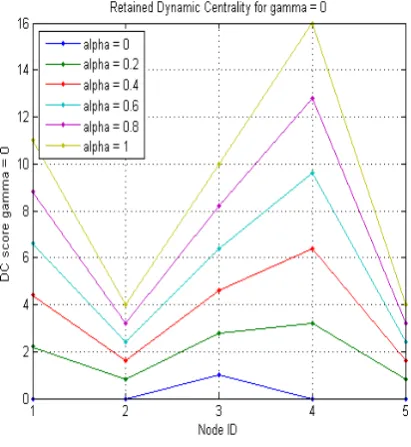
A. Analysis for different values of gamma
We apply dynamic centrality to study the sample network shown in Figures 5, 6 and 7 shown below plots dynamic centrality score of each node.
Each plot shows results for a different value of γ , and each line in the plot corresponds to a different value of
α from 0.0 to 1.0 in steps of 0.2 from the bottom.
Figure 5 DC score for γ = 0
Figure 6 DC score for γ = 0.5
Figure 7 DC score for γ = 1
Inferences:
We observe from above plots that for γ = 0 (Figure 5),
γ = 0.5(Figure 6), γ = 1 (Figure 7) node 4 has the highest score for all values of α, and thus node 4 is highest ranked node.
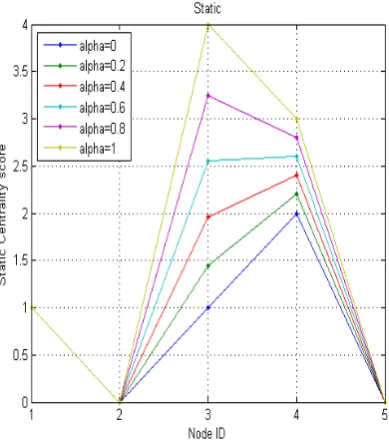
B. Static v/s Dynamic centrality comparison
Figure 8 and Figure 9 shows static centrality scores for cumulative network that aggregate edges over time periods t1 to t2 and t1 to t3 respectively.
Figure 8 Static Centrality score for t1 to t2 Sriganga B K et al, / (IJCSIT) International Journal of Computer Science and Information Technologies, Vol. 5 (3) , 2014, 4047-4053
Figure 9 Static Centrality score for t1 to t3
Inference:
Radically different ranking are got through static centrality measure. In the static networks that aggregate edges over periods t1 to t2 (Figure 8) and t1 to t3 (Figure 9) , node 3 is considered most, which is untrue as in dynamic centrality it has been proven that node 4 is the most influential of all the nodes.
C. For actual dataset
Below shown are social network snapshots of 10 individuals taken over a period of 3 days/years. Figure 10, Figure 11, Figure 12 represent Day1, Day2 and Day3 respectively.
Figure 10 Social Network on Day 1
Figure 11 Social Network on Day 2
Figure 12 Social Network on Day 3
Figures 13 shown below is dynamic centrality score of 10 different individuals plotted for given n days in a social network interaction . Each line in the plot corresponds to a different value of α from 0.0 to 1.0 in steps of 0.2 from the bottom.
Figure 13 DC score for dataset values Sriganga B K et al, / (IJCSIT) International Journal of Computer Science and Information Technologies, Vol. 5 (3) , 2014, 4047-4053
Inference:
From above shown graph in Figure 14 we can infer that the person 7 (Node ID = 7) is most influential out of 10 persons given in dataset of a social network for a term of given n days. The peaks in the graph are consistent for person 6 for different values of alpha ranging from 0 to 1.
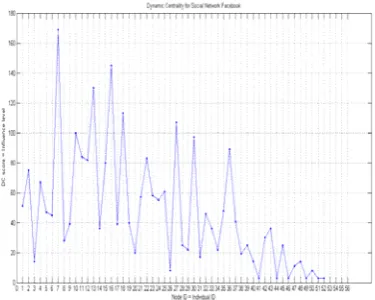
D. Real World Social Network Datasets
Figure 14 shows the graph plotted for Facebook dataset. From the graph we get the inference that Person with id 7 is the most influential user.
Figure 14 DC for Facebook dataset
Figure 15 shows the graph plotted for Twitter dataset. From the graph we get the inference that Person with id 9 is the most influential or interactive user over a period of time, i.e. in a dynamic network.
Figure 15 DC for Twitter dataset
VI. CONCLUSION
It has been observed that most of the existing methods for measuring centrality metrics are suitable for static networks (not for dynamic networks) and the existing methods of computation of centrality either underestimate or overestimate centrality of some nodes.
The real world networks are dynamic in nature, because their topology can change over time with addition of new nodes and edges or removal of existing ones. Hence is important to find influential node using centrality metric for dynamic networks. Temporal ordering of edges is not considered in case of static centrality measures, in other words measure is not taken to see how well nodes are connected to other nodes in the network through time.
Dynamic centrality can be used to rank nodes by the number of time-dependent paths that connect them to other nodes in the network. Hence discovering best connected or influential nodes/individual in a social network is achieved here.
REFERENCES
[1] Pinheiro, Carlos A.R. Social Network Analysis in
Telecommunications.JohnWiley&Sons.p. 4. ISBN 978-1-118-01094-5., 2011
[2] Kristina Lerman, Rumi Ghosh, Jeon Hyung Kang : Centrality Metric for Dynamic Networks, University of Washington DC, USA, 2010.
[3] P. Bonacich. Eigenvector-like measures of centrality for assymetric relations. Social Networks, 2001.
[4] L. C. Freeman. Centrality in social networks conceptual clarifcation. Social Networks.
[5] B.S. Cohn and M. Marriott. Networks and centres of
integration in Indian civilization. Journal of Social Research, 1:1–9, 1958.
[6] I. de Sola Pool and M. Kochen. Contacts and influence. Social Networks, 1(1):39-40, 1978-1979.
[7] Bonacich, P.B., 1987. Power and centrality: a family of measures. American Journal of Sociology 92, 1170–1182 [8] D. Braha and Y. Bar-Yam. From centrality to temporary fame :
Dynamic centrality in complex networks. Social Science Research Network Working Paper Series, 2006.
[9] Elizabeth Costenbader and Thomas W. Valente, The stability of centrality measures when networks are sampled, Social Networks,NH-ELSEVIER 2003
[10] R. Ghosh and K. Lerman. Community detection using a measure of global influence. KDD workshop on Social Network Analysis (SNAKDD), August 2008.
Sriganga B K et al, / (IJCSIT) International Journal of Computer Science and Information Technologies, Vol. 5 (3) , 2014, 4047-4053