ISSN 2286-4822
www.euacademic.org DRJI Value: 5.9 (B+)
Quality of Financial Reporting, Investment and
Quality of Disclosure: With Stressing on Type of
Financing
FERESHTEH MAHDIAN1
M.A Student in Accounting Marand Branch, Islamic Azad University, Marand Iran
DR. HEYDAR MOHAMMADZADEH SALTEH
Department of Accounting Marand Branch, Islamic Azad University, Marand Iran
DR. MEHDI ZEYNALI
Department of Accounting Tabriz Branch, Islamic Azad University, Tabriz Iran
Abstract:
Key words: quality of financial reporting, sensitivity of investment, bank financing, quality of disclosure
Introduction
With regard to economic aspects of information, financial reporting and accounting system play a vital role in capital markets. First, accounting information allows to capital providers (including shareholders and creditors) to evaluate the potential return on investment opportunities (evaluation role or prior to accounting information). Second, it permits to investors to monitor the use of granted funds (or stewardship role or after accounting information). Generally, delegacy and information asymmetry prevent the efficient allocation of resources in capital market. Financial statements with quality are one of the mechanisms that facilitate the transfer of information between management and investors and play an important role in reducing information asymmetry (Mohammadi, 2008).
Investment efficiency means accepting projects with positive net present value; the investment inefficiency is choosing projects with negative net present value (over-investment) or non-selection of investment opportunities (under-investment). On the other hand, despite claims that quality of financial reporting could have economic implication for efficiency of investment, there is little empirical evidence for this relationship (ibid.). This study is examined the relationship between financial reporting quality, investment and quality of disclosure with emphasis on the type of financing.
Rapid growth and transformation of economic relations have led to intense competition in the field of trade, industry and investment. Therefore, companies require appropriate investments to survive and expand their activities (Chen & et
cost is shares issuing and another solution which is considered as a final option and is usually dependent on the company's reputation is bank financing. All proposed methods are usually increased the use of investment opportunities (Beck and Levine, 2002). Managers are trying to survive and grow in their organizations by using obtained resources. Meanwhile, intense competitive conditions, financial, economic, political crisis and legal and ownership requirements led to companies had been demanding for more resources. Further, they sometimes reinvested the resources of economic operations results that are belonged to owners into business unit. Finally, management optimal performance in relation to decisions made will be released to the public through the quality of financial reports (Bushman and Smith, 2001).
Method
The method of this research is of correlation in terms of nature and content. It deals to correlation analysis by using secondary data extracted from financial statements of companies listed in Tehran Stock Exchange. This research was conducted within the framework of deductive-inductive reasoning. The reason of using co-relational method is discovering the relationships between variables. Co relational research is one of the descriptive types of studies. In the present study, we initially tested the correlation between variables; if there was a correlation between variables we will attempt to estimate multiple regression models. On the other hand, this study is an ex post facto (quasi-experimental) research, that is, it is performed based on the analysis of past and historical information (financial statements). Further, the research is of library and analytical-causal studies and is also based on panel data analysis. It is considered as practical in terms of purpose and as descriptive-correlation as regards method. In this study, the relationship of financial reporting quality, investment and disclosure quality with an emphasis on the type of financing is being correlation tested. Accordingly, the study is based on quantitative data analysis. This study is part of applied research. Applied research are studies that are performing using the results of basic researches to improve and bring the behaviors, methods, tools, equipment, products, structures and patterns used in human societies to perfection. Applied researches are also studies that apply theories, laws, principles and techniques that are developed in basic researches to solve implementation issues.
The population of this study consisted of all listed companies in Tehran Stock Exchange.
Actual data required for this research will be collected from the actual data of companies at Tehran Stock Exchange. In this study, the sample size is determined by applying the following conditions:
1- To increase the comparability, their fiscal period ended to March 29.
2- During the period under investigation (2006 to 2011) it does not have change in financial year.
3- Financial information is available.
3- Their balance sheet has being bank financing at least three consecutive years.
4- It is not part of financial companies (such as banks, financial institutions) and investment firms or financial intermediation companies.
5- Information required in section defines the variables is available.
Finally, based on screening method (according to table 1-3) the sample is 133 companies.
The data for this study will be collected through computer databases and referring to the library of Securities and Exchange Organization, using Rahavard Novin and Tadbir Pardaz software, research management website, Islamic development and studies of Securities and Exchange Organization2. Companies’ financial statements including
balance sheet, cash flow statements and notes accompanying the financial statements at the end of each financial year (March 29) have been used as a research tool.
First, Kolmogorov-Smirnov (K-S) is used to examine the normality of data distribution, and then Durbin-Watson test is applied for testing this that number of samples (observations) being independent and the sample being random. If the
statistic value of Durbin-Watson test is about 2 (nearly 2 ± 0.5), it means that the sample is random and represents the lack of self-correlation. Pearson correlation coefficient is also investigated between variables. Coefficients of regression model variables are tested using T-student test. In this study, Durbin-Watson test is used to test the overall significance of regression model fitted to the Fisher statistic (F) in 95% confidence level as well as to test the lack of correlation between errors of the model. At the end, the error components curve was plotted in regression model to assess normality of error components. Using linear regression (Linear-Regression) we will test the hypotheses. In this study, the multivariate regression method will be used as statistical method and panel data. In the regression, the main objective is to examine whether there is a relationship between dependent and independent variables or not. Moreover, data analysis in descriptive statistics will be started by calculating central parameters including mean, median and distribution indexes of standard deviation, skewness and skewness elongation. These indicators will be conducted by separate industries and as a whole. After necessary corrections and classification based on variables, collected data entered Spss software using Excel software and the final analysis will be conducted. Ultimately, we will focus on confirming or refusing the research hypotheses using the results of Spss and EViews 7 software.
Results
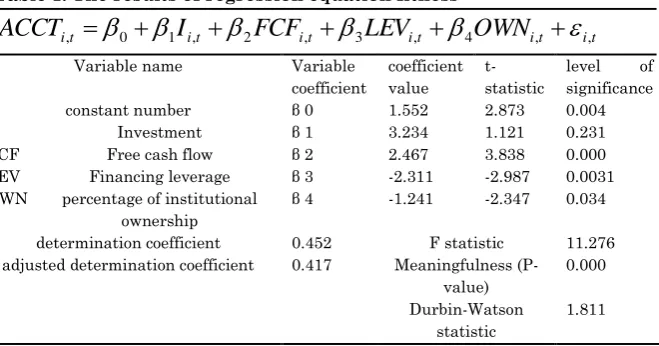
In this study, the following regression model is used to investigate the relationship between firm investment and quality of financial reporting:
t i t i t
i t
i t
i t
i
I
FCF
LEV
OWN
The statistic value of F (11.276) shows that the overall regression model is significant. As shown below in table 1, determination coefficient and adjusted determination coefficient of above model are 45.2% and 41.7%, respectively. Thus, we can conclude that in the regression equation, only about 41.7% of changes in financial reporting quality of companies are explained by independent and control variables. According to table 1, we can say that in above equation all variables are significant in 95% confidence level.
Table 1. The results of regression equation fitness
t i t i t
i t
i t
i t
i
I
FCF
LEV
OWN
ACCT
,
0
1 ,
2 ,
3 ,
4 ,
,Variable name Variable
coefficient
coefficient value
t-statistic
level of significance
constant number β 0 1.552 2.873 0.004
I Investment β 1 3.234 1.121 0.231
FCF Free cash flow β 2 2.467 3.838 0.000
LEV Financing leverage β 3 -2.311 -2.987 0.0031
OWN percentage of institutional ownership
β 4 -1.241 -2.347 0.034 determination coefficient 0.452 F statistic 11.276 adjusted determination coefficient 0.417 Meaningfulness
(P-value)
0.000 Durbin-Watson
statistic
1.811
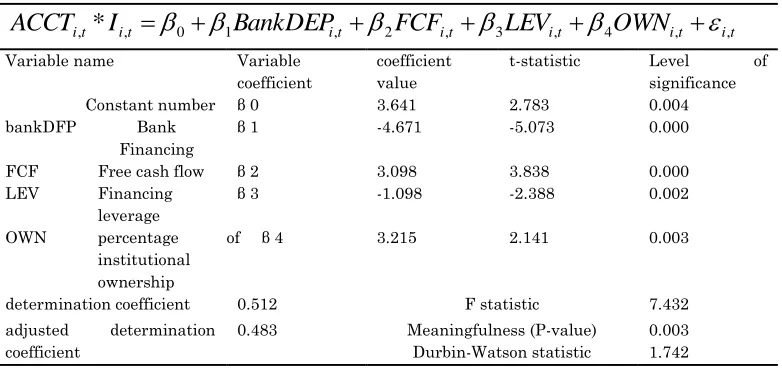
In this study, the following regression model is used to examine the interaction between financial reporting quality and sensitivity of company investment with bank financing:
t i t i t
i t
i t
i t
i t
i
I
BankDEP
FCF
LEV
OWN
ACCT
,*
,
0
1 ,
2 ,
3 ,
4 ,
,above independent and control variables.
According to data of table 2, there is a reverse relationship between financial reporting quality and sensitivity of company investment with bank financing.
Table 2. The results of regression equation fitness
t i t i t
i t
i t
i t
i t
i
I
BankDEP
FCF
LEV
OWN
ACCT
,*
,
0
1 ,
2 ,
3 ,
4 ,
,Variable name Variable
coefficient
coefficient value
t-statistic Level of significance
Constant number β 0 3.641 2.783 0.004
bankDFP Bank
Financing
β 1 -4.671 -5.073 0.000
FCF Free cash flow β 2 3.098 3.838 0.000
LEV Financing leverage
β 3 -1.098 -2.388 0.002
OWN percentage of
institutional ownership
β 4 3.215 2.141 0.003
determination coefficient 0.512 F statistic 7.432
adjusted determination coefficient
0.483 Meaningfulness (P-value) 0.003 Durbin-Watson statistic 1.742
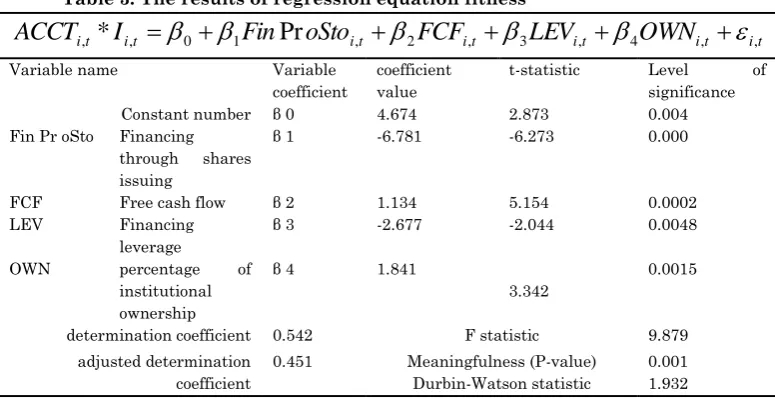
In this research, the following regression model is used to investigate the interaction and reverse association between financial reporting quality and sensitivity of company investment with financing through issue of shares, third hypothesis of study:
t i t i t
i t
i t
i t
i t
i
I
Fin
oSto
FCF
LEV
OWN
ACCT
,*
,
0
1Pr
,
2 ,
3 ,
4 ,
,variables. Also, according to the data of table and markings can be stated that the relationship between financial reporting quality and sensitivity of company investment with financing through shares issuing is reverse.
Table 3. The results of regression equation fitness
t i t i t
i t
i t
i t
i t
i
I
Fin
oSto
FCF
LEV
OWN
ACCT
,*
,
0
1Pr
,
2 ,
3 ,
4 ,
,Variable name Variable
coefficient
coefficient value
t-statistic Level of significance
Constant number β 0 4.674 2.873 0.004
Fin Pr oSto Financing through shares issuing
β 1 -6.781 -6.273 0.000
FCF Free cash flow β 2 1.134 5.154 0.0002
LEV Financing
leverage
β 3 -2.677 -2.044 0.0048
OWN percentage of
institutional ownership
β 4 1.841
3.342
0.0015
determination coefficient 0.542 F statistic 9.879
adjusted determination coefficient
0.451 Meaningfulness (P-value) 0.001 Durbin-Watson statistic 1.932
In this study, the following regression model is used to examine the correlation between disclosure quality and bank financing:
t i t i t
i t
i t
i t
i
BankDEP
FCF
LEV
OWN
VDIS
,
0
1 ,
2 ,
3 ,
4 ,
,The statistic value of F (14.765) also suggests that the overall regression model is significant. In the regression equation, only about 29.7% of the changes in disclosure level of surveyed companies are explained by above independent and control variables. According to the data in table 4 and markings can be stated that the relationship between disclosure quality and bank financing is significant and negative.
t i t i t i t i t i t
i
BankDEP
FCF
LEV
OWN
VDIS
,
0
1 ,
2 ,
3 ,
4 ,
,t i t i t i t i t i t
i
BankDEP
FCF
LEV
OWN
VDIS
,
0
1 ,
2 ,
3 ,
4 ,
,Variable name Variable
coefficient
coefficient value
t-statistic Level of significance
constant number β 0 -2.677 -2.044 0.0048
bankDFP Bank Financing
β 1 -3.841 -3.342 0.0015
FCF Free cash flow β 2 0.311 2.987 0.0037
LEV Financing leverage
β 3 1.241 2.847 0.014
OWN percentage of institutional ownership
β 4 -0.671 -2.297 0.022
determination coefficient 0.361 F statistic 14.765
adjusted determination coefficient
0.297 Meaningfulness (P-value) 0.000 Durbin-Watson statistic 1.787
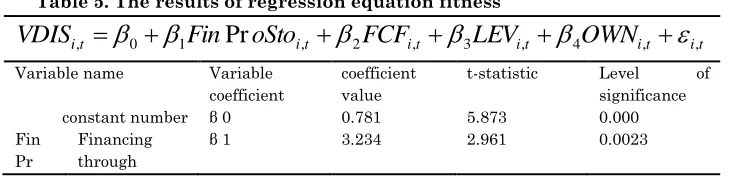
In this study, the following regression model is used to investigate the relationship between disclosure quality and financing through shares issuing:
t i t i t i t i t i t
i
Fin
oSto
FCF
LEV
OWN
VDIS
,
0
1Pr
,
2 ,
3 ,
4 ,
,The statistic value of F (18.342) also indicates the significance of overall regression model. According to table 5, only about 337.7% of changes in disclosure quality of considered companies are explained by above independent and control variables. At the end it can be concluded that the relationship between quality of disclosure and financing through shares issuing is positive.
Table 5. The results of regression equation fitness
t i t i t i t i t i t
i
Fin
oSto
FCF
LEV
OWN
VDIS
,
0
1Pr
,
2 ,
3 ,
4 ,
,Variable name Variable coefficient
coefficient value
t-statistic Level of significance
constant number β 0 0.781 5.873 0.000
Fin Pr
Financing through
oSto shares issuing
FCF Free cash flow β 2 3.232 2.112 0.034
LEV Financing leverage
β 3 2.009 1.987 0.048
OWN percentage of institutional ownership
β 4 -0.451
-2.211
0.028
determination coefficient
0.363 F statistic 18.342
adjusted determination coefficient
0.337 Meaningfulness (P-value) 0.000 Durbin-Watson statistic 2.018
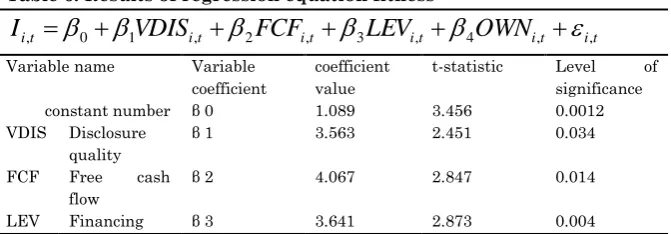
In this study, the following regression model is used to test the effect of disclosure quality on sensitivity of investment:
t i t i t i t i t i t
i
VDIS
FCF
LEV
OWN
I
,
0
1 ,
2 ,
3 ,
4 ,
,The statistic value of F (14.542) also indicates the significance of overall regression model. As shown below in table 6, determination coefficient and adjusted determination coefficient of above model are 45.2% and 41.7%, respectively. Thus, we can conclude that in the regression equation, only about 41.7% of changes in firms’ investment sensitivity are explained by the independent and control variables.
And according to the data in table 6 and signs can be stated that the disclosure quality has a positive effect on sensitivity of investment.
Table 6. Results of regression equation fitness
t i t i t i t i t i t
i
VDIS
FCF
LEV
OWN
I
,
0
1 ,
2 ,
3 ,
4 ,
,Variable name Variable coefficient
coefficient value
t-statistic Level of significance
constant number β 0 1.089 3.456 0.0012
VDIS Disclosure quality
β 1 3.563 2.451 0.034
FCF Free cash flow
β 2 4.067 2.847 0.014
leverage OWN percentage of
institutional ownership
β 4 2.034
5.073
0.000
determination coefficient
0.452 F statistic 14.542
adjusted determination coefficient
0.417 Meaningfulness (P-value) 0.000 Durbin-Watson statistic 2.134
Conclusion
Financial reporting of companies should provide information that is useful for actual and potential investors, creditors and other users in rational investments, credit grant and similar decisions (Gorton and Schmid, 2000). Increasing the quality of these reports can make companies investments more efficient and can maintain and develop their resources (Francis & et al, 2005). Recent research reveals that increase in financial reporting can have economic consequences and can enhance the use of investment opportunities (Ball, 2001). Increasingly creating and developing businesses need substantial financing that is often out of founders’ control. Capital market for these companies offers the possibility of providing the required funds through stock exchange offerings (Bushman and Smith, 2001). Another way of financing, which usually has a lower cost, is shares issuing. Moreover, another solution that is considered as final option and is usually dependent on company‘s reputability is bank financing that all proposed methods are usually climbed the use of investment opportunities (Beck and Levine, 2002).
shares issuing were used as dependent and independent variables respectively. Furthermore, we used a series of control variables to determine the proper relationship between independent and dependent variables such as: free cash flows, leverage, and proportion of institutional shareholders’ ownership that have indirectly impact on independent variables. In fact, in this research, the relationship between quality of financial reporting, investment and disclosure quality with stressing on the type of financing (bank or shares issuing) has been studied.
REFERENCES
Ball, R. 2001. “Infrastructure Requirements for an Economically Efficient System of Public Financial Reporting and Disclosure.” Brookings-Wharton Papers
on Financial Services: 127-69.
Beck, Thorsten and Ross Levine. 2002. "Industry Growth and Capital Allocation: Does Having a Market- or Bank Based System Matter?." Journal of Financial Economics 64 (2): 147-180.
Boot, A., and A. Thakor. 1997. “Financial System Architecture.”
Review of Financial Studies 10: 693-733.
Burgstahler, D., Hail, L., Leuz, C. 2006. “The importance of reporting incentives: Earnings management in European private and public firms.” The Accounting
Review 81: 983-1016.
Bushman, R., and A. Smith. 2001. “Financial Accounting Information and Corporate Governance.” Journal of
Accounting and Economics 32(1-3): 237-333.
Incentives and Effects on Cost of Capital around the World.” The Accounting Review 80 (4): 1125–62.
Gorton, G. and Schmid, F. 2001. “Universal Banking and the Performance of German Firms.” Journal of Financial
Economics 58: 29-80.
Gorton, G. and Schmid, F. 2004. “Capital, Labor, and the Firm: A Study of German Codetermination.” Journal of the
European Economic Association 2: 863-90.