ISSN 2348 – 7968
Monte Carlo Simulation Method to Predict
the Charging Load Curve
Biao Yang 1, Cheng Zeng 2, Peichuan Pang 3,Qian Zhang4
State Key Laboratory of Power Transmission Equipment & System Security and New Technology, Chongqing University
,Chongqing, 400044, P.R.China
Abstract
The paper focus on analyzing charging characteristics of different types EV, which includes the charging time, initial charge capacity and initial charging time, predicting the quantity of different EV types in the future. Based on the charging power of different kind of charging characteristics of different type of EV, it uses the Monte Carlo simulation method to predict the EV charging load curve, analyzes the EV charging load impact on the power grid. Based on the study, the estimated level of future EV charging load in China is calculated and analyzed. The result shows that with the development of EV in China, the future impact of EV charging load on the grid will continue to enhance and the huge peak-valley difference provides a substantial potential to coordinate the charging of PEVs.
Keywords: electric vehicles, charging mode, Monte Carlo
simulation, load curve.
1. Introduction
As energy problems become increasingly serious and electric vehicle (EV) technology grows mature, the impact of EVs on power grid has become more and more prominent. EVs not only cause partial overload in the process of charging and discharging, but also produces harmonic pollutions in this process and affects the quality of electric energy in power grids. Therefore, it is of great significance to grasp the load demands of EVs accurately in a timely manner, for the operation and planning of power system.
The core issue of predictions for EV charging loads is prediction techniques. Common prediction techniques for power system loads include unit consumption, time series, gray model, neural network, Delphi, expert system and optimal portfolio analysis, etc. Due to the uncertainty of EV positions and randomness of charging time and other factors, the loads of EV charging and changing stations are time-varying. It is hard to describe their complicated nonlinear characteristics with the above traditional methods. For this reason, we consider using Monte Carlo Simulation, data mining and data analysis to process data containing these uncertainty factors, explore and summarize their distribution laws and propose a reasonable prediction method.
2. An Analysis of EV Charging Modes in
China
Major types of EV in China include buses, taxies, official and private cars, etc. Different types of EVs have different battery characteristics, charging hours and frequencies.
Table 1:A Comparison between Different EV Charging Modes in China
2.1 The Charging Mode of Electric Buses
To take Beijing for example, the operating time of buses is generally from 6:00 to 22:00, a total of 16 hours, without stop. The average daily travelling distance is about 150-200km. The peak hours of buses are commute hours in a day (7:00-9:00, 17:00-19:00). During this period, departure intervals are short, usually 5-7 minutes. In other periods, departure intervals are longer, about 10-12 minutes. According to a survey, the current rated travelling distance of electric buses (EBs) is 200km. To guarantee normal operation, they should be charged twice a day. In order to ensure maximum benefits and reduce pressure on power grids, different charging modes should be used in the day and at night. Therefore, it can be reasonably assumed that EBs are charged during 9:30-16:30 in the day (fast charge) and 23:00-5:00 at night (normal charge). The start SOC per charge follows normal distribution N(0.5,0.01) [2]. The daily travelling distance directly determines the start SOC. Generally, the daily travelling distance is logarithmically and normally distributed. The probability density function is [1]
Chargi ng Modes
Rated Voltage
/V
Rated Current /A
Applicable Sites
L1 Single-phase 220
16 Homes
L2
Single-phase 220
32
Shopping malls and parking
lots, etc. Three-phase
380
32
Three-phase 380
2
2
( ) 2 2
1
0
2
d u
g
e
σd
πσ
− −
=
>
(1)
Where
u
is expectation andσ
is variance.The start SOC directly affects the length of EV charging time. The start SOC can be calculated with the following formula:
(1
) *100%
m
L
soc
L
= −
(2)
Where
L
m is the travelling distance after a fullcharge.
L
mis the available travelling distance after a full charge.2.2 The Charging Mode of Electric Taxies
Electric Taxies (ETs) can recharge or replace batteries. Most ETs of interest in this paper are recharged. The travelling routes of ETs are relatively flexible. The average daily travelling distance is 350-400km. They need to be charged twice a day. Taxies work two shifts. Batteries will be charged before the next shift. The shift time is usually 6 a.m. and 4 p.m. 11:30-14:00 in the day is for fast charge and 0:00-5:00 at night is for general charge. ETs are charged twice a day. The start SOC follows normal distribution N (0.3, 0.01).
2.3 The Charging Mode of Electric Official Cars
Due to the particularity of official cars (OCs), their charging time is flexible. There is abundant charging time for OCs, so they often choose general charge. Generally, OCs are parked in parking lots at night. Their charging time can be 18:00-7:00. For fear of procrastinating work the next day, it is reasonably assumed that OCs are charged once a day. The start SOC follows normal distribution N (0.4,0.01).
2.4 The Charging Mode of Electric Private Cars
Private cars (PCs) are mainly for the convenience of car owners who commute and go out in holidays. Every day, 90% of the PCs are at a standstill. Their charging time is abundant. In workdays and holidays, the charging modes and hours of PCs are different. According to a survey, PCs in China travel about 15000-2000km each year. The average daily travelling distance is about 47.9km. PCs are basically parked in parking lots or shopping malls when not in use. They adopt general charge and are charged twice a day, 8:00-17:00 in the day and 19:00-7:00 at night, respectively. The start SOC per charge follows normal distribution N(0.6,0.01)[2].
3.
The Calculation of EV Charging Loads
Based on Monte Carlo Simulation
The EV charging load prediction technique based on Monte Carlo Simulation refers to building probability distributions for start charging time and start charging state, etc., taking charging power, number of EVs, battery capacity and other influencing factors into account, adding up the charging load of each EV and getting a total charging load through Monte Carlo mathematic experiments.
3.1 The Generation of True Random Numbers
Monte Carlo method is a method used to solve physical and mathematical problems by repeated statistical experiments. When addressing problems with Monte Carlo method, solutions are often constructed as mathematical expectations of a certain random variable. This random variable is derived from a hypothetical experiment on certain figures on a computer. The arithmetic mean value of its specific value is used as an approximate solution of the problem. It is worth noting that Monte Carlo Simulation has a high requirement for random numbers. Some pseudo-random numbers may bring about errors in the entire simulation and predicted results. Domestic and foreign scholars generally employ Matlab, Excel and other software to generate random numbers, which are pseudo-random numbers and will cause inaccuracy in some predicted results. Therefore, we use mixed congruential method to generate random numbers and carry out randomness test, to get true random numbers.
The recursive formula of mixed congruential method is
[3-5]
:
1
mod(
,
)
i i
x
=
Ax
−+
C M
(3)
Where mod is a function for taking remainders, A is multiplier, C is increment and M is module. A, C, M are all positive integers. Given a start value x0, we can elicit
x1, x2, …,xn.. Dividing this numerical sequence by M, we
can get a random number sequence ri, which is uniformly
distributed in [0,1]. With respect to the randomness test of random number sequences, we choose non-consistency test [4], to classify N random numbers which occur successively into two types or k types according to their sizes, check whether there is no consistency in the occurrence of each type, so as to determine true random numbers.
3.2 The Calculation of EV Charging Loads
First of all, we get the charging load of a single EV of each type. After adding them up in proper order, we can get a total charging load curve. The charging loads are calculated by day. Dividing a day into 1440 minutes, the total charging load in the ith minute is the sum of charging loads of all vehicles by this time. It can be represented as:
, 1
L
Ni n i n
P
=
ISSN 2348 – 7968
Where is the total charging power in the ith minute.
i=1,2…,1440. N is the total number of EVs. is the
charging power of the nth vehicle in the ith minute[7].
3.3 EV Charging Load Models
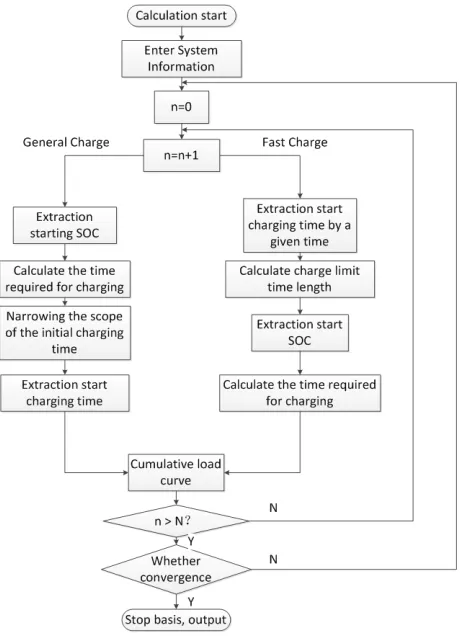
The difficulty in calculating EV charging load lies in the randomness of start charging time and start SOC. Assuming that power grids don’t control the charging behavior of EVs, EVs are charged immediately after connected to power grids. The start SOC and start charging time of each vehicle can be extracted by Monte Carlo Simulation. The start charging time varies by models and the start SOC is normally distributed. After determining charging load models and parameters of different models, we need to model fast charge and general charge respectively. The specific flowchart is as follows.
Fig1: The Flowchart of EV Charging Loads Calculation Based on Monte Carlo Simulation
Information input by the system includes total number of EVs, probability distribution of different charging behaviors, possible charging periods, limits to charging hours, probability distribution of start charging time and
probability distribution of start SOC corresponding to different types of charging behaviors [8].
4
Predictions for EV Charging Load Curves
4.1 Predictions for EV Holding Volumes
China’s Automobile Industry Development Report
(2008) [9] predicted holding volumes of various public service and private cars in the future. The total number of taxies in China at the end of 2009 was about 1.1 million. The total number of taxies and official cars in China in 2020 and 2030 were calculated in proportion. Again, the total number of buses in China in 2020 and 2030 were predicted according to the current ratio of buses and taxies in Beijing. Assuming that private EVs account for 10% and 30% and other types account for 5%, 15% and 30% of the total number of PCs in 2020 and 2030, the total holding volumes of various EVs in China can be predicted. The results are shown in the following table.
Table 2: Future Predictions for EV Holding Volumes in China
4.2 Parameter Settings
Basic parameters are derived by a comprehensive analysis of charging characteristics of various electric public service and private cars, including charging periods, limits to charging hours, charging frequency, distribution of start charging capacity and start time, as shown below:
Types Charging Times Per Day
Charging Periods
Limits to Charging Hours
Buses 2 9:30-16:00
23:00-05:00 No No Taxies 2 0:00-5:00
11:30-14:00 No 80min Official
Cars
1 18:00-7:00 No
Private Cars Workdays
1 8:00-17:00 19:00-7:00 19:00-22:00
No No 80min Private Cars
Holidays
0.8 20:00-5:00 0:00-7:00 12:00-22:00
No No 80min
Types Charging Probability in Each Period
Distribution of Start Charging Capacity
Distribution of Start Time Years Buses/10
Thousand
Taxies/10 Thousand
Official Cars /10 Thousand
Private Cars
Buses 1 1
N(0.5,0.01) Uniform Uniform Taxies 1
1
N(0.3,0.01) Right trapezoid Uniform Official
Cars
1 N(0.4,0.01) N(9,0.25)
Private Cars Workdays
0.2 0.7 0.1
N(0.6,0.01) N(19,0.25) Right trapezoid Uniform Private
Cars Holidays
0.5 0.1 0.2
N(0.6,0.01) Uniform Right trapezoid Uniform
Table 3:An Analysis of Charging Characteristics of Various EVs
This table lists several parameters in charging load models of various public service and private cars. Among them, buses need to be charged twice a day. The start charging time is uniformly distributed. The start SOC is normally distributed. Taxies often choose fast charge in the day. The start charging time follows a right trapezoid distribution. The start SOC is normally distributed. Taxies choose general charge at night, when off duty. The start charging time is uniformly distributed. The start SOC is normally distributed. OCs are charged regularly and often choose general charge at night, only once a day. The start charging time is uniformly distributed. The start SOC is normally distributed. The travelling of private cars in workdays and holidays are different, thus parameters may vary greatly. In workdays, private cars need to be charged once a day. The start charging time in the day follows a fixed probability distribution. While in fast charge, the probability of start charging time follows a right trapezoid distribution. In holidays, the charging probability per day is 0.8. The start SOC is normally distributed.
For different types of EVs, charging powers are different under fast and general charge modes. The specific values are subject to national standards. Assuming that the charging power of buses is 3 times that of OCs and PCs, the charging power of taxies is twice that of OCs and PCs, then the specific parameters as shown below.
Buses Taxies Official Cars
Private Cars Power of
General Charge
21kw 14kw 7kw 7kw
Power of Fast Charge
135kw 90kw 45kw 45kw
Table 4:EV Charging Power
4.3 Data Processing and Error Test
In order to enhance the accuracy of data, when using Monte Carlo method to simulate EV charging loads, we used Grubbs’ test and DPS to exclude abnormal data at each time point. A set of data predicted based on Monte Carlo Simulation are arranged by size, i.e.,
1 2 3 n
x ≤x ≤x ≤x .
Measured data which are likely to be abnormal are bound
to occur in maximums or minimums. If the minimum
x
1is suspicious, then test statistic
G
=
(
x
−
x
1) /
s
, wherex
is mean value and
s
is standard deviation, namely2
1 1
1
1
,
(
)
1
n n
i i
i i
x
x s
x
x
n
=n
==
=
−
−
∑
∑
(5)
For test statistic
G
, Grubbs derived its statistical distribution and gave a critical valueG
(1−n)( )
n
when thesignificant level
a
was 1% or 5%.G
(1−n)( )
n
is known asGrubb’s exponent. It can be consulted from a spot check table. When test statistics
G
corresponding to the minimumx
1 or the maximumx
nare greater than criticalvalues, it is considered that corresponding
x
1 orx
nare suspected abnormal values and should be eliminated. The accuracy of Monte Carlo Simulation in processed data can be judged by the variance coefficientβ
[10], namelyi
i
i i
v ( )
( )
=
k
iL
L
L
L
σ
β =
(6)
Where
β
i is the variance coefficient of charging load inthe ith minute. i=1,2,…,1440.
v ( )
iL
is the varianceof charging load in the ith minute.
σ
i( )
L
is the standard deviation of charging load in the ith minute. k is calculation times. The maximum variance coefficient at each time pointβ
=max(β
i) is used as a basis of judgement.4.4 Predictions for Total EV Charging Load Curves
Run the program in Visual C++ 6.0 environment. When EVs are connected to power grids for charging, the numbers of various public service and private cars are entered respectively.
ISSN 2348 – 7968
of a single car. After that, the charging load curve of each EV is added up, to get the total charge load curve per day. Setting the times of Monte Carlo Simulation to be 50000, the resulting variance coefficient is less than 0.05%. The final load curves in workdays and holidays in 2020 and 2030 are shown below.
Fig2:EV Charging Loads in Workdays in 2020 and 2030
Fig3:EV Charging Loads in Holidays in 2020 and 2030
5
Result Analyses
By analyzing EV charging load curves in workdays and holidays in 2020 and 2030, we can draw the following conclusions:
(1) From 2020 to 2030, with the rapid growth of EVs, EV charging loads tend to rise rapidly year by year.
(2) The peak of EV charging loads is mainly from going home from work to 12 p.m. The main reason for this peak is that most private car owners choose to charge their cars directly after going home from work and cause a sharp rise in loads. While in holidays, the homing time of private car
owners is more disperse than workdays. The charging load peaks in holidays somewhat decrease.
(3) Charging loads have obvious differences between peaks and valleys, which are roughly consistent with peaks in power grids in time. If we adopt time-of-use power prices and other strategies to control EV charging loads, it will reduce a lot of pressure on power grids and cut down the operation costs of power grids.
Acknowledgment
I want to thank my college teacher Qian Zhang, her support and encouragement made me overcome many difficulties of scientific research, thanks to my friend Peichuan Pang and Cheng Zeng, we work hard together, thanks Chongqing University research training program (SRTP), and finally thanks the thesis reviewer.
References
[1] Tian, L.T., Shi, S.L. and Jia, Z. A Statisitical Model for Charging Power Demand of Electric Vehicles [J], Power
System Technology, 2010, 34(11):126-130.
[2] Luo, Z.W., Hu, Z.C., Song, Y.H., Yang, X., Zhan, K.J. and Wu, J.Y. Calculation Methods for Electric Vehicle Charging Loads [J], Automation of Electric Power
Systems, 2011, 35(14):36-42.
[3] H. Niederreiter. Random number generation and quasi-Monte Carlo methods.SIAM, Philadelphia, 1992.
[4] DengGeorge. A Review of Pseudorandom Number Generators. Comput Phys Commun, 1990.
[5] Liu, X.B. Stochastic FEM and Its Applications in Engineering [J], Journal of Nanjing University of
Aeronautics & Astronautics, Southwest Jiaotong
University Press 1993.
[6] Muradolu M, Popo SB, Caughey DA. The hybrid method for the PDF equations of turbulent reactive flows: consistency conditions and correction algorithms. Comput Phys, 2001,172:841-878
[7] Lei, J.Y., Duan, W.G., Dong, X.Z. and Hu, Z.C., Plug-in Electric Vehicles ChargPlug-ing Load CalculatPlug-ing Based on Monte Carlo Simulation in Shenzhen [J], Electric Vehicles Charging and Discharging Technology Symposium
Proceedings, 2012.
[8] Luo, Z. W., Hu, Z.C. and Song, Y.H. et al. Calculation Methods for Electric Vehicle Charging Loads [J],
Automation of Electric Power Systems, 2011,
35(14):36-42.
[9] Industrial Economy Research Department, Development Research Center of the State Council, SAE-China and Volkswagen Group (China). China’s
Automobile Industry Development Report (2008) [R].
Beijing: Social Sciences Academic Press, 2008
Biao Yang, graduated from Power System, Chongqing University, Email: [email protected].
Cheng Zeng, graduated from Power Electronics, Chongqing University, Email: [email protected]