Some Studies on Heat Recovery Steam Generation
(HRSG) in Combined Power Plant using CFD.
B.Sattibabu1, Prof. N.HariBabu*2 ,B.V.V Prasada Rao3
* Corresponding author
1, 2,3.Department of Mechanical Engineering, Aditya Institute of Technology and Management, Tekkali; Srikakulam Dist., 532201. Andhra Pradesh, India.
Abstract- Gas and steam based electricity plays an important role because of the need for diversified power-generation. Recent developments in gas turbines encourage their use in utility power generation in many parts in the world. The three main components of gas turbine are compressor, combustion chamber and turbine in practice losses occur in both the compressor and turbines which increase the power absorbed by the compressor and decrease the power output of the turbine. The four main components of steam turbine are heat recovery steam generator (HRSG), boiler, turbine and condenser. The operation of gas turbine power plant is influenced by the conditions that are present at the place where it is installed mainly ambient temperature, atmospheric pressure and the air‘s relative humidity and some more. The operation of steam turbine power plant is influenced by the conditions that are present at the place where it is installing; mainly heat recovery steam generator (HRSG).These parameters affect the generated electric power and the heat-rate during operation.
The present study mainly includes performance of combined power cycle which effects the performance of gas turbine and performance of steam turbine in order to improve the combined power cycle efficiency, performance enhancement. The 3D model of combined cycle power generation system is developed by NX-CAD and analyzed using CFD to perform heat flow simulation and determine the heat and steam generation through the water flow tube. Keywords – Combined power plant, HSRG, CFD Analysis. 1. INTRODUCTION
The combined cycle is the combination of two or more thermal cycles, in a single power plant. Normally the cycles can be classed as a “topping” and “bottoming” cycles. The first cycle to which heat is supplied from combustion chamber is called “topping cycle”. The waste heat produces, and then it is utilized in a second process which operates at a lower temperature and is therefore referred as a “bottoming cycle”. careful selection of the working media makes it possible to create an overall process that takes optimum thermodynamic use of the heat in the upper range of temperatures and returns waste heat to the environment at
low temperature level as possible. The topping and bottoming cycles are coupled through a heat recovery steam generator (HRSG).
At present only one combined cycle has found wide acceptance: the combination of gas turbine/steam turbine power plant. In these plants liquid fuels or gases are burnt. There are two main reasons of wide acceptance of gas and steam power plant.
It is made up of components already existing in power plant with a single cycle. Therefore development costs are lowAir is non problematic and inexpensive medium that can be used the optimum prerequisites for a good topping cycle. In bottoming cycle, water is used which is inexpensive and widely available. The waste heat from a modern gas turbine has a temperature level beneficial for a good steam process. In recent years have gas turbines attained inlet temperatures that make it possible to design a very high efficiency cycle. Today’s process and heating applications continue to be powered by steam and hot water. The mainstay technology for generating heating or process energy is the packaged boiler. The packaged boiler, either in firetube or the various water tube forms, has proven to be highly efficient in generating energy for many process and heating applications.
The combined-cycle unit combines the Rankine (steam turbine) and brayton (gas turbine) thermodynamic cycles by using heat recovery boilers to capture the energy in the gas turbine exhaust gases for steam production to supply a steam turbine as shown in the fig. “combined- cycle cogeneration unit”. Process steam can be also provided for industrial purpose.
Fossil fuel-fired (central) power plants use either steam or combustion turbines to provide the mechanical power to electrical generators. Pressurized high temperature steam or gas expands through various stages of a turbine, transferring energy to the rotating turbine blades. The turbine is mechanically coupled to a generator, which produces electricity.
Fig.1.1. Plant overview
Fig.1.2. Schematic arrangement
1.1.COMBUSTION GAS TURBINES:
Combustion (Gas) turbine plants operate on the Brayton cycle. They use a compressor to compresses the inlet stream upstream of a combustion chamber. Then the fuel is introduced and ignited to produce a high temperature, high pressure gas that enters and expands through the turbine section. The turbine section powers both the generator and compressor. Combustion turbines are also able to burn a wide range of liquid and gaseous fuels from crude oil to natural gas.
The combustion turbines energy conversion typically ranges between 25% to 35% efficiency as a simple cycle. The simple cycle efficiency can be increased by installing a recuperator or waste heat boiler onto the turbines exhaust. A recuperator captures waste heat in the turbine exhaust steam to preheat the compressor discharge air before it enters the combustion chamber. A waste heat boiler generates steam by capturing heat from the turbine exhaust. These boilers
are known as heat recovery steam generators (HRSG). They can provide steam for heating or industrial processes, which is called COGENERATION. High pressure steam from these boilers can also generate power with steam turbines, which is called a combined cycle (steam and combustion turbine operation). Recuperates and HRSGs can increase the combustion turbines overall energy cycle up to 80%. Combustion (natural gas) turbine development increased in the 1930’s as a means of jet aircraft propulsion. The efficiency and reliability of gas turbines had progressed sufficiently to be widely adopted for stationary power applications. Gas turbines range in size from 30 KW(micro turbines) to 250 MW (industrial frames). Industrial gas turbines have efficiencies approaching 40% to 60% for simple and combined cycles respectively.
The gas turbines share of the world power generation market has climbed from 20% to 40% of capacity additions over the past 20 years with this technology seeing increased use for base load power generation. Much of this growth can be accredited to large (>500 MW) combined cycle power plants that exhibit low gas turbine power plant can vary between $35000-$550 / KW with the lower end applying to large industrial frame turbines in combined cycle configurations. Availability of natural gas-fired plants can exceed 95%. In canada, there are 28 natural gas-fired combined cycle and COGENERATION plants with an average efficiency of 48%. The average power output for each plants was 236 MW with an installed cost of around $ 500/ KW.
Steam turbine power plants operate on a Rankine cycle. The steam is created by a boiler, where pure water passes through a series of tubes to capture heat from the firebox and then boils under high pressure to become superheated steam. The heat in the firebox is normally provided by burning fossil fuel (e.g. coal, fuel oil, natural gas). However, the heat can also be provided by biomass, solar energy or nuclear fuel, the superheated steam leaving the boiler then enters the steam turbine throttle, the steam expands through the turbine, it exists the back end of the turbine, where it is then returned to the boiler through high pressure feed pumps for reuse. Heat from the condensing steam is normally rejected from the condenser to a body of water, such as a river or cooling tower.
1.2.PURPOSE OF STUDY:
The study of improvement of combined power cycle efficiency by introducing heat recovery steam generator(HRSG). Gas turbo power station (GTPS) at vijeswaram is the first combined cycle gas power generating plant of 272MW capacity in south India located in West Godavari Dist. By studying the performance of combined power cycle can be calculated and ways to improve the efficiency and to reduce cost of generation can be further be suggested.
2.THERITICAL CALCULATIONS 2.1. GAS TURBINE
Inlet temperature of air T1=25°C=298K
Actual compressor outlet temperature T2’= 329.830C=602.83K
Firing temperature T3=11000C=1373K
Actual turbine outlet temperature T4’=525.080C=798.08K Turbine outlet pressure p1=p4=1.01325 bar
Turbine inlet pressure P2=P3=8.52bar Mass of air flow Ma=337 kg
Mass of gas flow Mg =7.77 kg/sec Fuel air ratio Mg/Ma= 1:44
Specific heat of gases Cpg= 1.022 kj/kg-k Specific heat of air Cpa = 1.005 kj/kg-k Calorific value of gas Cv =8500 kj/m³ Volume of gas Vg = 11.10 m³
T₂= 547.58 K
T₄ =747.1866 K
ȠTurbine = =
=85%
ȠCompressor =
=81%
ȠThermal =
=
=31%
2.2. STEAM TURBINE
Inlet temperature of the turbine T1 =5300 C Exhaust temperature of the steam T2 = 480 C
Pressure of the steam at the inlet of turbine P1 = 48bar Pressure of steam at the outlet of the turbine P2 = 4.0bar
Mass flow rate of HP steam M1 = 170 T/ Hr Mass flow rate of LP steam M2 = 20 T/ Hr Total mass to inlet of turbine M = M1 + M2 =
=52.77 Kg / sec
Enthalpy of steam at the inlet of Turbine H1 = 3535Kj/kg
AT 5300C and 48 bar (taking steam tables) H1= 3535Kj/ kg
S1= 6.998 Kj/ kg k AT 4.0 bar Sf= 1.776Kj/ kg Sfg= 5.118Kj/ kg k Hfg= 2132.9kj/ kg K Hf=604.7 Kj/ kg
For reversible adiabatic process entropy drop ds=0
S1=S2
S2=6.998 Kj/kg S2= Sf+ X(Sfg) 6.998=1.776+ X(5.118) X= 0.95
H2= Hf+ X(Hfg) = 604.7+0.95(2132.9) H2 =2825.04Kj/kg Here
Hf= H3
H3= 604.7Kj/ kg
Work done of pump delivering water to the boiler Wp=Vf*dp
=0.001084(48-0.1)*100 Wp=4.76 KW
Pump work is given by Wp= H4-H3
4.76= H4-604.7 H4=609.46Kj/ kg
The work done by the turbine is given by Wt=(H1-H2)
=3522-2825.04 Wt=696.1Kw
Work done by the heat exchanger is given by Whe=H1-H4
=3522-609.46 Qin =2912.54kj/kg
Ƞsteam turbine =Wturbine- Wpump / Qin =696.1-4.76/2912.54
Ƞsteam turbine = 23%
2.3. HEAT RECOVERY STEAM GENERATOR (HRSG) A heat recovery steam generator or HRSG is an energy recovery heat exchanger that recovers heat from a hot gas stream. It produces steam that can be used in a process (cogeneration) or used to drive a steam turbine (combined cycle)
Fig.1.3. Plant overview
2.4. PERFORMANCE OF HRSG:
HRSG Performance = heat content of output steam + heat gain in CPH
H.P. Steam parameters: p =48 bar T = 536.30C
Flow rate = 172.4 T/Hr Enthalpy = 842 kcal/ kg L.P. Steam parameters: p= 6.5 bar
T=229.70C . Flow rate = 19.6 T/Hr
Enthalpy = 685 kcal/ kg
1.heat content of the output steam= steam flow* enthalpy of steam in kcal/kg* 1000(kcal)
a. For H.P.DRUM = 172.4*1000*842 = 145.16*10⁶ kcal/kg b. For L.P.DRUM = 19.6*1000* 685 = 13.42*10⁶ kcal/kg c. Feed water energy = (172.4+19.6) * 120 = 23040 kcal/ kg
TOTAL OUTPUT ENERGY = H.P.DRUM+L.P.DRUM – FEED WATER ENERGY
=158.56*10⁶ kcal/ kg 2. Input energy of Flue Gas = m*s*dt
= 1542965*1.3*0.25*(536-229)
= 196.42*10⁶ kcal/ kg
•EFFICIENCY =
= 80.72%
COMBINED CYCLE EFFICIENCY
:
ȠCC = 0.31+ 0.24 ̶ (0.31*0.24) *100
= 47%
3. MODELING
In this study NX_CAD software shall be used for 3Dmodeling of steam generated system, ANSYS CFD package software’s shall be used for the flow simulation. Optimize the inlet manifold by increasing or decreasing length of inlet plenum to get accurate volume efficiency. Perform flow analysis of inlet plenum for different designs using ANSYS Fluent software to determine the outlet temperatures and thermal distribution.
3.1. 3D MODEL OF STEAM GENERATED SYSTEM
The 3D model of the steam generated system is created using NX-CAD software from the 2D drawings. NX-CAD is the world’s leading 3D product development solution. This software enables designers and engineers to bring
better products to the market faster. It takes care of the entire product definition to serviceability.
3.2. 2D drafting of current steam generated system model:
Fig.3.1. 2D drafting of steam generated system
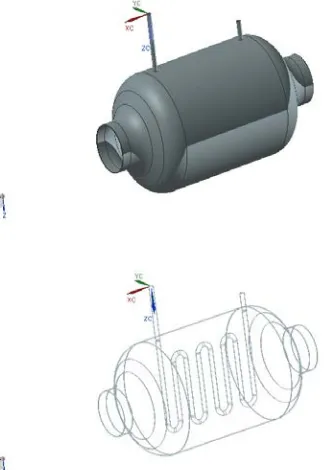
3.3. Isometric view of steam generated system:
Fig. 3.2. 3D model of steam generated system
3.4. THE MODELING PROCESS:
The modeling process consists of first taking the real world fluid geometry and replicating this in the virtual environment. From here, a mesh can be created to divide the fluid up into discrete sections. Boundary conditions must then be entered into the model to designate parameters Conventional geometries, with their characteristics and applications of fluids to be modeled or the details of any solid edges or flow inlets/outlets. The simulation is then ready to be run and when a converged solution is found, it
must be carefully analyzed to establish whether the mesh is appropriately modeling the flow conditions.
3D model of steam generated system is developed by using NX-CAD software to perform the flow simulation of steam generated system. In this case we are considering the steam turbine and water flow tubes through the turbine.
In this case the steam turbine and water flow tube parameters are taken from the industry data and in this referred model we are considering steam turbine and one water flow tube for simple simulation of heat transfer from the fired temperature of gas turbine to the water flow tubes which is connected to steam generator, width of the turbine is 10mm and width of the tube is 2mm.
Fig.3.3. Geometry of steam turbine and water flow tubes
3.5. CONSTRUCTING THE DOMAIN AND MESHING
CFD allows virtual experimentation with and consequently optimization of the design parameters such as furnace tube diameter and wide range of operating conditions. It is very attractive to industry as it saves both time and effort during the design process when compared alongside traditional experimental methods. However, the degree of confidence may depend on many factors and as a result for the flow analysis of the steam generated system are generated in NX-cad and mesh is created in the ICEM CFD software.
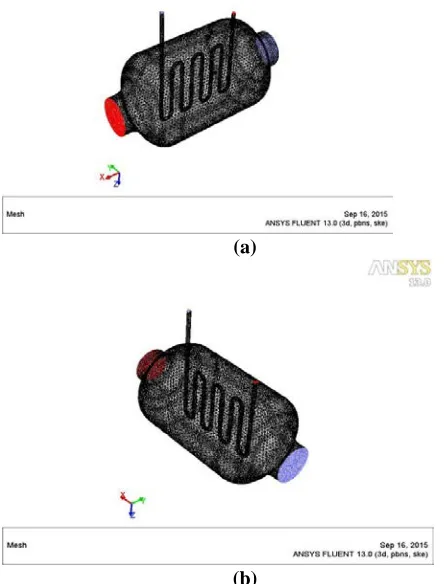
The domain was meshed using tetrahedral meshing technique. The given figure shows the geometry and meshed body of the steam generated system.
Fig. 3.4.Ssteam generated system with volume Mesh and section view in ICEM CFD
3.6. THE BOUNDARY CONDITIONS
The CFX software comes with different boundary types which synchronize with the physical conditions. The CFX boundary model has been incorporated which uses the 'VELOCITY INLET’ boundary types for hot air inlet. Temperature and flow velocity parameters are given to inlet boundary conditions. For the outlet, 'OUTLET VENT’ boundary condition is used with atmospheric pressure. For the outer, WALL boundary condition is used as forced convection of air is applied as wall condition. For the interface, WALL boundary condition is used as coupled.
(a)
(b)
Fig.3.5.(a &b) inlet and outlet boundary conditions of the steam generated system
(a)
(b)
Fig.3.6.(a&b). Solid and fluid body of the steam generated system
3.7. FLUENT
Version: 3D, pbns, ske (3d, pressure-based, laminar) Release: 13.0.0
3.7.1. MODELS:
model settings
Space 3D
Time Steady
Viscous
Standard
k-epsilon
turbulence
model
Heat Transfer Enabled
3.7.2. MATERIAL PROPERTIES:
Material:water-liquid (fluid):
PROPERTY UNITS VALUES
Density kg/m3 998.2
Cp (Specific
Heat) j/kg-k 4182
Thermal
Conductivity w/m-k 0.6
Viscosity kg/m-s 0.001003
Molecular
Weight kg/kgmol 18.0152
Thermal
Expansion
Coefficient
1/k 0
Speed of
Sound m/s 340
Material:air (fluid):
PROPERTY UNITS VALUES
Density kg/m3 1.225
Cp (Specific Heat) j/kg-k 1006.43
Thermal Conductivity w/m-k 0.024
Viscosity kg/m-s 1.78e-05
Molecular Weight kg/kgmol 28.9
Thermal Expansion
Coefficient 1/k 0
Speed of Sound m/s 340
MATERIAL: steel (solid):
PROPERTY UNITS VALUES
Density kg/m3 8030
Cp (Specific Heat) j/kg-k 502.48
Thermal Conductivity w/m-k 16
CELL ZONE CONDITIONS:
Created_material_12 fluid
Created_material_13 fluid
3.8. BOUNDARY CONDITIONS:
Name Type
watersur_inner-shadow wall
inlet-1 velocity-inlet
outlet-1 outlet-vent
inlet-2 velocity-inlet
outlet-2 outlet-vent
hotairsuf wall
watersur_inner wall
watersuf_outer wall
3.8.1 SETUP CONDITIONS: watersur_inner-shadow:
Condition Value
Wall Thickness (m) 0.0025
Heat Generation Rate (w/m3) 200
Material Name steel
Thermal BC Type 3
Temperature (k) 310
Heat Flux (w/m2) 0
Convective Heat Transfer
Coefficient (w/m2-k) 0
Free Stream Temperature (k) 300
Enable shell conduction? no
Wall Motion 0
Shear Boundary Condition 0
Define wall motion relative to
adjacent cell zone? yes
Apply a rotational velocity to this
wall? no
Velocity Magnitude (m/s) 0
X-Component of Wall Translation 1
Y-Component of Wall Translation 0
Z-Component of Wall Translation 0
Define wall velocity components? no X-Component of Wall Translation
(m/s) 0
Y-Component of Wall Translation
(m/s) 0
Z-Component of Wall Translation
(m/s) 0
External Emissivity 1
External Radiation Temperature
(k) 300
Wall Roughness Height (m) 0
Wall Roughness Constant 0.5
Rotation Speed (rad/s) 0
3.8.2. Inlet-1:
Velocity Specification Method 2
Reference Frame 0
Velocity Magnitude (m/s) 1
Supersonic/Initial Gauge Pressure (pascal) 0
Coordinate System 0
X-Velocity (m/s) 0
Y-Velocity (m/s) 0
Z-Velocity (m/s) 0
X-Component of Flow Direction 1
Y-Component of Flow Direction 0
Z-Component of Flow Direction 0
X-Component of Axis Direction 1
Y-Component of Axis Direction 0
Z-Component of Axis Direction 0
X-Coordinate of Axis Origin (m) 0
Y-Coordinate of Axis Origin (m) 0
Z-Coordinate of Axis Origin (m) 0
Angular velocity (rad/s) 0
Temperature (k) 1373
Turbulent Specification Method 0
Turbulent Kinetic Energy (m2/s2) 1
Turbulent Dissipation Rate (m2/s3) 1
Turbulent Intensity (%) 10
Turbulent Length Scale (m) 1
Hydraulic Diameter (m) 1
Turbulent Viscosity Ratio 10
is zone used in mixing-plane model? no
3.8.3. Outlet-1:
Gauge Pressure (pascal) 0 Backflow Total Temperature
(k) 300
Backflow Direction
Specification Method 1
Coordinate System 0
X-Component of Flow
Direction 1
Y-Component of Flow
Direction 0
Z-Component of Flow
Direction 0
X-Component of Axis Direction 1
Y-Component of Axis Direction 0
Z-Component of Axis Direction 0 X-Coordinate of Axis Origin
(m) 0
Y-Coordinate of Axis Origin
(m) 0
Z-Coordinate of Axis Origin
(m) 0
Turbulent Specification Method 0
Backflow Turbulent Kinetic
Energy (m2/s2) 1
Backflow Turbulent Dissipation
Rate (m2/s3) 1
Backflow Turbulent Intensity
(%) 10
Backflow Turbulent Length
Scale (m) 1
Backflow Hydraulic Diameter
(m) 1
Backflow Turbulent Viscosity
Ratio 10
is zone used in mixing-plane
model? no
Radial Equilibrium Pressure
Distribution no
Specify Average Pressure
Specification no
Specify targeted mass flow rate no
Targeted mass flow (kg/s) 1
Upper Limit of Absolute
Pressure Value (pascal) 5000000
Lower Limit of Absolute
Pressure Value (pascal) 1
3.8.3. Inlet-2:
Velocity Specification Method 2
Reference Frame 0
Velocity Magnitude (m/s) 0.01
Supersonic/Initial Gauge Pressure (pascal) 0
Coordinate System 0
X-Velocity (m/s) 0
Y-Velocity (m/s) 0
Z-Velocity (m/s) 0
X-Component of Flow Direction 1
Y-Component of Flow Direction 0
Z-Component of Flow Direction 0
X-Component of Axis Direction 1
Y-Component of Axis Direction 0
Z-Component of Axis Direction 0
X-Coordinate of Axis Origin (m) 0
Y-Coordinate of Axis Origin (m) 0
Z-Coordinate of Axis Origin (m) 0
Angular velocity (rad/s) 0
Temperature (k) 310
Turbulent Specification Method 0
Turbulent Kinetic Energy (m2/s2) 1
Turbulent Dissipation Rate (m2/s3) 1
Turbulent Intensity (%) 10
Turbulent Length Scale (m) 1
Hydraulic Diameter (m) 1
Turbulent Viscosity Ratio 10
is zone used in mixing-plane model? no
3.8.4. Outlet 2:
Gauge Pressure (pascal) 0
Backflow Total Temperature (k) 300
Backflow Direction Specification
Method 1
Coordinate System 0
X-Component of Flow Direction 1
Y-Component of Flow Direction 0
Z-Component of Flow Direction 0
X-Component of Axis Direction 1
Y-Component of Axis Direction 0
Z-Component of Axis Direction 0
X-Coordinate of Axis Origin (m) 0
Y-Coordinate of Axis Origin (m) 0
Z-Coordinate of Axis Origin (m) 0
Turbulent Specification Method 0
Backflow Turbulent Kinetic Energy
(m2/s2) 1
Backflow Turbulent Dissipation Rate
(m2/s3) 1
Backflow Turbulent Intensity (%) 10
Backflow Turbulent Length Scale (m) 1
Backflow Hydraulic Diameter (m) 1
Backflow Turbulent Viscosity Ratio 10
is zone used in mixing-plane model? no Radial Equilibrium Pressure
Distribution no
Specify Average Pressure Specification no
Specify targeted mass flow rate no
Targeted mass flow (kg/s) 1
Upper Limit of Absolute Pressure Value
(pascal) 5000000
Lower Limit of Absolute Pressure Value
(pascal) 1
3.8.5.Hot airsuf:
WallThickness (m) 0.01
Heat Generation Rate (w/m3) 0
Material Name steel
Thermal BC Type 2
Temperature (k) 300
Heat Flux (w/m2) 0
Convective Heat Transfer Coefficient
(w/m2-k) 1
Free Stream Temperature (k) 300
Enable shell conduction? no
Wall Motion 0
Shear Boundary Condition 0
Define wall motion relative to adjacent cell
zone? yes
Apply a rotational velocity to this wall? no
Velocity Magnitude (m/s) 0
X-Component of Wall Translation 1
Y-Component of Wall Translation 0
Z-Component of Wall Translation 0
Define wall velocity components? no
X-Component of Wall Translation (m/s) 0
Y-Component of Wall Translation (m/s) 0
Z-Component of Wall Translation (m/s) 0
External Emissivity 1
External Radiation Temperature (k) 300
Wall Roughness Height (m) 0
Wall Roughness Constant 0.5
3.8.6. Water surinner:
Wall Thickness (m) 0.0025
Heat Generation Rate (w/m3) 200
Material Name steel
Thermal BC Type 3
Temperature (k) 310
Heat Flux (w/m2) 0
Convective Heat Transfer
Coefficient (w/m2-k) 0
Free Stream Temperature (k) 300
Enable shell conduction? no
Wall Motion 0
Shear Boundary Condition 0
Define wall motion relative to
adjacent cell zone? yes
Apply a rotational velocity to this
wall? no
Velocity Magnitude (m/s) 0
X-Component of Wall Translation 1
Y-Component of Wall Translation 0
Z-Component of Wall
Translation 0
Define wall velocity components? no X-Component of Wall Translation
(m/s) 0
Y-Component of Wall Translation
(m/s) 0
Z-Component of Wall Translation
(m/s) 0
External Emissivity 1
External Radiation Temperature (k) 300
Wall Roughness Height (m) 0
Wall Roughness Constant 0.5
3.8.7. Water sufouter:
Wall Thickness (m) 0.0025
Heat Generation Rate (w/m3) 200
Material Name steel
Thermal BC Type 2
Temperature (k) 300
Heat Flux (w/m2) 0
Convective Heat Transfer Coefficient
(w/m2-k) 1
Free Stream Temperature (k) 310
Enable shell conduction? no
Wall Motion 0
Shear Boundary Condition 0
Define wall motion relative to adjacent cell
zone? yes
Apply a rotational velocity to this wall? no
Velocity Magnitude (m/s) 0
X-Component of Wall Translation 1
Y-Component of Wall Translation 0
Z-Component of Wall Translation 0
Define wall velocity components? no
X-Component of Wall Translation (m/s) 0
Y-Component of Wall Translation (m/s) 0
Z-Component of Wall Translation (m/s) 0
External Emissivity 1
External Radiation Temperature (k) 300
Wall Roughness Height (m) 0
Wall Roughness Constant 0.5
3.9. SOLVER SETTINGS:
3.9.1. Equations which are taken into considerations Equation Solved
Flow yes
Turbulence yes
Energy yes
3.9.2. Pressure-velocity coupling:
Parameter Value
Type SIMPLE
3.9.3. Discretization Scheme:
Pressure Standard
Momentum FirstOrderUpwind
TurbulentKinetic Energy FirstOrderUpwind
TurbulentDissipation Rate FirstOrderUpwind
Energy FirstOrderUpwind
4. The heat flow analysis: 4.1. VECTOR PRESSURE:
Fig.4.1.The Vector Pressure occurred on the steam turbine
Fig.4.2. The Vector Pressure occurred on the water tube
Fig.4.3. The Vector Pressure occurred on the steam generated system
4.2. VECTOR VELOCITY:
Fig.4.4. Vector velocity occurred on the steam turbine
Fig. 4.5.Vector velocity occurred on the water tube
Fig.4.6. The Vector velocity occurred on the steam generated system
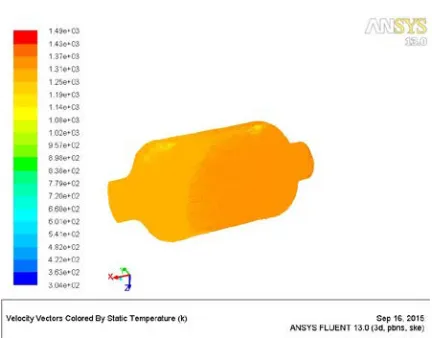
4.3. VECTOR TEMPERATURE:
Fig.4.7. Vector temperature occurred on the steam turbine
Fig.4.8. The Vector temperature occurred on the water tube
Fig.4.9. The Vector temperature occurred on the steam generated system
4.4. The temperature distribution on radiator individual surfaces
S.no Name Temperat ure max.
Temperat
ure min.
Tempe
rature
Avg.
1 Inlet-1 1373 1373 1373
2 Inlet-2 303 303 303
3 Outlet-1 1296 1277 1293
4 Outlet-2 332 300 320
5 Air 1461 939 1321
fluid
6 Water
fluid 451 303 377
From the above flow analysis results, we can observe that the average temperatures are 1373K, 303K, 1293K,320K,1321K and 377K respectively occurred on the inlet-1, inlet-2, outlet-1, outlet-2, Air fluid and Water fluid areas of steam generated cycle system. In this case we observed that the average temperatures are equal to the theoretical calculations.
5. CONCLUSIONS
The following conclusions are from the present work
The performance of heat recovery steam generator
depends on operating conditions.The mass of steam produced and power output from steam turbine depends on gas inlet temperature and gas flow rate and pitch point.
An observations at the optimization technique of single pressure HRSG gives away to further improvement in the efficiency of heat recovery that is to reduce the energy loss, by having multi-pressure heat recovery system.Steam turbine output is a function of the inlet pressure, temperature, steam flow rate and vacuum.Rankine cycle efficiency mainly depends upon the inlet and outlet temperatures of the cycle.Both H.P and L.P steam are admitted into steam turbine at first and eleventh stages respectively.
In the combined cycle power plants, rankine efficiency also depends upon the performances of gas turbine and HRSG.With same amount of fuel input we can generate more power output in the combined cycle plants. By using steam turbine which runs with the gas turbine exhaust gases, we can improve the performance of combined cycle efficiency.When the inlet temperature decreases the power output increases effectively but the overall efficiency improves marginally. Overall efficiency did not increase considerably when firing temperature increased.
In this project, the 3D model of combined cycle power generation system was developed by using NX-CAD software and it is imported into ANSYS CFD software package to perform heat flow simulation and determine the heat and steam generation through the water flow tube. From the analysis results we can conclude that the average temperatures are 1373K, 303K, 1293K, 320K, 1321K and 377K respectively occurred on the inlet-1, inlet-2, outlet-1, outlet-2, Air fluid and Water fluid areas of steam generated cycle system. In this case we observed that the average temperatures are equal to the theoretical calculations.
6. REFERENCES
[1]. S. Mazumder, P. K. Nag, thermodynamic optimization of a waste heat boiler, in: proceeding of the 11XX national heat and mass transfer conference, madras, india,1991. [2]. P. K. Nag and d. raha, thermodynamic analysis of a coal based combined cycle power plant, heat recovery systems, 1995, vol-15.
[3]. Alessandro Franco, Alessandro Russo “Combined cycle plant efficiency increase based on the optimization of the heat recovery steam generator operating parameters”
International Journal of Thermal Sciences, Volume 41, Issue 9, July 2002, Pages 843–859.
[4]. P.K Nag, S De “ Design and operation of a heat recovery steam generator with minimum irreversibility”
Applied Thermal Engineering, Volume 17, Issue 4, April 1997, Pages 385–391
[5]. B.V. Reddy, , G. Ramkiran, K. Ashok Kumar, P.K. Nag
“Second law analysis of a waste heat recovery steam generator” International Journal of Heat and Mass Transfer,
Volume 45, Issue 9, April 2002, Pages 1807–1814.
[6]. Marie-Noëlle Dumont, , Georges Heyen “Mathematical modelling and design of an advanced once-through heat recovery steam generator” Computers & Chemical Engineering, Volume 28, Issue 5, 15 May 2004, Pages 651– 660
[7]. C. Casarosa, F. Donatini, A. Franco “Thermo economic optimization of heat recovery steam generators operating parameters for combined plants” Energy, Volume 29, Issue 3, March 2004, Pages 389–414
[8]. Manuel Valdés, José L. Rapún “Optimization of heat recovery steam generators for combined cycle gas turbine power plants” Applied Thermal Engineering, Volume 21, Issue 11, August 2001, Pages 1149–1159
[9].T.S. Kim, D.K. Lee, S.T. Ro “Analysis of thermal stress evolution in the steam drum during start-up of a heat recovery steam generator” Applied Thermal Engineering,
Volume 20, Issue 11, 1 August 2000, Pages 977–992.