Type of the Paper (Article) 1
Effort Estimation Model for Developing Web
2
Applications Based Fuzzy and Practical Models
3
Dinesh Kumar Sain1*, Jabar H Yusif 2 4
1 FCIT, Sohar University Oman 1; [email protected]
5
2 FCIT, Sohar University Oman 2; [email protected]
6 7
Abstract: Objective: This paper aims to build an Effort Estimation Model for design, coding and
8
testing Web Applications Based Fuzzy and Practical Models, which will help in optimizing the efforts
9
in software development. Methods/ Analysis: Soft computing approach is adopted and applied in
10
the effort estimation and then compared with practical efforts in the development process with
11
interpreting the historical data available for the existing functionalities. Findings: The effort
12
estimation model presented in this paper focuses on the first level estimates published by Project
13
Managers and the second level estimates presented by Project Leaders or Developers for any new
14
requirement or enhancement for a web application built on 3-tier architecture using Microsoft
15
technologies. The model considers the classification of each task as either Low or Medium or High
16
complexity. These tasks pertain to the lowest level parts in bottom-up estimation. Efforts are
17
estimated for designing, coding and unit testing of these tasks and the efforts are summed up to get
18
the effort estimation for the higher level which is a feature to be implemented. Novelty/Improvement:
19
The paper also discusses about the application of the effort estimation model by taking a new
20
requirement as a case study. The first level estimates calculated using the effort estimation model has
21
a variance of about 25% when compared with the actual effort. This variance is very much acceptable
22
considering the fact that the first level estimates can be tolerable up to 35%. The proposed effort
23
estimation tool would help the project managers to efficiently control the project, manage the
24
resources effectively, and improve the software development process and also trade off analyses
25
among schedule, performance, quality and functionality. Fuzzy logic is used to verify the claims
26
made in efforts estimation. It is proposed a new relation between the number of data and efforts value
27
membership for actual data. And converts it into crisp value in the range [0…1] which helps to
28
classify the complexity of the task and subtask in the design, coding and testing phases.
29
Keywords: Effort, Estimation, Design, Coding, Unit Testing, Fuzzy model.
30 31
1. Introduction
32
The effort estimation is considered as one of the important activities in software development
33
project management. Several researchers have been discussed and modeled the association between
34
the main factors of software development like size and efforts 1,2,3,4. Nerveless, all these efforts, but
35
still many problems need to solve and still. These problems usually happened in the early phases of
36
a project such as inconsistent, uncertain and unclear data 5,6,7. The enhancement of the effort
37
estimation phase is considered as a vital tool for software development planning and forecasting of
38
the time and cost in developing a software project system. The creation of low price software
39
development effectively is considered as an important feature to produce a competitive software 8,9.
40
The relation between the need for reliable and accurate software in one direction, and the cost of
41
predictions software is a challenging mater. Typically, software effort estimation models can be
42
classified into algorithmic and non-algorithmic models. The main method of computation in
43
algorithmic models are based on the statistical analysis of historical data and Software Life Cycle
44
Management (SLIM). Besides, the COCOMO and Albrecht’s Function Point models 10,11. They
45
focused on create a precise estimation method for determining the values of main factors like the size
46
of software lines of code (LOC), the complexity of each code, the number of interfaces and user
47
screens. The estimation of any software project, be it effort or cost, has always been a challenging task
48
despite the incredible amount of research that has gone into this activity. Some of the main reasons
49
why estimation have gone haywire are1 including the lack of understanding of the software project
50
scope, the time pressure to complete the project, tight budgets and the lack of quantitative results.
51
This dissertation attempts to build an effort estimation model based on historical data available. The
52
essence of building a good estimation model lies in the interpretation of historical data to estimate
53
the effort for any future activity.
54
The main focus of this paper is to build an effort estimation model for design, develop and the
55
unit test of a web application either new or enhancement. This model will estimate based on the effort
56
data available for past releases. The web application considered is a 3-tier application with SQL server
57
constituting the back-end (database), COM components are developed using Visual Basic framework
58
for forming business layer. Lastly web pages are developed using Active Server Pages providing the
59
front end (Graphical User Interface). So, the web application discussed is developed using Microsoft
60
Technologies. The set of activities for any new release or enhancement would comprise of a
61
combination of tasks that span across many activities in past releases 12,13,14.
62
The aim of this work is set out to answer the following questions.
63
1. How much time is required for design, code and unit test a new functionality to be added to
64
the existing web application?
65
2. How will the effort be distributed over time?
66
To answer these questions, this work sets up an estimation model by interpreting the historical
67
data available for the existing functionalities. The data available is based on the actual effort spent in
68
designing, coding and unit testing of each functionality. However, the challenge is that how each task
69
functionality is implemented. Besides, the task functionality it is must be unique by itself and hence
70
it is not possible to interpolate or extrapolate such data to forecast effort. The solution is to break each
71
of the functionality to a set of tasks, prepare an exhaustive list of all such tasks, calculate the effort
72
required to complete each such task, identify the set of such tasks that need to be performed for any
73
new functionality and then estimate the total effort required to implement the functionality.
74
The model identifies the effort required to complete design, coding and unit testing for one unit
75
of the task, e.g. adding a user control on a web page, and derives a multiplication factor to estimate
76
the effort required for the completion of multiple units of the same task. The design activity
77
considered involves conceptual design, impact analysis for any new requirement, and detailed
78
design with the pseudo code, mapping diagrams and report layouts wherever required.
79 80
2. The Web Application
81
The web application considered in this work is based on Microsoft technologies. It is built on a
82
3-tiered architecture as described below.
83
1. Front End – Provides Graphical User Interface for the application – Built using Active Server
84
Pages (ASP) version 2.0 that are deployed in Microsoft Internet Information Server (IIS) version 4.0.
85
2. Middle Tier – Constitutes COM components developed using Visual Basic (VB) version 6.0.
86
These components implement the business rules for the application and are deployed in the Microsoft
87
Transaction Server (MTS) version 2.0.
88
3. Back End – Constitutes the Microsoft SQL Server version 7.0 database that is a repository for
89
data storage.
90 91
2.1 SQL Server
92
The MTS IIS is the browser where ASP pages are rendered. The 3-tier architecture where the
93
ASP pages are rendered on the client’s (user) browser as Hyper Text Markup Language (HTML)
pages are considered in the paper. The users interact with the application through the graphical
95
interface produced by the HTML pages. The user requests are posted to the IIS that forwards the
96
request to the database server through the business layer in MTS. The database and the business layer
97
serve the client’s requests and results are displayed on the browser 15,16,17.
98
The web application provides various menus to perform the above operations based on the
99
privileges of the user who logs in to the application. The administrators of the web application set
100
these privileges. For the service provider, the application provides the number of allocations made
101
by users to enable billing of the clients. Also, the web application provides facility to post messages
102
to user groups. The web application is enhanced with a set of new features at least twice in a year.
103
The maintenance of the web application it is to be done once per two months based on the problems
104
reported by the customers.
105
Need for an Effort Estimation Model
106
The SDLC phases followed in the implementation of new features are
107
1. Requirement Analysis
108
2. Technical Design
109
3. Coding
110
4. Unit Testing
111
5. Integrated Testing
112
6. System Testing
113
7. Operators Acceptance Testing
114
8. User Acceptance Testing
115
9. Deployment
116
As there are many phases involved, Project Management becomes very complex activity if the
117
estimates are not accurate 18,19,20. This is because, in the absence of accurate estimates, monitoring
118
the progress of the project becomes difficult, as the actual status could be misleading. Predicting the
119
effort required for testing is simpler compared to that for design and development. This is because
120
the effort for testing is determined based on the number of test cases and test scenarios and the
121
complexity of each of them. In the web application, the testing is basically a black box type wherein
122
input is supplied and the testing is done for validating the actual result with the expected value. In
123
the case of development, effort estimation for the design activity is very challenging. Since, the coding
124
is done using three different tools, then it becomes very complicated to classify portion of coding and
125
corresponding tool. This is because of many factors like depending on the skills of the developer,
126
apart from the business rules, other logic pertaining to data processing can be handled in any of the
127
layers. So, it becomes more important to have an effort estimation model for design and development
128
in order to have better control on the project.
129 130 131
3. The Existing Effort Estimation Model
132
The existing effort estimation model for design and development establishes a pattern that
133
resembles the set of features to be implemented in the new enhancement then the model compares
134
the patterns implemented in earlier releases and finds out a close match. The effort required to
135
implement the matched pattern(s) in the earlier releases is used to predict the future effort. The
136
patterns are matched based on certain metrics like (the number of controls added, Number of files
137
accessed and Nature of database access).
138
The web application is classified under various modules like:
139
1. Graphical User Interface Design like adding, modifying and deleting controls
140
2. Graphical User Interface Functionality
141
3. Database schema
142
4. Generation of Reports
143
5. Data Import
144
6. Less/more data centric changes
So, for every new enhancement, based on the requirement analysis, details are worked out in
146
terms of the already existing patterns and the estimation are derived. A data repository is already
147
available, which has the efforts of design and development for a variety of patterns.
148 149
3.1 Drawbacks of the model
150
The drawbacks of this model are that it is difficult to measure the similarity levels between the
151
current requirements and those implemented in the past. When the requirements for a feature
152
consists of a small set of tasks like modifying a data element based on a configuration parameter, the
153
estimates were pretty accurate. On the other hand, if the requirements are called for a large number
154
of tasks, then the estimation is made with this model were highly inaccurate. Also, the effort required
155
to arrive at estimation was very high and hence it was considered unproductive. The model provides
156
the estimation in terms of person days, which does not normally reflect the correct effort in terms of
157
person hours.
158 159
4. Proposed Effort Estimation Model - Overview
160
The proposed estimation model involves a more scientific approach. This also makes use of the
161
data repository available for a variety of patterns. Also, it explores the data in the repository and
162
breaks down the work required for a specific kind of requirement. The model is based on the
163
complexity of each task. The model assumes that the estimator would provide the input whether the
164
task is of low or medium or high complexity. Each level of complexity also has 3 sub-levels of
165
complexity. So, there are nine levels of complexity for any task. For each level of complexity is
166
assigned the effort in terms of person hours for design, coding and unit testing.
167
The effort involves bottom-up approach where a task is broken to a number of subtasks and
168
depending on whether the subtask could be developed using SQL Server programs or VB programs
169
or ASP program or any combination of these, each subtask is assigned an effort. The efforts of all the
170
subtasks are added to get the total effort required for a task. The proposed effort estimation model
171
focuses on design, coding and unit testing where design deals with methodologies to generate the
172
functionality for the application, coding encompasses the actual content and presentation of the
173
application and unit testing involves designing scenarios and testing a module for its intended
174
functionality. The data for the proposed estimation model is obtained from the existing data for each
175
feature implemented in the application and then defined the patterns in terms of front end activity,
176
middle tier programs and back-end procedures. The total effort for design, coding and unit testing
177
of each pattern is calculated for any number of repeated units by simple arithmetic. The metrics used
178
for collecting data are based on complexity, reusability and size.
179 180
4.1 Data Collection
181
The design corresponding each of the features that were implemented in a major releases for the
182
repository holds the data of programs written in Active Server Pages. The commands implemented
183
in branding example are illustrated in Table 1.
184
5. The Estimation Process
185
The estimation process aims to measure the attributes of historical projects to arrive at a
bottom-186
up effort estimation model. Bottom-up estimation begins with the lowest level parts of products or
187
tasks to provide estimates for each. Then these estimates are combined together to arrive at the higher
188
level estimates 21,22.
189
To briefly explain, the historical projects are studied with respect to the features implemented
190
from the design perspective. Then based on the empirical results available in the repository, the effort
191
spent for implementing each task (e.g. implementing a configurable parameter for tax calculation)
192
for design, coding and unit testing is arrived. It is to be noted that the repository contains only the
193
actual effort data pertaining to design, coding and unit testing for implementing a specific feature.
194
The repository does not contain data at each subtask level.
195 196
Table 1: The description of commands implemented in branding example
S.No. Description
1 Adding a new menu to Branding
2 Adding a sub-menu to Branding
3 Adding a mouse event to a menu
4 Adding a graphic to a menu/submenu
5 Modifying a picture in Branding Header
6 Modifying a link in Branding Header
7 Modifying a link in Branding Footer
8 Navigating the user to a specific page based on the user action 9 Adding a java script function to validate user entries
10 Modifying a java script function to validate user entries
11 Modifying display of GUI content
12 Adding a form element
13 Adding a client function to submit the form 14 Adding a server side function for pagination
15 Removing a form element
16 Writing a server side function to render HTML content
17 Adding a method to call a SQL statement using connection object
18 Adding a method to call a Stored Procedure by passing parameters using a Command object
19 Modifying a method to call a SQL statement using connection object
20 Modifying a method to call a Stored Procedure by passing parameters using a Command object
21 Navigating a record-set and displaying values in a form element
22 Adding a method to build a SQL statement and execute using Connection object
23 Populating static values in a form element
198
The effort spent on each subtask is summed the time sheet of each developer who implemented
199
the feature. So, for a given feature, the subtasks were interpreted and a complexity was assigned to
200
each subtask. Each subtask pertains to design and implementation using either SQLServer programs
201
or VB programs or ASP program or any combination of these. The details are provided in Appendix
202
1.
203
As an example, let us consider a feature that was implemented to add search criteria to the web
204
application. The requirement was to search all the cardholders belonging to corporate based on their
205
First Name and Last Name. The subtasks to implement this feature are:
206
1. Add form elements corresponding to first name and last name in an ASP page. (Technically,
207
this means adding two text boxes – one for the First Name and the other for Last Name)
208
2.Add a Java Script function to validate the user entries in to these form elements (Technically,
209
this means a new function needs to be written in Java Script in the ASP page to validate for entries in
210
mandatory fields and presence of special characters)
211
3. Modify a Java Script function submit the form (In the existing web application, a Java Script
212
function already exists to submit forms to the server. This function needs to be modified to include
213
this new ASP page)
214
4. Add new stored procedure in SQL Server to return the set of cardholders based on the input
215
(i.e. First Name and/or Last Name) – Corresponds to writing a query to retrieve results from two
216
tables
217
5. Modify a VB method to call the above stored procedure by passing the parameters viz. First
218
Name and Last Name, using a Command Object.
219
6. Adding a server side function in ASP to display the cardholders (Server side functions are
220
written in VB script in the web application discussed)
Each of these subtasks is assigned a complexity as shown below.
224
SubTask 1 – Low Complexity.
225
SubTask 2 – Low Complexity.
226
SubTask 3 – Medium Complexity.
227
SubTask 4 – Low Complexity.
228
SubTask 5 – Low Complexity.
229
SubTask 6 – Medium Complexity.
230
These complexities are assigned based on the actual effort. Also, a set of guidelines put forth by
231
the author’s organization is also followed wherever the time sheets did not reflect the subtasks
232
correctly. After identifying the subtasks belonging to each category. Low, medium and high, the
233
effort required for each subtask is computed from the time sheet. From Appendix 1, it can be seen
234
that to add a new search criteria, the effort taken works out to 20.5 person hours as detailed below.
235 236
SubTask 1 – 1 person hour x (2 form elements) = 2 person hours
237
SubTask 2 – 4 person hours
238
SubTask 3 – 3 person hours
239
SubTask 4 – 1.5 person hours
240
SubTask 5 – 4 person hours
241
SubTask 6 – 6 person hours
242
Total Person Hours = 20.5 (for design, coding and unit testing)
243 244
This work addresses the issue of non-availability of the subtask details for every new
245
requirement during a high level design stage by building a list of all possible generic features that
246
could be implemented in the web application and also recommending the level of complexity for
247
every feature in the list. This does not limit the estimators to define the complexity perceived based
248
on specific requirement characteristics. So the estimator can rate a feature as “Medium” complexity
249
even if the recommended complexity is “Low” and vice versa. The list of all possible generic features
250
along with the recommended complexity for SQL, VB and ASP programs as appropriate is given in
251
Appendix 2. The complexity for each of these features has been arrived based on the complexity of
252
subtasks. The basis of assigning the overall complexity for each of these features has been decided
253
after consultation with the team of designers and developers.
254 255
6. The Estimation Model
256
Given the diverse nature of the requirements and the different hardware and software
257
technologies used, the classification of each program unit as Low, Medium and High in terms of
258
complexity is very much appropriate11. The program unit and definition varies for each requirement
259
and hence there arises a need to consider the project characteristics and refine the effort estimates.
260
The proposed effort estimation model is constructed by refining the actual effort for each subtask and
261
considering requirement analysis. Besides, it is considered the requirement of specific characteristics
262
like performance, impact on other modules within the application, impact on external modules,
263
impact on the administration of the web application, formatting changes and browser related issues.
264
The Appendix 1 gives the effort data for design, coding and unit testing for all the features listed
265
in Appendix 2. The effort data for coding has been given for SQL Server programs, VB programs and
266
ASP programs. For each type of program, the effort data has been given for all the three categories
267
Low, Medium and High. The effort data reflect the estimated effort for one unit of implementation.
268
For example, adding one control to the web page can be considered as one unit of implementation. If
269
multiple units need to be added, then a multiplication factor has been given for each feature. The
270
multiplication factor has been arrived considering the reusability of code after the first unit has been
271
implemented. The basis for arriving at the multiplication factor has been the actual effort data. A
272
comparison was made between subtasks where one subtask for a specific feature implement one unit
273
was compared with another subtask that implemented multiple units. For example, in generating
274
reports, defining the number of fields for one unit of implementation varies from one requirement to
another to decide on the complexity. If the estimator defines the generation of reports with 10 fields
276
as complex, and if the report consists of 20 fields, then it should be treated as two units of
277
implementation. But it is not possible to calculate the multiplication factor for each feature in this
278
way. The historical data does not address all possible scenarios. So the multiplication factors were
279
determined after consultation with experienced developers. This is a classic case of expert judgment.
280
The estimation model has been applied to a new release and the comparison between the estimated
281
effort and the actual effort will discuss later in section 9.
282
Usually, a high level estimate is required during the high level design of application. Project
283
Manager, estimates the need to be made with the help of functional requirements that are derived
284
from the business requirements. The tolerance allowed on this kind of estimate is about 30 to 35
285
percent. The proposed effort estimation model is easy to use by Project Managers who are not very
286
much aware of the nitty-gritty of the project in terms of design and development. They need to just
287
identify the feature given, and then assume the complexity recommended and arrive at estimates.
288
This model can also be used by project leaders and developers to define the second level of estimates.
289
The effort estimates could change based on the complexity rating and multiplication factor if there
290
were requirement changes between the first level and second level of estimates. But since the second
291
level of estimate is published after the design phase, the tolerance on the estimates is about 20 to 25
292
percent.
293
To demonstrate the estimation of effort using this model for the example discussed (i.e. adding
294
new search criteria to the web application to display all the cardholders based on the First Name and
295
Last Name), let us look in to Appendix 2. For adding new search criteria based on one field (assuming
296
one unit of implementation), the recommended complexity is “Medium”. So, looking in to the total
297
effort, the estimated value is 17 person hours for one unit of implementation. The multiplication
298
factor defined is 0.5. So for two units of implementation (since the search is based on First Name and
299
Last Name), the total effort is 17 + (0.5 x 17) = 25.5 person hours. This value is higher when compared
300
to the value obtained, which was 20.5 person hours. However, the estimate calculated using effort
301
estimation model is much refined and considers requirement specific characteristics.
302 303
6.1 Benefits of the Model
304
Firstly, the most important benefit for Project Managers using this estimation model would be
305
to control the development process efficiently as the estimates derived would act as benchmarks to
306
track progress and check on the effort variance.
307
Secondly, Project Managers can plan the work for the resources effectively since they have a
308
reliable set of estimates. For the same reason, Project Managers can address the requirement or project
309
specific factors by redefining the development process necessary checkpoints to nullify any risks and
310
also bring down the complexity of the tasks involved. With a first level of estimate within 30%
311
tolerance, Project Managers can negotiate better deals to fixed bid projects or trade off analyses
312
among schedule, quality, performance and functionality.
313 314 315
7. Soft Computing Paradigms
316
Soft Computing (SC) is a new computing technique for utilizing real world problems and
317
provides lower cost solutions. It is mainly consisting of the following techniques: neural networks,
318
fuzzy systems and evolutionary computation. The three techniques of soft computing are vary from
319
one another in their function and time scales of operation which they embed a priori knowledge. The
320
Neural network implements in a numeric framework, which used to identify their learning and
321
generalization conditions. Fuzzy systems are implemented in a linguistic framework, which is used
322
to handle linguistic information and then performs approximate reasoning. Nevertheless, the
323
evolutionary computation techniques are powerful methods for searching and optimizing the results.
324
Many researchers all over the world contributed essentially in soft computing to discover solutions
325
of various problems in modern scientific society applications. The significant directions of soft
326
computing applications are implemented and performed into knowledge representation, learning
methods, path planning, control, coordination, and decision making23. Moreover, the SC can be
328
significantly implemented in the following areas: Biometrics systems, Bioinformatics systems,
329
Biomedical systems, Robotics applications, Vulnerability analysis. Furthermore, SC is performed
330
successfully in many applications such as character recognition, data mining, Natural Language
331
Processing (NLP), Image processing, Machine control, Software engineering, Information
332
management, etc.
333
Despite of all efforts in using the computation in algorithmic models, but it is not reached to the
334
production of efficient and reliable software models. As a result, there was a need to explore new
335
methods for solving the limitations of algorithmic models. The old methods need to be replaced
336
with non-traditional methods of calculation, such as Parkinson's, and experts estimate and Judgment,
337
Price-to-Win and lastly the machine learning methodologies. The uses of techniques such as neural
338
networks and logic fuzzy are more modern techniques for calculating the estimation models which
339
they work on a few and inaccurate data and produced accurate and reliable results. Fuzzy logic is
340
an expert knowledge based approach with powerful linguistic representation for epitomizing
341
imprecision in input and output data sets for model building 24.
342
8. Fuzzy systems
343
Fuzzy systems are suitable for the uncertain or approximate reasoning function that their
344
behaviour can be clarified based on fuzzy rules and it can be attuned by tuning the rules. The fuzzy
345
set methods are appropriate for reasoning linguistic modes of natural to human. It is used the concept
346
of crisp sets. The robustness and flexibility of data is implemented by removing the sharp boundary
347
between members and non-members of a group25. Human experiences and preferences are
348
implemented as Fuzzy logic via membership functions and fuzzy rules. The Fuzzy membership
349
functions have different figures based on the preference and experience. The fuzzy set of a
350
membership function of an input variable is mapping a universe of discourse in the interval [0, 1].
351
Let X is a non-empty set, and then the membership or containment of X in a fuzzy set is “A” which
352
decides an attribute membership function μA(x) ∈ [0, 1]. It is mathematically expressed as:
353
𝑨 = ∑ (𝛍𝐀(𝒙𝒊) 𝒙𝒊 ) 𝒏
𝒊=𝟏
354
The resolution of a fuzzy set “A” is defined using α-level set. The crisp set “Aα” is containing
355
all the elements of the universal set U. The crisp set is calculated as:
356
Aα={xi ∈U | μA (xi)≥α} ,α∈[0,1] . And if Aα={x εU \μA (x)>α} then Aα is called a strong α-cut. The level 357
set of the fuzzy set “A” is a set of all levels α ∈ [0, 1] with distinct α-cuts is illustrated as:
358
Λ𝐴={𝛼|𝜇𝐴 (𝑥)=𝛼 ,𝑥𝜖𝑈} .
359
The support SA ∈ [0, 1], of a fuzzy set A is described as
360
𝑺𝑨= {∑ ( 𝛍𝐀(𝒙𝒊)
𝒙𝒊 )
𝒏
𝒊=𝟏 : 𝒙𝒊 𝝐 𝑿 ∀𝛍𝐀(𝒙𝒊) > 𝟎} , 361
All the constituent elements whose membership values are equal to unity is called the core (CA)
362
of a fuzzy set “A” is defined as: CA= { xi ϵ U |μA(xi) = 0} , while the bandwidth (BWA) o is 363
expressed as BWA= { xi ϵ U |μA(xi) ≥ 0.5}.
364
9. Implementation of the Estimation Model
365
This effort estimation model is used to estimate the effort based new requirements the in vogue.
366
The estimated effort has been compared with the actual effort for three of the features implemented.
367
The description of these three features is described below.
368
1. Branding Changes – corresponds to Graphical User Interface Design changes
369
2. Modification to Reports – corresponds to more data centric utility
370
3. Handling of transaction disputes – corresponds to Graphical User Interface Functionality.
371
As a case study, let us consider the estimation for branding changes.
372
The requirements for the branding changes are the following:
373
1. Add 8 new menu items.
374
2. Add 12 new 1st level sub menu items.
375
3. Add 9 new 2nd level sub menu items.
376
4. Add functionalities for Mouse_Over and Mouse_Out events for each menu and sub menu
377
item.
5. Associate a path with every menu and sub menu item.
379
6. Add graphics to each menu and sub menu item.
380
Based on Appendix 2, the estimation for the design effort is as given in Table2. The branding
381
changes involved development is worked only in ASP pages, the estimation was done by taking the
382
values listed for ASP pages in each sub task. The Table 3 illustrates a case study – effort estimation
383
for coding based on practical calculations.
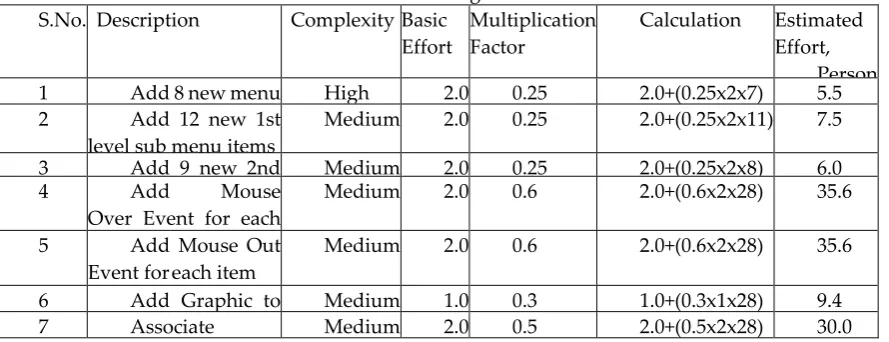
384
The total effort estimated for coding works out to 204.6 person hours. The actual effort was 189
385
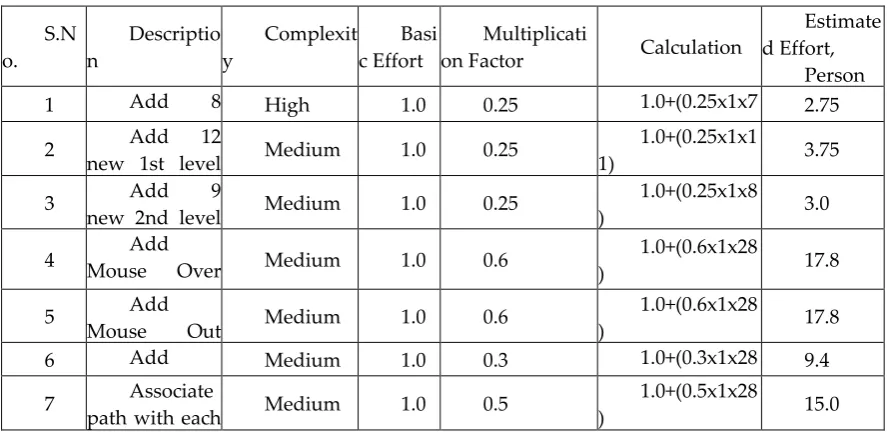
person hours. The variance works out to about 8.2%. The Table 4 depicts the use case of the calculation
386
effort estimation unit in testing phase. The estimated total effort for unit testing works out to 69.5
387
person hours. The actual effort was 88 hours. The variance works out to about 26.6%. Based on the
388
above comparison between estimated effort and actual effort, it can be concluded that the effort
389
estimation model can be used to estimate with a variance of about 25%. This variance is very much
390
acceptable for first level estimation.
391 392
Table 2: Case Studies – Effort Estimation for Design
393
S.No. Description Complexity Basic Effort
Multiplication Factor
Calculation Estimated Effort,
Person Hours
1 Add 8 new menu
items
High 2.0 0.25 2.0+(0.25x2x7) 5.5
2 Add 12 new 1st
level sub menu items
Medium 2.0 0.25 2.0+(0.25x2x11) 7.5
3 Add 9 new 2nd
level sub menu items
Medium 2.0 0.25 2.0+(0.25x2x8) 6.0
4 Add Mouse
Over Event for each item
Medium 2.0 0.6 2.0+(0.6x2x28) 35.6
5 Add Mouse Out
Event for each item
Medium 2.0 0.6 2.0+(0.6x2x28) 35.6
6 Add Graphic to
each item
Medium 1.0 0.3 1.0+(0.3x1x28) 9.4
7 Associate
path with each menu
Medium 2.0 0.5 2.0+(0.5x2x28) 30.0
394 395
Table 3: Case Studies – Effort Estimation for Coding
396
S.N o.
Descriptio n
Complexit y
Basi c Effort
Multiplicati on Factor
Calculation Estimate
d Effort,
Person Hours
1 Add 8
new menu
items
High 8.0 0.25 8.0+(0.25x8x7
)
22.0
2 Add 12
new 1st level
sub menu
items
Medium 4.0 0.25 4.0+(0.25x4x1
1)
15.0
3 Add 9
new 2nd level
sub menu
items
Medium 4.0 0.25 4.0+(0.25x4x8
)
12.0
4 Add
Mouse Over
Event for each item
Medium 3.0 0.6 3.0+(0.6x3x28
)
53.4
5 Add
Mouse Out
Event for each item
Medium 3.0 0.6 3.0+(0.6x3x28
)
53.4
6 Add
Graphic to
each item
Medium 2.0 0.3 2.0+(0.3x2x28
)
18.8
7 Associate
path with each menu
Medium 2.0 0.5 2.0+(0.5x2x28
)
30.0
397 398 399 400 401 402
Table 4: Case study – Effort Estimation for Unit Testing
S.N o.
Descriptio n
Complexit y
Basi c Effort
Multiplicati
on Factor Calculation
Estimate d Effort,
Person Hours
1 Add 8
new menu
items
High 1.0 0.25 1.0+(0.25x1x7
)
2.75
2 Add 12
new 1st level
sub menu
items
Medium 1.0 0.25 1.0+(0.25x1x1
1) 3.75
3 Add 9
new 2nd level
sub menu
items
Medium 1.0 0.25 1.0+(0.25x1x8
) 3.0
4 Mouse Add Over
Event for each item
Medium 1.0 0.6 1.0+(0.6x1x28
) 17.8
5 Add
Mouse Out
Event for each item
Medium 1.0 0.6 1.0+(0.6x1x28
) 17.8
6 Add
Graphic to
each item
Medium 1.0 0.3 1.0+(0.3x1x28
)
9.4
7 Associate
path with each menu
Medium 1.0 0.5 1.0+(0.5x1x28
) 15.0
404
The practical and estimation calculation shows that the complexity of branding changes is only
405
medium and high. But, this is not reflect the real case of the efforts spend in deferent stages. For
406
example, if the user wants to add 8 new menu items, then the estimated effort is 5.5 (the first row in
407
Table 2), and complexity is high. While if the user wants to add 12 new sub menu items in the first ,
408
then the estimated effort is 7.5 (the second row in Table 2), and complexity is medium. This will make
409
unclear understanding of the meaning of complexity values. Now, the estimation of efforts will be
410
calculated based on the Fuzzy model.
411
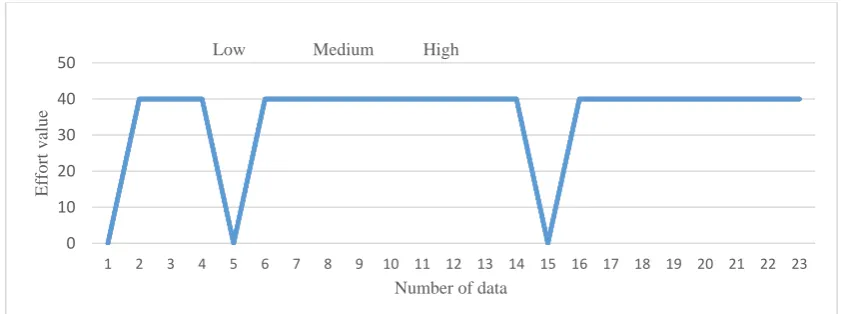
The implementation of the fuzzy model is discussed and the case study of the effort estimation
412
for design in Table 1 is implemented as a fuzzy model as depicted in Figure 1. The relations between
413
the number of data in the application & basic estimation efforts for the number of external input (EI),
414
external output (EO), external enquiry (EQ), external interfaces files (EIF) and internal logical files
415
(LIF) as shows in Table 5.
416
Table 5: Complexity matrix for external input (EI)
417
FTR (File Type
References )
1-5 5-15 >15
0-1 Low Low Medium
2 Low Medium High
3 or more Medium High High
418
Usually, any fuzzy system consists of three main phases commonly referred as, Fuzzification,
419
rule Evaluation, and defuzzification. However, Fuzzifier converts the crisp input to a linguistic
420
variable using the membership functions stored in the fuzzy knowledge base. Then using If-Then
421
type fuzzy rules converts the fuzzy input to the fuzzy output. Therefore, the values with 0 or 1 in the
422
file type references can be translated in the meaning of rules for external input (EI) with 0 or 1 file
423
type references as follows:
424
R1: If the number of data in the range [0…4], then complexity is a low.
425
R2: If the number of data in the range [5…15], then complexity is a low.
426
R3: If the number of data is greater 15, then complexity is a medium.
427
Also, the values with 2 file type references can be translated in the meaning of rules for external
428
input (EI) as follows:
429
R4: If the number of data in the range [0…4], then complexity is a low.
430
R5: If the number of data in the range [5…15], then complexity is a medium.
431
R6: If the number of data is greater 15, then complexity is a high.
Lastly, the values with 3 and more file type references can be translated in the meaning of rules
433
for external input (EI) as follows:
434
R7: If the number of data in the range [0…4], then complexity is a medium.
435
R8: If the number of data in the range [5…15], then complexity is a high.
436
R9: If the number of data is greater 15, then complexity is a high. Defuzzifier converts the fuzzy
437
output of the inference engine to crisp using membership functions analogous to the ones used by
438
the fuzzifier. The membership function must be computed and transferred as a crisp function in the
439
range of [0…1] as depicted in Table 6.
440 441
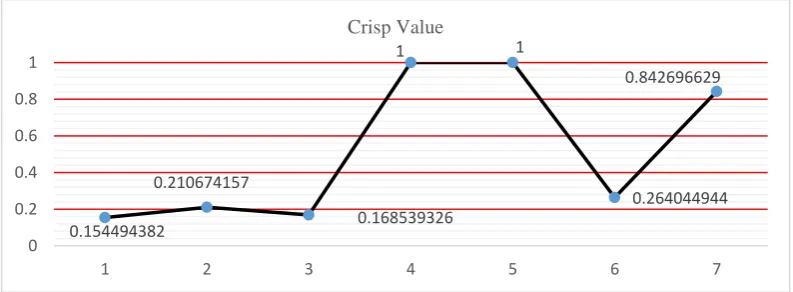
Table 6: The crisp values of each estimated effort
442 443
Complexity
Basic estimated effort
Crisp function
3 5.5 0.154494382
2 7.5 0.210674157
2 6 0.168539326
2 35.6 1
2 35.6 1
2 9.4 0.264044944
2 30 0.842696629
444 445 446
Based on the result in the Figure 2, the high complexity can be gained only if any data number
447
reach a value of 1 in crisp function. And the complexity medium is cached if the value of a crisp
448
function in the range of [0.264044944 …0.842696629]. Finally, the complexity low is acquired if the
449
value of a crisp function in the range of [0… 0.264044944].
450 451
452
Figure1: the relations between the number of data & efforts value
453 454
0 10 20 30 40 50
1 2 3 4 5 6 7 8 9 10 11 12 13 14 15 16 17 18 19 20 21 22 23
Eff
ort val
ue
455
Figure 2 presents the relations between the complexity & crisp values
456 457
Figure 3 shows the MSE for training and cross validation for the Fuzzy logic model. It is clearly
458
give evidence that the output of the fuzzy model is closely fit the desired data. The data sets are
459
divided into three categories (60 % as training data sets, 20% as a cross validation data sets and 20%
460
as a testing data sets). The model achieved a final MSE of (0.064708287) in the training phases, and it
461
is achieved minimum MSE of (0.001772667) as summarized in Table 7.
462
The fuzzy model will be exchanged the rules [R1 to R9], into a new form based on the crisp
463
function values. Therefore, the rules will be as follows:
464
R1: If the crisp value is 1, then complexity is a high.
465
R2: If the crisp value in the range [0.264044944 …0.842696629], then complexity is a high.
466
R3: If the crisp value in the range of [0… 0.264044944], then complexity is a low.
467
The same transformation will be implemented for the other rules for coding, design and testing.
468 469
470
Figure 3: The MSE for training and cross validation for Fuzzy logic model.
471
472 473
Table 7: The results of fuzzy model and Final MSE
474 475
Best Networks
Training Cross
Validation
Epoch # 200 478
Minimum MSE
0.054452516 0.001772667
Final MSE 0.064708287 0.114842201
476 477 478 479
0.154494382
0.210674157
0.168539326
1 1
0.264044944 0.842696629
0 0.2 0.4 0.6 0.8 1
1 2 3 4 5 6 7
Crisp Value
-0.2 0 0.2 0.4 0.6 0.8 1 1.2 1.4 1.6
1 100 199 298 397 496 595 694 793 892 991
M
SE
Epoch
MSE versus Epoch
10. Conclusion and Recommendations
480
The effort estimation model discussed in this paper focuses on estimating the effort of design,
481
coding and unit testing, and the first level estimates have been found to be within a variance of about
482
25%. The variance would improve for second level estimates and is expected to be about 15%.
483
Estimation must be as closer as possible.
484
Also the results can be compared with estimates calculated using function points and other
485
methods that use regression. The first level estimates calculated using the effort estimation model has
486
a variance of about 25% when compared with the actual effort. This variance is very much acceptable
487
considering the fact that the first level estimates can be tolerable up to 35%. The proposed effort
488
estimation tool would help the project managers to efficiently control the project, manage the
489
resources effectively, and improve the software development process and also trade off analyses
490
among schedule, performance, quality and functionality. A Soft Computing approach is
491
implemented and results are verified using the Fuzzy Logic models, which helps to compute the
492
complexity accurately and easily. A serious problem in the effort estimation models that some
493
subtasks aren’t used before, so they haven’t any complexity yet. By using the fuzzy models, it can
494
easily compute the complexity of these tasks and then estimate the effort needed to build the
495
application. Besides, using a fuzzy model helps to compute the complexity of a different type of tasks
496
like design, coding and testing.
497 498
Refrences
499
1. Aloka, S., Singh, P., Rakshit, G. and Srivastava, P.R. (2011) ‘Test effort estimation –
500
particle swarm optimization based approach’, International Conference on
501
Contemporary Computing IC3, Vol. 168, pp.463–474, India.
502
2. Thamarai, S. Murugavalli,“An Evolutionary Computation Approach for Project
503
Selection in Analogy based Software Effort Estimation”,Indian Journal of Science and
504
Technology,2016 June, 9(21), Doi no:10.17485/ijst/2016/v9i21/95286
505
3. S. Malathi, S. Sridhar, “Efficient Estimation of Effort Using Machine-learning Technique
506
for Software Cost”,Indian Journal of Science and Technology,2012 Aug, 5(7), Doi
507
no:10.17485/ijst/2012/v5i8/30539.
508
4. Ferrucci F, Gravino C, Oliveto R, Sarro F. Using tabu search to estimate software
509
development effort. InSoftware Process and Product Measurement 2009 Nov 4 (pp.
307-510
320). Springer Berlin Heidelberg.
511
5. Shilpee Chamoli, Gil Tenne, Sanjay Bhatia,“Analysing Software Metrics for Accurate
512
Dynamic Defect Prediction Models”,Indian Journal of Science and Technology,2015 Feb,
513
8(S4), Doi no: 10.17485/ijst/2015/v8iS4/63111.
514
6. Shaik Mohammad Shahabuddin, Y. Prasanth,“Integration Testing Prior to Unit Testing:
515
A Paradigm Shift in Object Oriented Software Testing of Agile Software
516
Engineering”,Indian Journal of Science and Technology,2016 May, 9(20), Doi
517
no:10.17485/ijst/2016/v9i20/91223.
518
7. Frei R, Di Marzo Serugendo G. Concepts in complexity engineering. International
519
Journal of Bio-Inspired Computation. 2011 Jan 1;3(2):123-39.
520
8. Kim Hee-Cheul, Kim Kyung-Soo ,“Software Development Cost Model based on NHPP
521
Gompertz Distribution”, Indian Journal of Science and Technology,2015 June, 8(12), Doi
522
no:10.17485/ijst/2015/v8i12/68332.
523
9. Saini DK, Ahmad M. Return on Investment and Effort Expenditure in the Software
524
Development Environment. International Journal of Applied Information Systems. 2012
525
Dec;4(7):35-41.
526
10. Srivastava PR, Varshney A, Nama P, Yang XS. Software test effort estimation: a model
527
based on cuckoo search. International Journal of Bio-Inspired Computation. 2012 Jan
528
1;4(5):278-85.
11. R. Sathyaraj, S. Prabu,“An Approach for Software Fault Prediction to Measure the
530
Quality of Different Prediction Methodologies using Software Metrics”, Indian Journal
531
of Science and Technology,2015 Dec, 8(35), Doi no: 10.17485/ijst/2015/v8i35/73717.
532
12. R. Arunachalam,“Innovative Approach of Testing in Event Driven Software
533
(EDS)”,Indian Journal of Science and Technology,2014 June, 7(S5), Doi
534
no:10.17485/ijst/2014/v7iS5/50295.
535
13. Saini DK. Prioritizing Test Case Generation for Software Testing in High Level
536
Programming Development Environment. International Journal of Computer
537
Applications. 2013 Jan 1;82(14).
538
14. O. M. Alshareet,“An Empirical Study to Develop a Decision Support System (DSS) for
539
Measuring the Impact of Quality Measurements over Agile Software Development
540
(ASD)”,Indian Journal of Science and Technology,2015 July, 8(15), Doi
541
no:10.17485/ijst/2015/v8i15/70774.
542
15. Saravanan, M. S. Irfan Ahmed, S. Sathya Bama ,“Policy Approval Engine - A Framework
543
for Securing Web Applications and Web User “,Indian Journal of Science and
544
Technology,2016 Jan, 9(4), Doi no:10.17485/ijst/2016/v9i4/84341.
545
16. R. Nagarajan, A. Velanganni Joseph, S. Sujatha,“Behavioural Aspects of Software Project
546
Management- In- House Software Development”, Indian Journal of Science and
547
Technology,2015 Feb, 8(S3), Doi no: 10.17485/ijst/2015/v8iS3/58771.
548
17. Zahra Asheghi Dizaji, Farhad Soleimanian Gharehchopogh,“A Hybrid of Ant Colony
549
Optimization and Chaos Optimization Algorithms Approach for Software Cost
550
Estimation”, Indian Journal of Science and Technology,2015 Jan, 8(2), Doi no:
551
10.17485/ijst/2015/v8i2/57776.
552
18. P. Monika, D. Venkatesan,“DI-ANN Clustering Algorithm for Pruning in MLP Neural
553
Network”,Indian Journal of Science and Technology,2015 July, 8(16), Doi
554
no:10.17485/ijst/2015/v8i16/62540.
555
19. Cui Z, Fan S, Zeng J, Shi Z. APOA with parabola model for directing orbits of chaotic
556
systems. International Journal of Bio-Inspired Computation. 2013 Jan 1;5(1):67-72.
557
20. Chintala, A., Pavan, K.V., Harish, V. and Ranjan, S.P, ‘Test effort estimation using neural
558
network’, Journal of Software Engineering Application (JSEA), 2010. Vol. 3, No. 4,
559
pp.331–340.
560
21. Farhad Soleimanian Gharehchopogh, Laya Ebrahimi, Isa Maleki, Saman Joudati
561
Gourabi, “A Novel PSO Based Approach with Hybrid of Fuzzy C-means and Learning
562
Automata in Software Cost Estimation”, Indian Journal of Science and Technology,2014
563
Jan, 7(6), Doi no:10.17485/ijst/2014/v7i6/46481.
564
22. Ali Badizadeh, Sohrab Khanmohammadi,“Developing a Fuzzy Model for Assessment
565
and Selection of the best Idea of New Product Development”,Indian Journal of Science
566
and Technology,2011 Dec, 4(12), Doi no:10.17485/ijst/2011/v4i12/30322.
567
23. P. Sekar,“On Fuzzy Information Theory”,Indian Journal of Science and Technology,2010
568
Sep, 3(9), Doi no: 10.17485/ijst/2010/v3i9/29882.
569
24. Zadeh, L.A. (2001). Applied Soft Computing. Applied Soft Computing 1, 1–2.
570
25. Uraibi, H.S., Midi, H., A Talib, B. and Yousif, J.H., 2009. Linear regression model
571
selection based on robust bootstrapping technique. American Journal of Applied
572
Sciences, 6(6), pp.1191-1198.
Appendix 1: List of Sub Tasks in ASP Program
582
ASP Items
Sub Task Description Complexity Effort
Person Hours
1 Adding a new menu to Branding Medium 6
2 Adding a sub-menu to Branding Medium 4
3 Adding a mouse event to a menu Medium 3
4 Adding a graphic to a menu/submenu Medium 1.5
5 Modifying a picture in Branding Header Medium 1.5
6 Modifying a link in Branding Header Low 1.5
7 Modifying a link in Branding Footer Low 1.5
8 Navigating the user to a specific page based on the user action
Low 1.5
9 Adding a java script function to validate user entries Medium 4
10 Modifying a java script function to validate user entries Low 2
11 Modifying display of GUI content Low 2.5
12 Adding a form element Low 1
13 Adding a client function to submit the form Low 1
14 Adding a server side function for pagination Medium 4
15 Removing a form element Low 1
16 Writing a server side function to render HTML content Medium 6
17 Adding a method to call a SQL statement using connection object
Low 1.5
18
Adding a method to call a Stored Procedure by passing parameters using a Command object
Medium 4
19 Modifying a method to call a SQL statement using connection object
Low 2
20
Modifying a method to call a Stored Procedure by passing parameters using a Command object
Low
3
21 Navigating a record set and displaying values in a form element
Medium 3
22
Adding a method to build a SQL statement and execute using Connection object
Medium
4
23 Populating static values in a form element Low 3
583 584
Appendix 2 : List of Features with Recommended Complexity
585
S .No.
Description SQL VB ASP
1 Check for the existence of a configuration parameter Low Low Low
2 Identify values in the database based on input Low
3 Update values in the database based on input Mediu
m
4 Insert new values in the database based on input Mediu
m 5 Update related values in the database based on the
master value inserted/updated
Mediu m
6 Loop through a set of values and perform updates High
7 Add filters Mediu
m
8 Establish referential integrity among entities Mediu
m
9 Delete value(s) based on input Low
1 0
Delete value(s) based on input and also establish referential integrity
Mediu m
1 1
Write a new field into the file Med
ium 1
2
Update a field in the file Med
ium 1
3
Select output based on input/filters Low
1 4
Select output based on complex logic High
1 5
Format the output Med
ium
Med ium 1
6
Add a new field to the entity Low
1 7
Validate a file Med
1 8
Map source field and destination field Med
ium 1
9
Identify the group to which a set of values belong Mediu m
2 0
Identify entities dynamically based on input High
2 1
Generate Reports Med
ium 2
2
Validate business rules Mediu
m Med ium Med ium 2 3
Validate Data Types Med
ium 2
4
Menu Design - Add a new menu High
2 5
Add a new sub-menu Med
ium 2
6
Add a mouse event to a menu Med
ium 2
7
Add a graphic to a menu/sub- menu Med
ium 2
8
Modify Branding Header Med
ium 2
9
Modify Branding Footer Med
ium 3
0
Read a value from registry Low Low
3 1
Write a value into registry Low Low
3 2
Add a new search criteria Med
ium
Med ium 3
3
Navigate the user to a specific page based on the user action
Med ium 3
4
Validate user entries Med
ium 3
5
Formatting GUI displays Med
ium 3
6
Add a new user input field Med
ium 3
7
Implement Pagination feature Low Med
ium 3
8
Removing a user input field Low
3 9
Displaying results in the form Med
ium
Med ium 4
0
Maintain user state across pages Med
ium
Med ium 4
1
Save user's search criteria Mediu
m Med ium Med ium 4 2
Adding privileges to user groups Mediu
m
Low Low
4 3
Computing values based on user input Mediu
m Med ium Low 4 4
Generate Reports in Complex Formats Mediu
m
High 4
5
Tune Performance High Med
ium
Med ium 4
6
Login Process Mediu
m
High Med
ium 4
7
Validate Login Privilege High Med
ium
Low 4
8
Purge Obsolete Data High Med
ium 4
9
Handle encrypted customer data Mediu
m
High Med
ium 5
0
Add a new entity Mediu
m 5
1
Import Data - design a utility High High
5 2
Print Reports Mediu
m Med ium High 5 3
Add a new menu based on user's privilege Mediu
m Med ium High 5 4
Add a sub-menu based on user's privilege Mediu
m Med ium Med ium 5 5
Validate user entries based on business rules Mediu
m
Med ium