1
Validation of a LC-MS/MS Method for Quantitative Analysis of MELK Inhibitor OTS167
in Mouse Serum: Application to a Pharmacokinetic Study
Wei-Peng Yong1,2#; Vinod Vijay Subhash1,3# Mitchell Qin-Ying Ee1,4; Nicholas Syn1,2 Mei Shi Yeo1; Xiaoqiang Xiang6; Andrea Li-Ann Wong1,2; Alan Prem Kumar1,5; Gautam Sethi5, Kam
Man Hui7; Paul Chi-Lui Ho4,Boon Cher Goh1,2,5 & Lingzhi Wang1,2* 1Cancer Science Institute of Singapore, National University of Singapore
2Department of Haematology & Oncology, National University Health System, Singapore 3MRC Cancer Unit, University of Cambridge, Hutchison/MRC Research Centre, Cambridge, United Kingdom CB2 0XZ
4Department of Pharmacy, Faculty of Science, National University of Singapore
5Department of Pharmacology, Yong Loo Lin School of Medicine, National University of Singapore
6Scholl of Pharmacy, Fudan University, Shanghai China
7Division of Cellular and Molecular Research, Humphrey Oei Institute of Cancer Research, National Cancer Centre, Singapore
# Equal contribution
*To whom correspondence should be addressed:
Lingzhi Wang (PhD), Cancer Science Institute of Singapore, National University of Singapore, 14 Medical Drive, #12-01, Centre for Translational Medicine Singapore 117599, Tel.: +65 65168925; Email: [email protected]
Keywords: MELK inhibitor; OTS167; LC-MS/MS; Pharmacokinetics, mouse serum.
ABSTRACT
A novel, rapid and sensitive liquid chromatography-tandem mass spectrometric
(LC-MS/MS) method was developed and validated for the evaluation of OTS167
pharmacokinetics in mouse serum. SN-38 was optimized to be selected as the
internal standard. Chromatographic separation was performed on a BDS Hypersil
C18 column (100 x 2.1 mm, 5 µm) using gradient elution with mobile phase solvent
A as water containing 0.1% formic acid and solvent B as acetonitrile containing 0.1%
formic acid. The analysis was carried out using multiple reaction monitoring (MRM)
with a triple-quadrupole mass spectrometer operated in the positive electrospray
ionization mode. Mass transitions of 487.2 > 348.0 and 393.2 > 349.2 were monitored
for OTS167 and SN-38 respectively. The standard calibration curve demonstrated
high linearity at a range of 5-1000 ng/mL, with a coefficient of determination (r2) ≥
0.996. The accuracy for OTS167 ranged from 92.3% to 102.2% and the precision was ≤
12.7%. Recovery was consistent at about 83% to 89%. No significant matrix effect
was observed. This method was successfully applied to monitor the pharmacokinetic
profiles in mice over 24 h after ingestion of 5 mg/kg of OTS167. Maximum serum
concentrations (3197 ng/mL) of OTS167 was observed at 1.67 hour after OTS167
ingestion via garage at 5 mg/kg and area under the curve (AUC) was 28579 h*ng/mL,
suggesting that OTS167 can be quickly absorbed after oral administration.
OTS167 is a potent MELK (maternal embryonic leucine zipper kinase) inhibitor with
selective antitumor activity[1,2]. MELK plays essential roles in the proliferation[1],
anti-apoptosis and metastasis of cancer cells, including the maintenance of stem cell-like
properties[3,4,5]. MELK is also associated with therapeutic resistance[6] and poor
prognosis[7,8,9]. Therefore, by targeting MELK, OTS167 offers the possibility to
overcome therapeutic resistance by suppressing cancer stem cells and cancer
proliferation[10,11]. Studies have shown that OTS167 demonstrates significant tumour
growth suppression in xenograft studies using breast, lung, prostate and pancreas
cancer cell lines in mice[12]. To date, only one analytical method (HPLC-UV) was
published for the identification and measurement of OTS167-glucuronide, a Phase II
metabolite of OTS167 in human microsomes, without any report of OTS167
quantification[13]. To the best of our knowledge, no liquid chromatography-tandem
mass spectrometric (LC-MS/MS) method has been reported for OTS167
quantification in serum/plasma for preclinical/clinical studies. No data regarding its
pharmacokinetic is available, thus making it hard to justify a suitable drug
formulation, administration route and dosing strategy for patients in subsequent
clinical trials. Since preclinical pharmacokinetic studies in mice are currently
ongoing, the need for a robust and sensitive method development arises. In this
study, we developed a novel, robust and sensitive LC-MS/MS method to investigate
the pharmacokinetic properties of OTS167 in mice. The method was well validated
(Figure 1). This LC-MS/MS method has been successfully applied to
pharmacokinetic study of OTS167 in mice.
2. Materials and Methods
2.1 Chemicals and Reagents
OTS167 was obtained from OncoTherapy Science Inc., Japan. Exemestane and SN-38
were purchased from Toronto Research Chemicals Inc., Canada. KPT-330 was
purchased from Selleckchem, USA. Methanol, acetonitrile and formic acid (100%)
were purchased from Merck, Germany. Milli-Q water was obtained from Milli-Q
Plus system, USA. Drug-free blank mouse serum was obtained from untreated
female NOD-SCID-γ (NSG) mice (NOD-scid IL2Rgammanull).
2.2 Chromatographic and mass Spectrometric conditions
Chromatographic analysis was performed on a high-performance liquid
chromatographic (HPLC) system, consisting of an Agilent 1100 binary pump,
degasser, auto-sampler and column oven (Agilent Technologies, Germany). BDS
Hypersil C18 column (100 x 2.1 mm, 5 µm, Thermo Fisher Scientific, USA), coupled
with a SecurityGuard cartridge (4.0 × 3.0 mm, Phenomenex, USA) was used for
chromatographic separation. Mobile phase solvent A was water containing 0.1%
formic acid and solvent B was acetonitrile containing 0.1% formic acid.
LC-MS/MS analysis was performed using multiple reaction monitoring (MRM) with
an API 4000 triple-quadrupole mass spectrometer (Applied Biosystems, MDS SCIEX,
data was analysed using Analyst software (Version 1.5.2, Applied Biosystems, MDS
SCIEX, Ontario, Canada).
2.3 Standards and quality control solutions
OTS167 stock solution was prepared in methanol at 1 mg/mL. OTS167 standard
solutions were prepared by serial dilution with methanol at seven concentrations: 0,
5, 10, 50, 200, 500 & 1000 ng/mL. SN-38, KPT-330 and exemestane solutions were
each prepared at 100 ng/mL. QC samples of OTS167 were prepared and analysed at
low (LQC), medium (MQC) and high (HQC) concentrations (30, 100 and 800 ng/mL).
All solutions were stored at 4°C.
2.4 Construction of calibration curves
Five µL of OTS167, SN-38 (Internal Standard, IS) and mouse serum were each added
into a 1.5 mL polypropylene (PP) centrifuge tube. 120 µL of 100% acetonitrile was
added for protein precipitation. The PP tubes were vortexed for 30 sec and
centrifuged at 14,000 rpm for 10 min at 4°C. 100 µL of the supernatant was
transferred to a second 1.5 mL PP tube and dried for 30 min at 45°C. The dried
residue was reconstituted with 70 µL of acetonitrile containing 0.1% formic acid –
water containing 0.1% formic acid mixture (15:85, v/v), vortexed for 30 sec and
centrifuged again as described previously. 60 µL of the supernatant was transferred
analysis. The injection needle was washed with 100% acetonitrile after each injection.
The standard calibration curve was constructed using seven concentrations of
OTS167 at 0, 5, 10, 50, 200, 500 & 1000 ng/mL. The standard calibration curve was
generated using peak area ratios of OTS167 to SN-38 against OTS167 concentrations.
2.5 Bioanalytical method validation
Bioanalytical method validation was carried out according to FDA guidelines[13].
Blank wash samples were analysed after the highest concentrations in the carry-over
test. Coefficients of determination (r2) of the standard curves were employed in the
linearity test. Accuracy and precision (coefficient of variation) were determined by
analysing OTS167 QC samples at nominal concentrations. Intra-day accuracy and
precision were established by performing a standard calibration curve and analysing
the QCs in quintuplicate in a single run. Inter-day accuracy and precision were
established by performing standard calibration curves and analysing the QCs in
quintuplicate on 5 different days. Accuracy was expressed as a percentage of the
mean value measured over the nominal value at each concentration whereas
precision was expressed in terms of coefficient of variation (CV), defined as a
percentage of standard deviation divided by the mean.
Matrix effect (ME) is a common and detrimental phenomenon in LC–MS or LC–
MS/MS procedures and can be evaluated accurately according to the following
formula:
ME (%) = [peak area in matrix
÷
peak area in neat standard] × 100 …… (1)When ME (%) is equal to 100, this indicates no matrix effect for current LC–MS/MS
conditions and sample preparation procedures. Deviations of ME (%) below or
above 100 indicate ion suppression or ion enhancement, respectively.[14]
Matrix effect of OTS167 and SN-38 was investigated by analysing the peak area
ratios of OTS167 and SN-38 in the matrix-based tubes to those in the reference tubes
performed in quintuplicate at 3 QC concentrations for OTSS167 and one
concentration for SN-38. In the matrix-based tube, 5 µL of blank mouse serum and
120 µL of 100% acetonitrile were added into a 1.5 mL PP tube. The tube was
vortexed for 30 sec and centrifuged at 14,000 rpm for 10 min at 4°C. 100 µL of the
supernatant was transferred to a second 1.5 mL PP tube. 5 µL of QC solution and
SN-38 were each added, and the PP tube was vortexed for 30 sec before being dried.
The dried residue was reconstituted with 70 µL of acetonitrile containing 0.1%
formic acid – water containing 0.1% formic acid mixture (15:85, v/v) and vortexed for
30 sec before being centrifuged as described previously. 60 µL of the supernatant
was transferred to a glass insert (250 µL) in an auto-sampler vial for analysis. The
procedure was repeated for the reference tube using 5 µL of Milli-Q water instead of
Recovery was determined by analysing the peak area ratios of OTS167 and SN-38 in
the tube spiked before extraction to those in the tube spiked after extraction. QC
samples in quintuplicate were performed at each concentration. For the tube spiked
before extraction, steps were performed as per Section 2.4.
2.7 Dilution procedure
In the quantification of serum samples, a dilution procedure was needed for those
samples exceeded the maximum calibrated concentration of OTS167 (1000 ng/mL).
20 or 40 times dilutions were performed using blank mouse serum before sample
preparation. Actual concentrations were then back-calculated by multiplying the
quantified concentrations by 20 or 40. The dilution procedure was validated using a
serum test sample spiked at 4000 ng/mL and then analysed with both dilution
factors in quadruplicate. No extrapolation of the calibration was performed to
quantify OTS167 at concentrations above 1000 ng/mL.
2.8 Stability
OTS167 stability in mouse serum was determined using triplicate of QC samples at
each concentration.
a) Short-term Temperature Stability
Stability testing was performed at intervals of 4, 8 and 24 hours. 9 aliquots of each
QC concentration were prepared in mouse serum and placed on the bench top. 3
were prepared as per Section 2.4, without adding OTS167 solution and mouse
serum, followed by analysis.
b) Freeze-thaw Stability
9 aliquots of each QC concentration were prepared in mouse serum, stored at -80°C
until completely frozen, and thawed unassisted at room temperature. After thawing,
the samples were refrozen at -80°C and the cycle was repeated to complete 3, 6 and 9
freeze-thaw cycles. Upon the completion of each set of cycles, 3 aliquots of each QC
concentration were prepared as per Section 2.4, without adding OTS167 solution and
mouse serum, followed by analysis.
2.9 Pharmacokinetic study of OTS167 in mice
The animal experiments were performed in accordance with the Guide for the Care
and Use of Laboratory Animals (iORC Reference Number: 2015-00787) and
approved by the NUS Institutional Animal Care and Use Committee (IACUC).
Female NOD-SCID-γ (NSG) mice (NOD-scid IL2Rgammanull) were purchased from
INVIVOS and housed at NUS Comparative Medicine Unit, MD1. The mice were 6-8
weeks old and had an average weight of 20 g on the day of dosing. No fasting was
involved prior to dosing.
OTS167 dose formulation was prepared with 50% DMSO in PBS to contain 0.5
mg/ml for dosing OTS167 at 5 mg/kg. Blood sampling was performed before dosing,
gavage. Approximately 100 µL of blood was collected from each mouse by facial
bleeding and harvested in 1.5 ml Eppendorf tubes. The blood samples were allowed
to clot by leaving it undisturbed for at least 30 minutes at room temperature. The clot
was removed and serum was collected by centrifuging at 5000 x g for 5 min at 4oC.
The serum samples were then stored frozen at -80oC and thawed unassisted at room
temperature before analysis. Sample preparation was carried out as per Section 2.4.,
except that 5 µL of methanol was added instead of OTS167 solution.
Non-compartmental analysis of the area under concentration (AUC) in a plot of
concentration of OTS167 against time was calculated using Phoenix 6.4
pharmacokinetic software.
3. Results and Discussion
A sensitive and robust LC-MS/MS method validated through our experiment has
been successfully applied to preclinical pharmacokinetic investigation of oral
OTS167 at 5 mg/kg in mice. To our knowledge, this is the first LC-MS/MS method for
quantitative analysis of OTS167 in biological samples. The optimized conditions for
LC-MS/MS analysis, robustness of the developed method and pharmacokinetics
properties were presented and discussed as follows.
3.1. LC-MS/MS Optimization
The mass spectrometer was operated in multiple reaction monitoring (MRM) scan
well as the internal standard. Mass transitions 487.2 > 348.0 m/z and 393.2 > 349.2
m/z were monitored for OTS167 (C25H28Cl2N4O2, molecular weight: 487.4) and SN-38
(C22H20N2O5, molecular weight: 392.4) respectively (Figure 2). Parameters were set as
in Table 1. For OTS167 and SN-38, the ion spray voltage, source
temperature/auxiliary gas temperature and entrance potential were set at 5500 V,
300°C and 8 V. The declustering potential, collision cell entrance potential and
collision cell exit potential are 121 V, 45 V and 18 V for OTS167 and 70 V, 35 V and 10
V for SN-38 respectively.
Three reversed-phase HPLC columns [BDS Hypersil C18 column (100 x 2.1 mm, 5
µm, Thermo Fisher Scientific, USA); Eclipse XDB-C8 column (2.1 x 50 mm, 5 µm,
Agilent Technologies, USA) & Luna C18 column (50 x 3.0 mm, 3 µm, Phenomenex,
USA)] were investigated for their chromatographic separation of analytes. BDS
Hypersil C18 column was selected as it gave the highest intensity and peak area and
the most symmetrical chromatographic peak.
Acetonitrile was selected as the mobile phase organic solvent due to a shorter
run-time and an improved baseline separation from endogenous substances as compared
to methanol[15]. Formic acid 0.1% was chosen as the aqueous solvent due to increased
sensitivity and better peak shape obtained, and to provide a source of protons[16] for
positive charge enhancement.
Gradient elution was used during chromatographic separation owing to its more
efficient removal of matrix components and other impurities present in the mouse
solvent A was maintained for 0.2 min and then decreased linearly to 5% from 0.2 to
0.4 min and maintained till 2.0 min. Next, solvent A was reverted to 85% till 3.1 min.
The run time was 6 min at a constant flow rate of 0.4 ml/min. A switch time table
was set wherein the diverter valve directed the elution flow to the waste container
from 0 min to 2 min, and then to the MS between 2 min and 5 min for sample
detection before directing back to the waste container to avoid contamination of the
mass spectrometer. By increasing the concentration of the organic solvent in a linear
fashion, hydrophobic interference compounds can be eluted out more efficiently,
thereby minimizing matrix effect which translates to better sensitivity, robustness
and reliability of the analytical method. Gradient elution also helps to prolong the
column lifespan as these interference components will not accumulate in the column
and affect subsequent analysis[17].
3.2. Extraction Protocol Optimization
Direct protein precipitation was performed for sample extraction as it is simple,
rapid and cost-effective. Since the use of this method may leave behind many matrix
components which contribute to matrix effect[18], we attempted to overcome this
problem by using minute volume of mouse serum (5 µL each time) and large
volumes of acetonitrile (120 µL). Since an efficient protein precipitation (>99%) could
be achieved with the use of acetonitrile greater than two volumes[19], acetonitrile in
twenty-four volumes (120/5 =24) was employed during sample preparation in our
matrix effect. This was confirmed by our results, which demonstrated insignificant
matrix effect (Table 2), thereby proving the effectiveness of this method in our study.
In such scenario, there is no need to use solid-phase and liquid-liquid extractions
even though they could produce cleaner samples than direct protein precipitation[17].
In addition, solid-phase and liquid-liquid extractions were not used as they are more
costly and labour-intensive. Therefore, the absence of significant matrix effect
showed that direct protein precipitation with a large volume of acetonitrile (120 µL)
was effective in minimizing the amount of matrix components in minute volume of
mouse serum (5 µL), thereby diminishing the need for a more tedious albeit cleaner
extraction method.
3.3. Selection of internal standard
Internal standards (IS) have been a crucial integral part of LC-MS/MS analysis.
During sample preparation, errors could potentially be introduced due to solvent
evaporation and adsorption. Injection errors in HPLC systems are also inevitable
and could result in inconsistent results[20]. Even though mass spectrometers possess
high sensitivity and selectivity for the analyte, residual endogenous matrix
components and exogenous materials may still be present despite adequate sample
preparation, leading to deleterious impact on accuracy, sensitivity and ionization
efficiency[20]. Internal standards are employed to overcome these problems since any
analyte loss would be compensated by the loss of a proportional amount of IS. Even
though absolute responses are affected, ratios remain consistent, thereby improving
In general, IS is either a stable isotopically-labelled analogue (SIL) or a structural
analogue and would hence share similar degrees of ion suppression/enhancement
with the analyte[21]. SIL are preferred since they are structurally identical to the
analyte. However, as OTS167 is a novel compound, both SIL and structural
analogues are not commercially available. The synthesis of a compound that is
structurally analogous to OTS167 is costly too. Therefore, a wider pool of readily
available compounds is required to search for a suitable IS. However, no reported
principle is available to guide such selection and the criteria to select a suitable IS are
currently undefined. Based on our previous experience, several aspects should be
considered in selection of IS during LC-MS/MS method development and validation
when no SIL is commercially available. These factors include Log p value, H-bond
donors and H-bond acceptors[22]. In our experiment, 3 compounds (SN-38, KPT-330
and Exemestane) with similar Log P but different H-bond donors and acceptors
were investigated (Figure 1). Mass transitions of 444.1 > 333.9 m/z and 297.0 > 121.0
m/z were monitored for KPT-330 (C17H11F6N7O, molecular weight: 443.3) and
exemestane (C20H24O2, molecular weight: 296.4) respectively. SN-38 was found to be
the best IS candidate as it gave an accuracy and precision of within ± 15% for all
three nominal concentrations (Figure 4). Although KPT-330 did not pass the
FDA-required ± 15% as the accuracies for its two lower nominal concentrations were less
than 85%, but this stipulated requirement was only missed by a narrow margin.
Exemestane however, showed an accuracy that was ≤ 72.6%, which was far off from
minimal signal suppression (93.8-98.1%) owing to matrix effect exited only when
SN-38 was used as IS. Moreover, its relative matrix effect close to 100% for all three
nominal concentrations implied that the matrix effect was quite stable, resulting in
good robustness of this novel LC-MS/MS method. Hence, SN-38 was presented as
the best choice and was selected as an IS candidate for method development and
validation. Our results demonstrated that SN-38 which possesses the same H-bond
donors (2) and acceptors (6) as those of OTS167 has been successfully used as the
optimized internal standard for method development and validation. This results on
selection of suitable IS for LC-ESI-MS/MS method are consistent with those
discovered in our nimbolide pharmacokinetics study.[22]
3.4. Method Validation
3.4.1. Carry-over and Linearity
No carry-over effect was observed as no peaks appeared in the chromatograms
when blank wash samples were injected after the highest concentration calibration
standards.
Good linearity of the standard calibration curve was achieved at r2≥ 0.996, implying
strong correlation between OTS167 concentrations and its peak area ratio at the
linear range of 5-1000 ng/mL. LLOQ was 5 ng/mL and the signal-to-noise (S/N) ratio
3.4.2. Accuracy and Precision
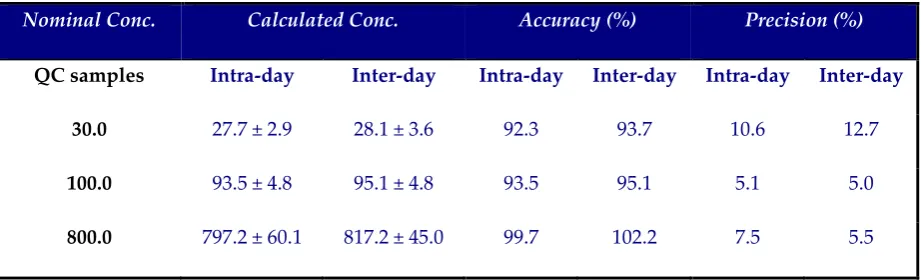
The accuracy ranged from 92.3% to 102.2% and the precision was ≤ 12.7% (Table 1).
Both intra-day and inter-day accuracy and precision were within ± 15%, according to
FDA guidelines.
3.4.3. Matrix Effect
Matrix effect was found to be insignificant (Table 2) as the relative matrix effect was
close to 100% for all three nominal concentrations. This could be due to the minute
volume of mouse serum used, which reduced the amount of biological matrix
residues present in the samples that could potentially affect ionisation efficiency.
3.4.4. Recovery
Recoveries of OTS167 and SN-38 were found to be consistent and similar at about
83% to 89% (Table 3), demonstrating the efficiency of the extraction method as both
compounds were extracted to a reasonable recovery.
3.4.5. Dilution Factor
As most mouse serum samples exceeded the maximum calibrated concentration of
OTS167 (1000 ng/mL), 20 or 40 times dilution was performed using blank mouse
serum before sample preparation. Accuracy and precision were within ± 15%,
3.4.6. Stability
OTS167 in all three nominal concentrations showed stability within ± 15%,
suggesting reasonable stability according to FDA guidelines (Table 5). This indicated
that OTS167 was stable in mouse serum during freeze-thaw cycles and when placed
on the bench top at room temperature for a short period of time of up to 24 hours.
3.5. Application of Validated LC-MS/MS Method in pharmacokinetic study
A well-validated method for OTS167 quantification was successfully applied in a
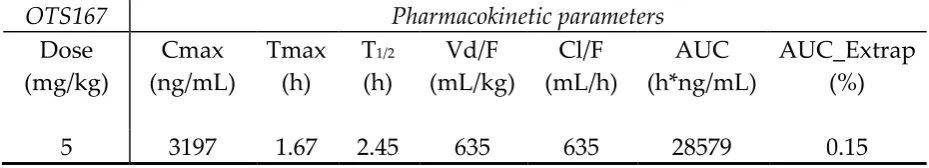
preclinical pharmacokinetic study. Pharmacokinetic profiles of OTS167 over 24 h at 5
mg/kg were plotted in Figure 5. The pharmacokinetic parameters were summarized
in Table 6. The mean half-life (t1/2) and apparent volume of distribution (V/F) of
OTS167 were found to be 2.45 h and 635 mL/kg respectively, suggesting that the
drug was distributed into body tissues extensively[23]. This might be attributed to
relative metabolic stability, the hydrophobic and charge interactions of OTS167,
which explains its potential interaction with the negatively-charged phospholipids
on tissues and hence good binding to tissues.
Maximum concentrations (Cmax) of OTS167 were observed as high as 3197ng/mL at
1.67 hour (Tmax) after OTS167 ingestion of 5 mg/kg via garage. AUC were 28579
h*ng/mL. Based on our results, OTS167 offers good oral drug exposure that is more
detected at 1-2 h after oral ingestion as well as an appropriate t1/2 suggests that
OTS167 is easily absorbed through intestine and not extensively metabolised in mice.
Based on the clinicaltrials.gov registry, most of the current clinical trials for OTS167
are conducted using the i.v. route in cancer patients. Since OTS167 offers a high oral
drug exposure, clinical trials could consider dosing OTS167 orally instead, as this
route of administration poses several advantages over the i.v. route. These
advantages include decreased discomfort, reduced financial burden as well as a
greater convenience and compliance for patients since they could take the
medication themselves at home.
4. Conclusions
A novel, rapid and sensitive liquid chromatography-tandem mass spectrometric
(LC-MS/MS) method was developed and validated for the evaluation of OTS167
pharmacokinetic in mouse serum according to FDA guidelines. To the best of our
knowledge, this is the first LC-MS/MS method for the determination of OTS167 that
has been successfully applied to monitor the pharmacokinetic profiles in mice over
24 h after oral ingestion at dose of 5 mg/kg. Our pharmacokinetics study suggested
that OTS167 can be quickly absorbed after oral administration with an appropriate
Acknowledgements
This work was supported by the National Research Foundation of Singapore
(Experimental Therapeutics Program) and the National Medical Research Council of
Singapore (NMRC/CSA/021/2010). The study is funded by National Medical
Research Council (NMRC) Centre Grant awarded to the National University Cancer
References
1. M-L. Lin, J-H. Park, T. Nishidate, Y. Nakamura, T. Katagiri. Involvement of maternal embryonic leucine zipper kinase (MELK) in mammary carcinogenesis through interaction with Bcl-G, a pro-apoptotic member of the Bcl-2 family. Breast Cancer Res. 2007;9(1):R17.
2. Nakano I, Masterman-Smith M, Saigusa K, A.A. Paucar, S. Horvath, L. Shoemaker, M. Watanabe, A. Negro, R. Bajpai, A. Howes, V. Lelievre, J.A. Waschek, J.A. Lazareff, W. A. Freije, L.M. Liau, R.J. Gilbertson, T.F. Cloughesy, D.H. Geschwind, S.F. Nelson, P.S. Mischel, A.V. Terskikh, H.I. Kornblum. Maternal embryonic leucine zipper kinase is a key regulator of the proliferation of malignant brain tumors, including brain tumor stem cells. J Neurosci Res. 2008;86(1):48-60.
3. S. Chung, K. Kijima, A. Kudo, Y. Fujisawa, Y. Harada, A. Taira, N. Takamatsu, T. Miyamoto, Y. Matsuo, Y. Nakamura. Preclinical evaluation of biomarkers associated with antitumor activity of MELK inhibitor. Oncotarget. 2016; 7(14):18171-18182.
4. L.W. Hebbard, J. Maurer, A. Miller, J. Lesperance, J. Hassell, R.G. Oshima, A.V. Terskikh. Maternal Embryonic Leucine Zipper Kinase Is Upregulated and Required in Mammary Tumor-Initiating Cells In vivo. Cancer Res. 2010; 70(21):8863-8873.
5. K. Joshi, Y. Banasavadi-Siddegowda, X. Mo, S.H. Kim, P. Mao, C. Kig, D. Nardini, R.W. Sobol, L.M. Chow, H.I. Kornblum, R. Waclaw, M. Beullens, I. Nakano. MELK-Dependent FOXM1 Phosphorylation is Essential for Proliferation of Glioma Stem Cells. Stem Cells (Dayton, Ohio). 2013;31(6):1051-1063.
6. M. Dean, T. Fojo, S. Bates. Tumour stem cells and drug resistance. Nat Rev Cancer. 2005; 5(4):275-284.
7. S. Choi, J.L. Ku. Resistance of colorectal cancer cells to radiation and 5-FU is associated with MELK expression. Biochem Biophys Res Commun. 2011; 412(2):207-213.
8. R. Kuner, M. Fälth, N.C. Pressinotti, C. Caldas, V.L. Hedge, M. Mourtada-Maarabouni, G.T. Williams. The maternal embryonic leucine zipper kinase (MELK) is upregulated in high-grade prostate cancer. J Mol Med (Berl). 2013;91(2):237-248.
associated with poor prognosis in breast cancer. Breast Cancer Res. 2009;11(4):R60.
10.Beke L, Kig C, J.T. Linders, S. Boens, A. Boeckx, E. van Heerde, M. Parade, A. De Bondt, I. Van den Wyngaert I, T. Bashir, S. Ogata, L. Meerpoel, A. Van Eynde, C.N. Johnson, M. Beullens, D. Brehmer, M. Bollen. MELK-T1, a small-molecule inhibitor of protein kinase MELK, decreases DNA-damage tolerance in proliferating cancer cells. Biosci Rep. 2015;35(6):e00267.
11.S. Chung, H. Suzuki, T. Miyamoto T, N. Takamatsu, A. Tatsuguchi, K. Ueda, K. Kijima, Y. Nakamura, Y. Matsuo. Development of an orally-administrative MELK-targeting inhibitor that suppresses the growth of various types of human cancer. Oncotarget. 2012;3(12):1629-1640.
12.J. Ramírez, S. Mirkov, L.K. House, M.J. Ratain. Glucuronidation of OTS167 in Humans Is Catalyzed by UDP-Glucuronosyltransferases UGT1A1, UGT1A3, UGT1A8, and UGT1A10. Drug Metab Dispos. 2015;43(7):928-935.
13.Guidance for Industry Bioanalytical Method Validation. US Food and Drug Administration
14.L.Z. Wang, R.Y. Ong, T. M. Chin, W.L. Thuya, S. C. Wan, A. L. Wong, S.Y. Chan, P.C. Ho, B.C. Goh. Method development and validation for rapid quantification of hydroxychloroquine in human blood using liquid chromatography-tandem mass spectrometry. J Pharm Biomed Anal. 2012;61:86-92.
15.L.Z. Wang, S.H. Goh, A.L. Wong, W.L. Thuya, J.Y. Lau, S.C. Wan, S.C. Lee, P.C. Ho, B.C. Goh. Validation of a Rapid and Sensitive LC-MS/MS Method for Determination of Exemestane and Its Metabolites, 17β-Hydroxyexemestane and
17β-Hydroxyexemestane-17-O-β-D-Glucuronide: Application to Human Pharmacokinetics Study. PLoS ONE. 2015;10(3):e0118553.
16.K.A. Mortier, G.F. Zhang, C.H. Van Peteghem, W.E. Lambert. Adduct formation in quantitative bioanalysis: Effect of ionization conditions on paclitaxel. J Am Soc Mass Spectrom. 2004;15(4):585-592.
17.The LC Handbook: Guide to LC Columns and Method Development. Vol 5990-7595EN Agilent Technologies; 2016.
18.E. Chambers, D.M. Wagrowski-Diehl, Z.L. Lu, J.R. Mazzeo. Systematic and comprehensive strategy for reducing matrix effects in LC/MS/MS analyses. J Chromatogr B. 2007;852(1-2):22-34.
20.E. Stokvis, H. Rosing, J.H. Beijnen. Stable isotopically labeled internal standards in quantitative bioanalysis using liquid chromatography/mass spectrometry: necessity or not? Rapid Commun Mass Spectrom. 2005;19(3):401-407.
21.P.J. Taylor. Matrix effects: the Achilles heel of quantitative high-performance liquid chromatography–electrospray–tandem mass spectrometry. Clin Biochem. 2005; 38(4):328-334.
22.A Sensitive Liquid Chromatography-Tandem Mass Spectrometry Method for the Determination of Nimbolide in Mouse Serum: Application to a Preclinical Pharmacokinetics Study. Wang L, Phan DK, Syn N, Xiang X, Song H, Thuya WL, Yang S, Wong AL, Kumar AP, Yong WP, Sethi G, Ho PC, Goh BC. Pharmaceutics. 2018; 10(3):1-12.
23.W.A. Korfmacher. Using Mass Spectrometry for Drug Metabolism Studies, Second Edition. CRC Press; 2009.
24.H. Alachkar, M.B.G. Mutonga, K.H. Metzeler, N. Fulton, G. Malnassy, T Herold, K. Spiekermann, S.K. Bohlander, W. Hiddemann, Y. Matsuo, W. Stock, Y. Nakamura. Preclinical efficacy of maternal embryonic leucine-zipper kinase (MELK) inhibition in acute myeloid leukemia. Oncotarget. 2014;5(23):12371-12382.
25.H. Inoue, T. Kato, S. Olugbile, K. Tamura, S. Chung, T. Miyamoto, Y. Matsuo, R. Salgia, Y. Nakamura, J.H. Park. Effective growth-suppressive activity of maternal embryonic leucine-zipper kinase (MELK) inhibitor against small cell lung cancer. Oncotarget. 2016;7(12):13621-13633.
26.A.T. Stefka, J.H. Park, Y. Matsuo, S. Chung, Y. Nakamura, A.J. Jakubowiak, S. Rosebeck. Anti-myeloma activity of MELK inhibitor OTS167: effects on drug-resistant myeloma cells and putative myeloma stem cell replenishment of malignant plasma cells. Blood Cancer J. 2016;6(8):e460.
LEGEND
Figures:
Figure 1. The Chemical Structures of OTS167, SN-38, KPT-330 and Exemestane with
Figure 2. Product ion MS/MS scan spectra of OTS167 at m/z 487.2→348.0 (left) and
SN-38 at m/z 393.2→349.2 (right)
Figure 3. Representative chromatograms of OTS167 at (A) 0 ng/mL, (B) LLOQ of 5
ng/mL and (C) 24h mouse serum sample and (a), (b) and (c) as 100 ng/mL of SN-38
as internal standard
Figure 4. Accuracy of OTS167 QC samples using 3 different internal standards each
at a concentration of 100 ng/mL (red dotted lines represent the range for
FDA-stipulated requirement of ± 15%)
Figure 5. Mean (n = 3) serum concentration - time profile of OTS167 at 5 mg/kg
administered orally in mice.
Tables:
Table 1. Intra-day and Inter-day Accuracy and Precision of OTS167 QC (ng/mL)
Table 2. Matrix Effect of OTS167 QCs and SN-38 at 100 ng/mL
Table 3. Recovery of OTS167 QC samples and SN-38
Table 4. Accuracy and Precision of Dilution Procedure for OTS167
Table 5. Short-term and Freeze-thaw Stability of OTS167 QC samples
Table 6. Pharmacokinetic parameters of OTS167 administered orally in mice
Nominal Conc. Calculated Conc. Accuracy (%) Precision (%)
QC samples Intra-day Inter-day Intra-day Inter-day Intra-day Inter-day
30.0 27.7 ± 2.9 28.1 ± 3.6 92.3 93.7 10.6 12.7
100.0 93.5 ± 4.8 95.1 ± 4.8 93.5 95.1 5.1 5.0
800.0 797.2 ± 60.1 817.2 ± 45.0 99.7 102.2 7.5 5.5
Table 2. Matrix Effect of OTS167 QCs and SN-38 at 100 ng/mL
Nominal Conc.
(ng/mL)
Matrix Effect of
OTS167 (%)
Matrix Effect of IS
at 100 ng/mL (%)
Relative Matrix
Effect (%)
30.0 88.1 ± 7.4 98.1 ± 10.4 89.8%
100.0 101.8 ± 9.9 97.4 ± 12.8 104.5%
800.0 93.1 ± 11.0 93.8 ± 5.6 99.3%
Table 3. Recovery of OTS167 QC samples and SN-38
Compound Nominal Conc. (ng/mL) Recovery (%)
OTS167_QC1 30.0 89.2
OTS167_QC2 100.0 83.4
OTS167_QC3 800.0 89.0
SN-38 100.0 88.8
Table 4. Accuracy and Precision of Dilution Procedure for OTS167
Nominal Conc.
(ng/mL)
Dilution
Factor
Quantified Concentration
(Mean ± S.D., ng/mL)
Accuracy (%) Precision (%)
40 3451 ± 119.1 86.3 3.5
Table 5. Short-term and Freeze-thaw Stability of OTS167 QC samples
Nominal Conc. (ng/mL) Short-term (hours) Freeze-thaw (cycles)
QC samples 4 8 24 3 6 9
30 96.8 86.3 85.7 90.0 91.4 89.7
100 101.5 97.3 85.8 99.5 112.5 94.0
800 95.7 93.1 89.3 114.9 97.6 108.4
Table 6. Pharmacokinetic parameters of OTS167 administered orally in mice
OTS167 Pharmacokinetic parameters
Dose (mg/kg)
Cmax (ng/mL)
Tmax (h)
T1/2
(h)
Vd/F (mL/kg)
Cl/F (mL/h)
AUC (h*ng/mL)
AUC_Extrap (%)