Quantifying Side-Channel Information Leakage from Web
Applications
Luke Mather, Elisabeth Oswald
University of Bristol, Department of Computer Science, Merchant Venturers Building, Woodland Road, BS8 1UB, Bristol, UK
{Luke.Mather,Elisabeth.Oswald}@bris.ac.uk
Abstract. Recent research has shown that many popular web applications are vulnerable to side-channel
attacks on encrypted streams of network data produced by the interaction of a user with an application. As a result, private user data is susceptible to being recovered by a side-channel adversary. A recent focus has been on the development of tools for the detection and quantification of side-channel information leaks from such web applications. In this work we describe a model for these web applications, analyse the effectiveness of previous approaches for the quantification of information leaks, and describe a robust, effective and generically applicable metric based on a statistical estimation of the mutual information between the user inputs made in the application and subsequent observable side-channel information. We use our proposed metric to construct a test capable of analysing sampled traces of packets to detect information leaks, and demonstrate the application of our test on a real-world web application.
1
Introduction
A pervasive theme in recent web application development is a move toward increasingly complex, interactive programs, with more and more computation being moved into the cloud. This has resulted in an increase in user data being retained in cloud services and accessed by the user using a web browser on any type of client device. Consequently, a significant amount of personal information is now being transferred across networks as users interact with these web applications day-to-day.
A passive adversary eavesdropping on the network traffic between a client and the web application server will be able to capture IP packets and reconstruct the data being sent to and from the web application if the data is unencrypted. If the web application is processing user-entered data that a user wishes to remain private, the server hosting the web application will typically deploy the TLS protocol over HTTPS to encrypt the data with the goal of ensuring that an adversary eavesdropping on the traffic resulting from web application transitions cannot learn the inputs entered by the user or the particular state the web application is in.
However, as first pointed out by Chen et al. [8], side-channel observations made on network traffic between a client and a server during the execution of a web application can reveal information about the user inputs made at a particular state or personal information stored in server databases. Chen et al. illustrated that an adversary can utilise knowledge of tuples of packet sizes and directions to reveal user choices made in financial, medical and search applications.
Follow-on work has focused on developing strategies and tools for web application designers and implementors with which to find such information leakages in order to secure their applications against side-channel adversaries [5,32]. A key point in this work is to spot and quantify when/where the information leaks from a web application within the network traffic. The approaches currently available all come with several caveats, such as high dependency on chosen metric [5] or the inability to deal with noisy observations [32].
One advantage of using mutual information over alternative heuristic-based classifiability metrics is that it allows us to compute the information leakage for a given usage pattern for the web application, or by computing the channel capacity allows us to determine the usage pattern of the application that leaks the most information. A second advantage of our mutual information metric is that in the discrete case derived confidence intervals provide a degree of rigour unavailable in previous approaches to solving this problem.
We outline a suitable leak-detection technique capable of mechanically and quickly identifying the majority of simple information leaks. Our technique involves considering the time-series of the sequence of packets produced by the communication between the client computer and the web server and computing the mutual information between the application inputs and selected properties of the packets at each position in the sequence. Considering the distributions of individual packets allows us to quickly detect the most common types of information leak; the joint distribution of multiple packets can be computed to detect more complex leaks.
This paper is structured as follows. We provide a formal model for a web application in section 2 and review related literature. In section 3 we discuss previous approaches and related work for this problem. Our choice of metric is detailed (as well as its pros and cons) in section 4. Thereafter we formally describe our leakage detection test and illustrate it on (a part of) the NHS direct website1 in section 5. Finally, in section 6 we demonstrate further the application of our test in analysing the effectiveness of several countermeasures.
2
Modelling web applications
Every web application can be formalised as an input-driven finite state machine. A web application always exists in some state that waits for some user-specific input that may be one or more combinations of mouse-clicks, form elements, database data or key presses. The combination of these inputs determines the new state the web application should transition to. Inputs may be selected on both the client and server machines, either directly by the user (for example through selecting hyperlinks or filling out HTML forms), generated by the web application itself (e.g. cookies, unique identifer strings or internal program variables), or taken from database storage (e.g. user account information). We hence formally describe a web application as follows below.
Model. A web application may be represented as the following quintuple (S,O,A, f, g):
– S – A web application is always in one ofm=|S|possible statess∈ S. We define a state to be a unique configuration of the web browser DOM on a client machine.
– A – Each state is associated with a set of inputs A. At each state a subset of inputs a ∈ A are sent to server and used to determine the next state the web application should transition to.
– f– Each transition from one state to another is defined according to some (potentially probabilistic) function f :S × A → S. The evaluation off is made by the application web server, and the next application state is transferred back across the network to the client machine.
– O – State transitions cannot be observed directly, but each transition is associated with one of n =|O| observable side-channel outputso∈ O. We call these outputs atrace. Note that each observable output is a single trace.
– g – The observable outputs are generated according to a function g :S × A → O, where g(s, a) =o◦, withrepresenting the noise in the observations.
We now discuss further the properties of our observables, i.e. traces, in practice.
1This is a free web application provided by the UK national health service. The part of the application that we
2.1 Traces
Traces are the result of a state transition within a web application: when an input to a particular web application state is made by a user, the client’s browser first sends the input data to the server hosting the web application, which then responds with additional data or a new web page corresponding to the next web application state. The nature of this outgoing and incoming traffic to the client is therefore dependent on the particular data being entered into the web application and the corresponding state the web application is in.
Non-deterministic traces. A key factor to consider is the non-deterministic nature of network traces gener-ated from the selection of an input at a particular state. Variation in sampled traces comes from the fact that in practice, network traffic between a client machine and a server hosting a web application is dependent on many factors. For instance:
– Network quality/congestion/latency and the user’s geographic location at the time of data capture will affect total traffic size and packet arrival timings;
– Web pages themselves vary over time, for instance through dynamic content, different advertisements and varying time-dependent information, which affects total traffic size;
– The connection type and medium (‘normal’, VPN, Tor; fibre-optic, satellite) will heavily affect all types of packet features;
– Traffic information may be added at layers below the application layer in the network model, which may affect packet sizes;
– Users may click to transition to a new state before the current state has finished loading, artificially shortening the trace;
– Proposed application, transport and link-layer countermeasures typically attempt to randomly distort net-work traces.
Clearly it becomes important to either control for these factors within any leakage detection strategy or ensure that they are clearly defined as assumptions in the implementation configuration, e.g. : This web application has leakageX when a user connects through Tor. The division of the factors into these two categories is determined by whether a factor can be accounted for in the description of the implementation environment or not. For example, variation in web page content as a result of advertising is difficult to control for, but will result in variable trace sizes when the web application is repeatedly executed with the same inputs. Summarising: it is critical that any leakage detection strategy can incorporate probabilistic output traces.
Trace features A network trace ois a multi-dimensional object, consisting of multiple packets each of which have multiple properties: for example a hypothetical trace may consist of 20 TCP packets, each of which have their own arrival time, payload size, direction (to the server, to the client) and set TCP options. We define a trace feature to be a particular function of a subset of packet properties taken over all the packets in a trace. Example features may be the total size of all of the trace packets, the size of a particular packet, the order of the communication between the client and the server or inter-packet arrival timings. Figure 1 illustrates a trace sampled from our online health website.
Not all of the information contained within a network trace will be dependent on the input choices made by the user. In many cases the inter-packet arrival timings may be entirely independent of the input choice made by a user, for instance. Taking the perspective of a Bayesian adversary, the challenge is to identify the trace features that most strongly distinguish one input choice from another, and then use these efficiently in an attack algorithm. Dyer et al. make a similar claim in their recent work on subverting common traffic analysis countermeasures [12]. From the perspective of a person attempting to assess the information leakage of the application, the challenge is somewhat different: to identify the trace features that leak the most information about the input choices and if possible mitigate this leakage.
0 10 20 30 40 50 60 0
500 1000 1500
Index of packet in sequence
Total packet size (bytes)
Example trace sampled from a popular online health website
Fig. 1.A packet trace sampled from a popular online health website. The total size in bytes of each individual packet
is represented as the trace feature.
application transitions to the new state S2, and in the case of b transitions to S3. A key difference between
the two states S2 and S3 is that S3 is approximately 10000 bytes in size, 2000 bytes larger than S2 at 8000
bytes. In this case, trace features that will leak information are the total size of the server response, and the presence of additional packets in the longer traces produced when the user selectsb. A visual representation of the application is in Figure 2.
s
1s
3a
b
o
a= 8kbo
b= 10kbs
2Fig. 2.A simple hypothetical application with three states, two inputs and differing server response sizes.
2.2 Designer and adversary strategies
The steps required in the processes of quantifying information leakage from a designer’s perspective and at-tacking a web application from an adversarial perspective are outlined in Figure 3. We can see that the first two steps are equivalent for the roles of designer and adversary. As in practice a web application has to be treated like a black-box, to understand the behaviour of the application outputs both roles have to sample the web application in its deployed state. It is critical for both roles to sample the application well enough to accurately estimate the trace behaviour. A different way of describing this is to say that the success of an attack or leak quantification method is essentially dependent on the underlying ability of the designer or adversary to successfully estimate the probability distribution of the trace outputs given the secret inputs. An adversary may or may not have full access to every area of the application, so in some cases the adversary’s ability may be diminished in this area. As network traces are significantly multi-dimensional, time-ordered vectors of features, the next challenge for an adversary and a designer is to identify the feature(s) or transformation of features that contain the most information about the secret inputs. This stage is highly similar to the feature extraction and feature selection problems in machine-learning.
Data acquisition
Feature selection / feature extraction
Leak quantification
Guess input given new trace(s)
Data acquisition
Feature selection / feature extraction
Train classifier / construct attack Designer Adversary
Fig. 3. Schematic defining the differing approaches taken by an application designer looking to identify information
leaks, and an adversary attempting to attack the application.
the data resulted from. In this supervised learning context, empirical studies indicate that the most common attack strategy is a Bayesian classifier [3,16,18,23], so typically the adversary next has to select an appropriate classification strategy, and train the resulting method using the data sampled in step 1. Finally, the adversary will execute their attack using one or more traces captured during the interaction of a user with the web application.
So whilst an application designer attempting to detect information leaks and an adversary attempting to attack an application have the dual goal of identifying (and thus quantifying) the trace features that leak the most information, the feedback required by the designer and the adversary is different. An adversary is concerned with the power of his or her attack, and hence requires a metric capable of quantifying the practical performance of the attack strategy. The designer is concerned with the size of the information leak itself; not with precisely evaluating the exact ability of any single adversary to exploit it.
3
Previous work
Previous work in the area focuses on two distinct questions. The first is how to construct successful attacks (i.e. the focus is on exploitation of leakage; we described this as the attacker’s perspective previously). The second question is how to detect and mitigate leakage (i.e. the focus is on leakage detection; we described this as the designer’s perspective previously).
It is critical that any leakage metric be sufficiently generic to be able to directly compare two different imple-mentations of an application. The performance of attack strategies will vary across different applications, and hence by recording the success of an attack alone we can only make comparisons that assess information leakage against that particular adversary. The most common attack strategy is a Bayesian classifier, and that of the various inputs to the classifier that affect its success, the choice of trace feature(s) is paramount [12]. Hence, we suggest that a suitable leakage metric should be able to quantify the information contained in a set of trace features. Standaert et al. take the same approach of distinguishing between metrics for assessing security and metrics to quantify the quality of attacks in their framework for the evaluation of side-channel key-recovery attacks [27].
We now focus on previous work concerned with leak detection and leakage metrics.
3.1 Leak detection/quantification
after the adversary has seen the observable outputs, and using metrics to quantify the classifiability of the secret inputs given the observable outputs.
Chen et al. [32] propose using the conditional entropy of the secret inputs after the trace outputs have been observed. They describe rerun testing, which samples the channel distribution by running the web application source code, and then computes the conditional entropy between the application inputs and the sampled observations. The conditional entropy metric estimates the remaining uncertainty about the tested inputs given the sampled observations, and so can be used directly as a quantification metric.
Rerun testing is a white-box strategy that does not incorporate any probabilistic trace information; in the data acquisition phase any trace features that vary are discarded. Noise will be present in a situation where a web application is deployed as a live system, as described in section 2, so a strategy of retaining only invariant trace features will often result in valuable information being discarded. In our own experiments we have observed situations in which strongly distinguishing packets are sometimes noisy; an adversary will only sometimes be able to determine the input choice made, but the information leak may be significant.
Chapman and Evans [5] describe two different classifiability-based quantification metrics that estimate infor-mation leakage by clustering sampled trace features using several distance metrics derived from an analysis of trace features, and then a quantify the quality of the clustering to capture the size of a leak. Informally, the hypothesis is that clusters that are more strongly separated should produce a lower estimate of information leakage.
Their first metric estimates the ambiguity set reduction of the input space in terms of loss of entropy. An ambiguity set is a set of inputs that an adversary cannot distinguish from each other. To decide when two inputs are indistinguishable, Chapman and Evans take the center of each cluster of sampled outputs and determine a threshold distance around each cluster center that includes a certain percentage of the sampled outputs for that input. If the center of a cluster is inside the threshold distance of another cluster, then those two clusters are considered indistinguishable to an adversary. An inherent problem with this strategy is that the leakage result becomes very sensitive to the almost arbitrary choice of threshold distance. The only feedback mechanism to aid in the establishment of the threshold distance is the success of an attack; hence it is likely that a leakage result calculated using this method will estimate the strength of theattack, rather than the size of the information leak itself. Additionally, the linearity of the probability distribution of the features is not taken into account. In some situations, there may be no natural ordering to the feature distribution; treating the sampled features as continuous, ordered data will in some cases not make use of this property.
Chapman and Evans’ second metric directly estimates the clustering quality by computing the Fisher criterion ([14]), a function that is typically used in linear discriminant analysis (LDA) to estimate classifiability for use in feature extraction. The Fisher criterion computes the ratio between the inter- and intra-cluster variance; hence two heavily overlapping clusters will have a low Fisher criterion, and as clusters become more strongly separated, the Fisher criterion will tend to infinity. The Fisher criterion is a capable metric in the case of two clusters being linearly separated, but its suitability will degrade as the relationship between two clusters becomes increasingly non-linear, or as the sampled data becomes decreasingly less continuous. In general, it may be that a particular classifiability metric works well for a data set captured from one web application, but not another, or works well for a particular type of trace feature and not others. Any classifiability result is sensitive to the choice of distance metric, the feature chosen from the traffic traces, and the combined challenge of selecting an appropriate distance metric for the feature. For continuous data, such as packet sizes, the choice of distance metric may be fairly straightforward, but for other features such as the control flow of the trace data, the answer is less obvious, and for trace features considered jointly, the answer becomes increasingly difficult.
A general limitation with a leakage result derived from an approach attempting to quantify classifiability is that it cannot include any information contained in the a-priori distribution of the inputs. If the users of a web application follow a particular usage pattern, the leakage metric cannot incorporate this additional information.
s
1s
3a
b
o
a= 8kbob
= 10kbs
2ob
= 16kbo
a= 14kb1/2
1/2 1/2 1/2
1 2 1 2
a
b
Fig. 4. (Left) Our modified toy example, with strongly varying server response sizes for each input choice. (Right)
Visualisation of sampled data for our modified toy example. The samples corresponding to the different inputs are represented by light circles and squares, and the centroids are marked by the darker symbols.
appears at boths2 ands350% of the time, independently of the input choice made by the user. Therefore, the
traces produced when the user selects aare approximately 8000 bytes in size half the time, and 14000 bytes in size in the rest of the time. The traces produced as a result of bare 10000 and 16000 bytes in size respectively. The left-hand side of Figure 4 gives a visual representation of this modified application. The centroid of the traces corresponding toawill be approximately 10000 bytes, and forb, 12000 bytes.
The inter-class variance now will be significantly smaller than the intra-class variance, resulting in a Fisher criterion score significantly less than 1 (in fact, assuming 200 samples and low noise, approximately 0.1). A low Fisher criterion score is difficult to interpret meaningfully, and here could quite easily be interpreted as evidence for the sets of traces being indistinguishable. However, it is clear that an adversary observing a trace size close to one of the 4 possible values can always determine whether the user chose a orb. The right-hand side of Figure 4 indicates visually using hypothetical sampled data why the linear Fisher criterion metric fails to detect a leak. The samples corresponding to input aare represented by circles, and forb by squares. With this distribution of the outputs there is no way to linearly separate the two classes of samples. We can see straightforwardly that a similar failure to detect the leak will occur using the centroid-based entropy metric.
Similar situations to our toy example can occur in practice; any fixed-size object that randomly occurs in traces has a chance of creating non-linear cluster relationships. As a more subtle example, packet re-transmissions can result in trace sizes being increased by multiples of (approximately) a fixed amount. This can result in the distribution of trace sizes being only locally continuous; any underlying difference in the sizes of two traces has a good probability of being preserved despite the presence of the re-transmissions. In this situation, clusters of trace sizes will have non-linear relationships.
4
Mutual Information based Leakage Detection
We hope to have convinced the reader that there is little hope in finding a generically applicable metric through a quantification of feature classifiability. We hence advocate the use of a different approach all together. In what follows we assume the reader knows basic facts about information theory2.
The problem of inferring the input choices made by a user from within the set of all possible inputs bears a significant resemblance to the problem of the anonymity of a user within a set. Initial approaches for quantifying user anonymity assumed protocols were deterministic in nature, and used the concept of an anonymity set [2,7,17]. Since then, there has been a large body of research into the construction of metrics for quantifying anonymity. In particular, work has focused on information theoretic metrics capable of analysing probabilistic systems and the relationship between covert channel capacity and anonymity [11,20,21,22,26,33], with a smaller body of work investigating metrics based on combinatorics [13,15].
A definition of the coverage of a metric is important. Clauß and Schiffner generalised all entropy metrics (Shannon entropy, min-entropy, max-entropy) using Reyn´ı entropy, and established a division between global
2
metrics that assess the anonymity loss of a system and local metrics that assess the loss of anonymity for an individual user [10]. T´oth et al. analyse two entropy-based metrics and their applications in assessing local anonymity [29].
4.1 Using Mutual Information in the Context of Leakage Detection
Assuming the case of discrete random variables, the notation we will use in this paper is as follows. For random variables X and Y, the marginal probability mass function for X is defined as px = Pr{X = x}. The joint and conditional probability mass functions are similarly defined as px,y = Pr{X =x, Y = y} and px|y = Pr{X =x|Y =y}respectively.
We model the side-channel aspect of a web application as an information-theoretic channel; the set of secret user inputsAare considered as the channel input alphabet, and the observed featuresOas the channel output alphabet. The channel conditional probability distribution D = Pr{O = o|A = a} gives us the probability of a side-channel adversary seeing trace feature outputs for a given input choice. The mutual information I(A;O) =I(A;O) =H(A)−H(A|O) gives the average reduction in uncertainty about the application inputs Aafter the adversary has knowledge of the observable outputsO. IfAandOare independent, then the mutual information will be zero. WhenAis completely determined byO, the mutual information will be at its maximum value ofH(A).
Input distribution. To compute the mutual information we require a prior distribution for the secret inputs Pr{A=a}. To accurately estimate information leakage in a real-life scenario, a web application owner may wish to use an input distribution itself estimated from the usage habits of (possibly a subset of) the user population. For example, the medical conditions common for South American users of an international health application are likely to prove to be different for those from East Asian users; two leakage results using distributions calculated from both populations will be more informative and useful than one derived from a single, unrepresentative generic distribution.
Capacity. Alternatively, a worst-case estimate for the information leakage can be computed using thecapacity of the channel. In essence, the computation of the channel capacity finds the input distribution that leaks the most information across into the trace output distribution. The capacity is defined as follows:
C(D) = max
Pr{A}I(A;O).
Leakage Detection vs. Exploitation The relationship in general between side-channel information and
security is a very complex one. Standaert et al. study the relationship between conditional entropy and the success rates of an adversary in the context of side-channel key-recovery attacks [27], and come to the conclusion that in general, the relationship between the success of an adversary and the conditional entropy of a leakage distribution cannot be fully determined. In our web application context we face a similar problem; the exact structure of the leakage distribution is unknown to the designer as well as the adversary, and, without access to a computationally unbounded sampling phase, cannot be perfectly approximated. As a result we cannot make any definitive conclusions about the success rates of a Bayesian adversary directly from the mutual information or capacity of our application alone. In practice, to be able to concretely assess the true vulnerability of the application it becomes necessary that a leakage evaluation should always be complimented by a separate security evaluation of appropriately defined adversaries.
Finally we note that in our web application context, we are typically less concerned with information leaks for a particular instance of a secret input, and the input space is often very small. It therefore makes sense to evaluate web applications using aglobal security metric. In this context, a local metric such as min-entropy gives us the worst-case information leak for a particular input value, but does not give us any further information about the information revealed in the rest of the system. The Shannon entropy computes the average loss of information in the system, and hence is likely to be more suitable in capturing the application performance as a whole.
4.2 Leak Detection Testing Procedure
In practice, the leakage distribution D is unknown to the application designer, and has to be estimated by statistical sampling. When the web application has been sampled ntimes we obtain an estimated distribution
ˆ
Dn= ˆPr{O=o|A=a}. In turn, this means we are estimating the mutual information ˆIn(A;O), and similarly will produce an estimate of the capacity ˆCn( ˆDn). The variables we require or produce as part of a side-channel leakage quantification test are detailed in Table 1.
Table 1.Variables required and values computed during a test
A the web application input(s) we wish to assess for information leakage
O the set of trace features produced as a result of executing the web application with inputsA n the number of samples taken from the web application
ˆ
Dn= ˆPr{O=o|A=a}the conditional probability distribution estimated fromnsamples
ˆ
In(A;O) the estimated mutual information for the application inputs and features, usingnsamples
ˆ
Cn( ˆDn) the estimated capacity computed using the estimated conditional probability distribution
The quality of the estimation of the probability distribution D is now important, as it introduces a source of error into the estimation of the mutual information and capacity values. Several techniques exist for distribution estimation. The simplest non-parametric approach is the histogram technique; more complicated non-parametric techniques are kernel density estimation, vector quantization, and strategies based around clustering of the data. Parametric approaches under the presence of assumptions could improve the quality of the estimation, but are unlikely to be viable in this context. We note that the importance of the estimation quality here has two-fold implications. Assuming the selection of a suitable estimator, if a designer is unable to sample enough data to approximate the distribution sufficiently well in a particular amount of computational time, then any adversary bounded by the same level of computational power cannot either. This indicates the support size for a successful attack on a web application is a useful consideration.
In [6] Chatzikokolakis et al. find a confidence interval for the estimation of mutual information and capacity over a channel as outlined here. Let I = |A| and J = |O| be the sizes of the input and output domains. A result of their work is that when the true mutual information I(A;O) = 0, for large nthe value 2nIˆ(A;O) is approximately χ2 distributed with (I−1)(J −1) degrees of freedom, with a mean of (I−1)(J −1)/2n and
variance (I−1)(J−1)/2n2.
Alternatively, when I(A;O)>0 the estimate is instead approximately normally distributed, with a mean of I(A;O) + (I−1)(J−1)/2n+O(1/n2) and a variancev (see Theorem 6.1 in [6]). The approximate bias of the
estimator is (I−1)(J−1)/2n, and the authors show that the variance of the estimator in both the zero and non-zero cases is bounded above by IJ/n.
Defining the estimator result ase= ˆI(A;O), letpe= max(0, e−(I−1)(J−1)/2n) be the point estimate for the mutual information. Following Chatzikokolakis et al., if 2ne is inside the 95% confidence interval of the χ2((I−1)(J−1)) distribution then the confidence interval for the capacity or mutual information is:
0, pe+ 1.65√v ,
and if 2ne is outside the 95% confidence interval of the χ2((I−1)(J −1)) distribution then the confidence
interval is:
pe−1.96√v, pe+ 1.96√v,
where vis the variance of the estimated mutual information as defined previously.
A key point to make is that these particular confidence intervals are defined only in the case of discrete trace features. In the context of web applications, packet arrival times are likely to be the most common continuous feature containing useful side-channel information. For such continuous features, there are two options:
– Use bucketing strategies to treat the continuous data as discrete. Due to the data processing inequality3
under a bucketing strategy the mutual information estimate will be a lower bound on the true value. – Compute an estimate of the continuous mutual information4 (see Appendix A for a definition).
A cautionary note in the continuous case is that finding good estimators for mutual information is difficult; the optimal estimator is dependent on the (unknown) underlying structure of the data, and there is no universal rate of convergence of an estimator to the true value [24]. Chothia and Guha have devised a statistical hypothesis test for mutual information in the case of discrete inputs and continuous outputs by establishing a rate of convergence for the estimator in the case of zero mutual information [9]. Their result guarantees a good convergence rate in the case of two possible inputs only, but their test is demonstrated to show good performance in the case of multiple inputs.
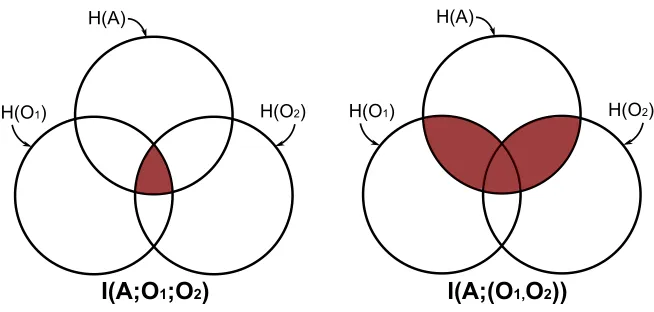
Multivariate extensions. If more than one feature is to be included in a leak quantification, then there are two options. Denoting the ithfeature asOi:
1. Compute the mutual information between the inputsAandntrace features considered jointly:I(A; (O1, . . . , On)); 2. Compute the multivariate mutual information between the inputsAandntrace features:I(A;O1;O2;. . .;On).
The definition of multivariate mutual information I(X;Y;Z) between the triple ensemble of three random variables X, Y and Z essentially describes the gain or loss of information from the set of two variables given knowledge of the third. The definition can be extended to any number of variables and is defined inductively using the definition of conditional mutual information. The conditional mutual informationI(X;Y|Z) considers the expected value ofI(X, Y) given the value ofZ. In terms of probability mass functions, it is defined as:
I(X;Y|Z) =EZ(I(X;Y|Z)) = X
z∈Z pzX
y∈Y X
x∈X
px,y|zlog px,y|z px|zpy|z
Multivariate mutual information is defined inductively using this conditional mutual information. For n+ 1 random variablesX1, . . . , Xn+1:
I(X1;. . .;Xn;Xn+1) =I(X1;. . .;Xn)−I(X1;. . .;Xn|Xn+1).
Figure 5 shows the relationship of these two approaches. Whilst both definitions of mutual information are equally viable, the interpretation of ‘true’ multivariate mutual information is perhaps less intuitive, is more computationally expensive to compute, and there is no result to our knowledge on bounding the estimate for multivariate mutual information. The alternative definition using the features considered jointly captures more information about the inputs, so with these properties in mind we suggest computing the mutual information between the application inputs and trace features considered jointly.
3I(f(X);g(Y))≤I(X;Y) for any random variablesX andY and any functionsf andgon the range ofX andY. 4
H(A)
H(O1) H(O2)
I(A;O
1;O
2)
I(A;(O
1,O
2))
H(A)
H(O1) H(O2)
Fig. 5.An information-theoretic representation of the two approaches for estimating leakage resulting from the consid-eration of two trace features.
5
The Leak Detection Test illustrated with an Example
Using our leakage metric proposal, in the following section we describe a leak detection test capable of identifying thepresence of many common information leaks.
LetP ={p1, . . . , pn}be a trace consisting ofnpackets sampled from a web application. Each trace is reduced to
a corresponding vector of featuresO={o1, . . . ,on}with eachoibeing a feature vector of lengthkrepresenting
the values of a set of kselected features considered jointly for the packetpiat positioniin the trace. Defining N as the length of the longest trace, we construct a setOi that contains the feature values at theithposition in
each of the sampled traces, fori∈ {1, . . . , N}. For example,O3might contain the set of sizes of the third packet
in each sampled trace. We then estimate the conditional probability distribution ˆDi(Oi, A) = ˆPr{Oi=o|A=a} of the selected packet features Oi at each possible position in a trace, for i ∈ {1, . . . , N}. Finally, using the estimated distributions we estimate mutual information values ˆvi = ˆI(A;Oi) between the application inputs A and the packet featuresOi. Using the test of Chatzikokolakis et al., we then compute corresponding 95% confidence intervals for zero and non-zero mutual information for each of thei∈ {1, . . . , N} estimates.
We identify leaks by checking the confidence intervals for zero mutual information: an estimated mutual in-formation value at positionithat falls outside of the 95% confidence interval for zero mutual information can be taken as evidence of an information leak at position i. A positive result at a particular position will not necessarily describe the true size of the information leak; a confidence interval for the point estimate of non-zero mutual information that is further away from the corresponding interval for zero mutual informationsuggests a larger information leak than a confidence interval for the point estimate that is closer to the confidence interval for zero mutual information, but does not guarantee it. Careful interpretation of the leak detection results is paramount, and a security analysis to complement an information-theoretic analysis is always recommended.
A common example of a detectable information leak in practice occurs when two subsets of the application inputs each redirect the user to a differently sized web page. The leak detection test will identify the information leak towards theend of the subsection of the trace that corresponds to the server response; given the sequence of packets that correspond to the server returning the new web page, the initial packets are all likely to be equivalent in size, typically of the maximum segment size (MSS) for the TCP session, but the length of the sequence is likely to be longer, or the final packet larger, for the larger web page.
in the sequence. The choice that leads to the larger web page results in extra packets being downloaded, and as a result a larger amount of acknowledgement packets are present in traces for that choice. A conclusion to draw here is that in this circumstance, an information leak is present that does not take into account packet sizes at all, illustrating that the depth of potential side-channel attacks on web applications extends beyond an analysis of packet sizes.
0 10 20 30 40 50 60
0 0.2 0.4 0.6 0.8 1
Index of packet in sequence
E
st
imat
ed
mut
ual
inf
ormat
ion
Leak detection results analysing the distribution of TCP ACK packets
0 10 20 30 40 50 60
0 0.2 0.4 0.6 0.8 1
Index of packet in sequence
E
st
imat
ed
mut
ual
inf
ormat
ion
Leak detection results analysing the distribution of packet sizes
CI for non−zero leakage CI for zero leakage Input entropy
Fig. 6.Mutual information estimates at each index in a sequence of packets, (left) using the presence of a TCP acknowl-edgement flag as a packet feature, and (right) using the packet size as a packet feature. There are two possible inputs to the application at this state, with the maximum entropy for these two inputs represented by the horizontal line.
Multivariate extensions. It is possible that a detection test considering additional packet positions jointly (estimating I(A;Oi, . . . , Oj)) may detect an information leak that a univariate test could not: I(A;Oi) = 0 and I(A;Oj) = 0, but I(A;Oi, . . . , Oj) > 0. The identification and selection of the additional positions is a non-trivial task that will typically require additional domain knowledge from the designer. An exhaustive multivariate test is computationally feasible when considering the joint distribution of a small number of packet positions; for instance. given a trace of lengthn, we can check all possible pairs of packets inO(n2) time.
A second consideration is whether a combination of packet features (e.g. combining packet size and direction) could result in the identification of an information leak that would not be detected by an individual analysis of packet size and direction. Again, additional knowledge from the designer is likely to be required in identification of appropriate feature combinations, but the cardinality of the set of possible packet features is not particularly large; perhaps in the order of 10 or so, and the combination of some of these features will not always make sense, so it may be possible to exhaustively search the joint feature space. A general benefit of mutual information as our proposed metric choice is that it extends quite naturally into the multivariate setting and is applicable in these sorts of scenarios, whereas other metrics are not necessarily quite as easily extended.
6
Using the Test in the Presence of Countermeasures
hence potentially at a smaller cost in overhead. In Table 2 we provide a tabular representation of some of the most popular transport and application-layer countermeasures as considered in the research community and the packet/trace features affected most by the countermeasure. A more detailed discussion of the effectiveness of the countermeasures is beyond the scope of this paper, but can be found in the referenced publications.
Countermeasure OSI Layer Main features affected
HTTP header padding[19,28] Application Packet sizes, no. of packets HTTP Range property[19,28] Application Packet sizes, no. of packets HTTP Pipelining[19,28] Application No. of packets, web object sizes Injecting useless requests[19] Application No. of packets, trace size
Background loading of random page[23,28] Application No. of packets, packet sizes & timings Object prefetching[28,31] Application No. of packets, trace size
TLS/IPSec padding[12] Presentation/Network Packet sizes
Direct traffic sampling[30] Transport No. of packets, packet sizes & timings Traffic morphing[28,30] Transport No. of packets, packet sizes & timings Extending TCP Option field[19,12] Transport Packet sizes
TCP Maximum Segment Size (MSS) renegotiation[19] Transport Packet sizes, no. of packets TCP advertising window[19] Transport Packet sizes, no. of packets Forced TCP retransmissions[19] Transport No. of packets, web object size Delaying requests and ACK responses[19] Transport Packet arrival times
Table 2. Proposed transport and application-layer countermeasures for mitigation of side-channel attacks on web
applications and website fingerprinting attacks
In the following section we demonstrate the usefulness of applying our quantification metric and leak detection strategy in an analysis of countermeasure effectiveness, using our online health application example. We use our metric to detect and quantify the information leaked through packet sizes in the presence of frequently proposed countermeasures. Our aim is not to provide a comprehensive analysis of every plausible countermeasure; rather we demonstrate the applicability of our strategy in general.
Several countermeasures require modifying traffic emanating from the host web server, and so we are unable to directly apply those countermeasures when testing live web applications we do not control. Additionally, the applicability of several countermeasures is dependent on the particular web server software hosting the application. As a result, and as we are not attempting an exhaustive comparison of all countermeasures, we constructed two distinct countermeasures that mitigate information leaks within packet sizes, and simulated their application on real sampled data. The following list outlines our choices and our approach for their simulation:
– Individual packet padding: for each captured packet, we artificially increase its size. The size can be increased by a random amount, or can be fixed to a pre-determined amount. In practice, the random strategy can be achieved by padding the TCP options field uniformly at random, by re-negotiating the TCP maximum segment size (MSS) for a session, or by randomly increasing the size of requests and responses at the application layer. The fixed-sized strategy is more difficult to apply in practice, but is an interesting option for comparison. We simulate both approaches on our sampled packets: in the random approach, we retrieve the TCP header and randomly add bytes to the option field, and in the fixed-size approach we artificially increase the packet size to the Ethernet Maximum Transmission Unit (MTU) size. Intuitively, this countermeasure can be expected to ‘shrink’ the vector of mutual information estimates, but is limited by being restricted to modifying packets that are present only.
– Insertion of fixed-size dummy packets: for each sampled trace, we insert a random amount of
randomly-sized data in response traffic. The expected effect on our traces should again be to shrink the vector of estimates, by in some sense shuffling the order of the packets within a trace.
To aid in an analysis of their efficiency, the effects of these two countermeasures are deliberately intended not to overlap. The first countermeasure affects traces in the vertical direction, by distorting the properties of individual packets, and the second acts in the horizontal direction by diffusing the distributions at each packet position across into neighbouring positions. In reality, the most effective side-channel countermeasure is likely to be one that affects traces in both these ways. Exempting the case of object pre-fetching, all countermeasures designed to effect leaks resulting from the size of an object within a trace can clearly onlyincrease the size of a trace. Since the majority of such leaks are likely to result from systematic differences in the total size of the server response, countermeasures have the choice of making the distributions of the responses indistinguishable by attempting to make the response sizes the same, or by attempting to make the response sizes sufficiently random. The application of our simulated dummy packet countermeasure follows the latter paradigm; by inserting a random number of packets into the trace in the appropriate locations, the countermeasure attempts to make the size distributions under each input less distinguishable.
6.1 Results with regards to Countermeasures
We tested the same online health application state we used to describe our leak detection test previously, and consider a scenario in which a user connects to the application using a normal Internet connection protected only by HTTPS, with the adversary able to capture packets at the transport-layer (the adversary can ‘see’ TCP and TLS headers). To test the application, we sampled the state repeatedly using automated browser testing software called Selenium [25], and captured packets using a native pcap library. We first ran our leak detection test without any countermeasures applied, using packet sizes as a feature. The results are shown in the right-hand side of Figure 6. An analysis indicates that there are two leak sources present that result from information contained in packet sizes: the size of the first packet, sent by the client, is extremely distinguishing, and the server response towards the middle of the trace is also strongly distinguishing.
Figure 7 shows the results of our leak detection test re-run in the presence of our four countermeasures applied individually, and Table 3 gives the mean increase in size of the sampled traces as a result of the application of each countermeasure.
Table 3.The average size increase of captured traces in the presence of the four considered countermeasures.
Countermeasure Mean size overhead (%)
Randomly padding TCP option field 1.2
Padding each packet to the Ethernet II MTU size 95.4 Randomly inserting 10-15 dummy packets into all traces 48.1 Joint combination of insertion and random padding strategies 49.9
0 10 20 30 40 50 60 0 0.2 0.4 0.6 0.8 1
Index of packet in sequence
E st imat ed mut ual inf ormat ion
Randomly padding each packet by up to 40 bytes
0 10 20 30 40 50 60
0 0.2 0.4 0.6 0.8 1
Index of packet in sequence
E st imat ed mut ual inf ormat ion
Padding each packet to a fixed size
0 10 20 30 40 50 60 70 80 0 0.2 0.4 0.6 0.8 1
Index of packet in sequence
E st imat ed mut ual inf ormat ion
10−15 dummy packets inserted into server response
0 10 20 30 40 50 60 70 80 0 0.2 0.4 0.6 0.8 1
Index of packet in sequence
E st imat ed mut ual inf ormat ion
Combination of dummy−packet insertion and random packet−padding
CI for non−zero leakage CI for zero leakage Input entropy
Fig. 7. Leak detection results analysing the distribution of the sequence of packet sizes, in the presence of (top-left) randomly padding the TCP option field, (top-right) padding each packet to the Ethernet MTU, (bottom-left) adding randomly-sized dummy packets to the server response and (bottom-right) combining dummy packet insertion and random individual packet padding strategies
To simulate the fixed-sized packet-padding approach, we artificially set the size of each packet to the Ethernet II MTU of 1500 bytes. This countermeasure has a much larger overhead than the padding of TCP option fields (95.4% to 1.2%), but eliminates the information leak contained in the first packet and from the server response packets in the middle of the sequence. Again, the individual packet padding strategy employed here suffers from being unable to disguise the longer traces for one of the inputs, and so the end few positions of the packet sequence show a significant information leak.
Modifying the server response by adding between 10 and 15 dummy packets into the trace has a noticeable reductive effect on the size of the leak. An increased amount of the point estimates are now within the 95% confidence intervals for zero information leakage. However, in the middle and towards the end of the trace we can see that there are still packet positions with estimates noticeably outside of the interval for zero information leakage. A conclusion to draw in this scenario is that the number of packets randomly inserted is both insufficient for nullifying the leak in the middle of the trace, and for nullifying the effect of the larger server response producing longer traces.
with these results and with the results from a separate security analysis. Whilst the translation of our particular simulated countermeasures into a practical implementation is not straightforward, these results are indicative of how our detection test can be used to analyse the effectiveness of noise-based side-channel countermeasures.
7
Conclusion
We have discussed the challenges involved in the detection (and quantification) of information leaks in the context of side-channel attacks on web applications, and focused on dissimilarities between evaluating the strength of an adversary and quantifying the strength of an information leak. In our approach we consider a web application as an information theoretic channel, with the application inputs considered as the channel inputs, and features extracted from network traces as the channel outputs. Under this model, we have proposed using an estimate of the mutual information or capacity of the channel as a metric for detecting instances of information leakage in a web application. Our approach has the benefit of a degree of statistical rigour, can cope with non-deterministic traces, and does not require application-specific distance metrics or thresholds for classifications.
We use our proposal to construct a leak detection test for the identification of information leaks, and present an example application of it in analysing potential side-channel analysis countermeasures using a popular online health website. The leak detection test outlined here will aid in the automatic detection of the majority of information leaks from web applications. To accurately quantify the size and implications of the information leak detected by the test, additional domain knowledge from the application designer is likely to be required. An interesting research challenge is to construct methods that detect leaks by mechanically and efficiently analysing combinations of features and packet positions over the entire feature space. This problem is very similar to the challenge of feature extraction considered in the field of machine learning, and so further research in this direction may yield useful results.
Acknowledgements This work has been supported in part by EPSRC via grant EP/I005226/1, and by the
European Commission through the ICT Programme under Contract ICT2007216676 ECRYPT II.
References
1. Suguru Arimoto. An algorithm for computing the capacity of arbitrary memoryless channels. IEEE Transactions on Information Theory, 18(1):14–20, 1972.
2. Oliver Berthold, Andreas Pfitzmann, and Ronny Standtke. The Disadvantages of Free MIX Routes and how to Overcome Them. InWorkshop on Design Issues in Anonymity and Unobservability, pages 30–45, 2000.
3. George Dean Bissias, Marc Liberatore, David Jensen, and Brian Neil Levine. Privacy Vulnerabilities in Encrypted HTTP Streams. InPrivacy Enhancing Technologies, pages 1–11, 2005.
4. Richard E. Blahut. Computation of channel capacity and rate distortion functions. IEEE Transactions on Infor-mation Theory, 18(4):460–473, 1972.
5. Peter Chapman and David Evans. Automated Black-Box Detection of Side-Channel Vulnerabilities in Web Appli-cations. InACM Conference on Computer and Communications Security, pages 263–274, 2011.
6. Konstantinos Chatzikokolakis, Tom Chothia, and Apratim Guha. Statistical Measurement of Information Leakage. InTACAS, pages 390–404, 2010.
7. David Chaum. The Dining Cryptographers Problem: Unconditional Sender and Recipient Untraceability. J. Cryp-tology, 1(1):65–75, 1988.
8. Shuo Chen, Rui Wang, XiaoFeng Wang, and Kehuan Zhang. Side-Channel Leaks in Web Applications: A Reality Today, a Challenge Tomorrow. InProceedings of IEEE Symposium on Security and Privacy, 31st IEEE Symposium on Security and Privacy, pages 191–206. IEEE Computer Society, 2010.
9. Tom Chothia and Apratim Guha. A Statistical Test for Information Leaks Using Continuous Mutual Information. InCSF, pages 177–190, 2011.
11. Claudia D´ıaz, Stefaan Seys, Joris Claessens, and Bart Preneel. Towards Measuring Anonymity. InPrivacy Enhancing Technologies, pages 54–68, 2002.
12. Kevin Dyer, Scott Coull, Thomas Ristenpart, and Thomas Shrimpton. Peek-a-Boo, I Still See You: Why Traffic Analysis Countermeasures Fail. InIEEE Security and Privacy, 2012.
13. Matthew Edman, Fikret Sivrikaya, and B¨ulent Yener. A Combinatorial Approach to Measuring Anonymity. InISI, pages 356–363, 2007.
14. Ronald A. Fisher. The Use of Multiple Measures In Taxonomic Problems. Annals of Eugenics, 1936.
15. Benedikt Gierlichs, Carmela Troncoso, Claudia D´ıaz, Bart Preneel, and Ingrid Verbauwhede. Revisiting a combina-torial approach toward measuring anonymity. InWPES, pages 111–116, 2008.
16. Dominik Herrmann, Rolf Wendolsky, and Hannes Federrath. Website fingerprinting: attacking popular privacy enhancing technologies with the multinomial na¨ıve-bayes classifier. InCCSW, pages 31–42, 2009.
17. Dogan Kesdogan, Jan Egner, and Roland B¨uschkes. Stop-and-Go-MIXes Providing Probabilistic Anonymity in an Open System. InInformation Hiding, pages 83–98, 1998.
18. Marc Liberatore and Brian Neil Levine. Inferring the source of encrypted HTTP connections. InACM Conference on Computer and Communications Security, pages 255–263, 2006.
19. Xiapu Luo, Peng Zhou, Edmond W. W. Chan, Wenke Lee, Rocky K. C. Chang, and Roberto Perdisci. HTTPOS: Sealing Information Leaks with Browser-side Obfuscation of Encrypted Flows. InNDSS, 2011.
20. Ira S. Moskowitz, Richard E. Newman, Daniel P. Crepeau, and Allen R. Miller. Covert channels and anonymizing networks. InWPES, pages 79–88, 2003.
21. Ira S. Moskowitz, Richard E. Newman, and Paul Syverson. Quasi-anonymous channels. InIASTED CNIS, pages 126–131, 2003.
22. Richard E. Newman, Vipan R. Nalla, and Ira S. Moskowitz. Anonymity and Covert Channels in Simple Timed Mix-Firewalls. InPrivacy Enhancing Technologies, pages 1–16, 2004.
23. Andriy Panchenko, Lukas Niessen, Andreas Zinnen, and Thomas Engel. Website Fingerprinting in Onion Routing Based Anonymization Networks. InWPES, 2011.
24. Liam Paninski. Estimation of Entropy and Mutual Information. Neural Computation, 15(6):1191–1253, 2003. 25. Selenium. Selenium remote control.http://seleniumhq.org, 2004-2012.
26. Andrei Serjantov and George Danezis. Towards an Information Theoretic Metric for Anonymity. In Privacy Enhancing Technologies, pages 41–53, 2002.
27. Fran¸cois-Xavier Standaert, Tal Malkin, and Moti Yung. A Unified Framework for the Analysis of Side-Channel Key Recovery Attacks. InEUROCRYPT, pages 443–461, 2009.
28. Qixiang Sun, Daniel R. Simon, Yi-Min Wang, Wilf Russell, Venkata N. Padmanabhan, and Lili Qiu. Statistical Identification of Encrypted Web Browsing Traffic. InIEEE Symposium on Security and Privacy, pages 19–30, 2002. 29. Gergely T´oth, Zolt´an Horn´ak, and Ferenc Vajda. Measuring anonymity revisited. InProceedings of the Ninth Nordic
Workshop on Secure IT Systems, pages 85–90, 2004.
30. Charles V. Wright, Scott E. Coull, and Fabian Monrose. Traffic Morphing: An Efficient Defense Against Statistical Traffic Analysis. InNDSS, 2009.
31. Shui Yu, Theerasak Thapngam, Su Wei, and Wanlei Zhou. Efficient Web Browsing with Perfect Anonymity Using Page Prefetching. InICA3PP (1), pages 1–12, 2010.
32. Kehuan Zhang, Zhou Li, Rui Wang, XiaoFeng Wang, and Shuo Chen. Sidebuster: Automated Detection and Quantification of Side-Channel Leaks in Web Application Development. In ACM Conference on Computer and Communications Security, pages 595–606, 2010.
33. Ye Zhu and Riccardo Bettati. Anonymity vs. Information Leakage in Anonymity Systems. InICDCS, pages 514–524, 2005.
A
Basic information theory
Assuming the case of discrete random variables, the notation we will use in this paper is as follows. For random variables X and Y, the marginal probability mass function for X is defined as px = Pr{X = x}. The joint and conditional probability mass functions are similarly defined as px,y = Pr{X =x, Y = y} and px|y = Pr{X =x|Y =y}respectively.
Shannon entropy. LetX and Y be two discrete random variables, supported onX andY respectively. The
Shannon entropy ofX is defined as theaverage uncertainty aboutX. Mathematically it is defined as:
H(X) =−X x∈X
and when the logarithm is taken with base 2 measures the remaining uncertainty about X in bits. The con-ditional entropy H(X|Y) gives the remaining average uncertainty about the variableX when the valueY has taken is known, and is defined similarly as
H(X|Y) =−X y∈Y
Pr{Y =y}X x∈X
Pr{X =x|Y =y}log Pr{X=x|Y =y}.
Mutual information. The mutual information I(X;Y) betweenX andY computes the information gained
aboutX if we observeY, and is related to the marginal and conditional entropies as follows:
I(X;Y) =H(X)−H(X|Y).
If X and Y are independent, then the mutual information will be zero. When X is completely determined by Y, the mutual information will be at its maximum value ofH(X).
Channels. An information-theoretic channel takes inputs from an input alphabet X and sends across the
channel outputs from a set of channel outputsY. The channel itself is described by the probability distribution Q, where Q(y|x) = Pr{Y = y|X = x} gives the probability of seeing a particular output given a particular input. The mutual informationI(X;Y) describes the amount of information that can be sent over the channel. Contextually this gives us the average amount of side-channel information available to an adversary.
Note that the input probability distribution affects the mutual information result. Hence, the worst-case in-formation leakage occurs when the amount of inin-formation sent over the channel is maximised. The channel capacity is defined as the mutual information of the channel maximised over all possible input distributions:
Capacity(Q) = max
Pr{X}I(X;Y).
The capacity can be approximated to within a specified error using the iterative Blahut-Arimoto algorithm [1,4].
Other definitions of entropy. The Shannon entropy as described above gives theaverageuncertainty about a random variable; however alternative definitions exist. The min-entropy, defined asH∞(X) =−log maxx∈XPr{X= x}, gives the amount of uncertainty needed to be overcome to be able to identify the most likely element only. Shannon entropy and min-entropy are both specific instances of Reyn´ı entropy:
Hα(X) = 1 1−αlog
X
x∈X
Pr{X =x}α !
.
Intuitively, we can see that ifα= 1, then Reyn´ı entropy is equivalent to Shannon entropy, and asαapproaches infinity, Reyn´ı entropy tends to min-entropy. One can also see that increasing the parameter α can aid in eliminating outliers from the entropy calculation. Clauß and Schiffner discuss the applicability of these metrics in anonymity-scenarios in [10].
Continuous mutual information. In the context of discrete inputs and continuous outputs we require a
slightly different construction for mutual information. For a discrete random variable X and a continuous random variableY, the equation for mutual information becomes
I(X;Y) = X x∈X Z
Y
p(x, y) log
p(x, y) p(x)p(y)