Page 1 of 11
Predicting pathological complete response in rectal cancer
after chemoradiotherapy with a random forest using
18
F-fluorodeoxyglucose positron emission tomography and
computed tomography radiomics
Wei-Chih Shen1,2, Shang-Wen Chen2,3,4,5#, Kuo-Chen Wu2,6, Peng-Yi Lee3,7, Chun-Lung Feng8, Te-Chun Hsieh9,10, Kuo-Yang Yen9,10, Chia-Hung Kao2,9,11,12#
1Department of Computer Science and Information Engineering, Asia University, Taichung; 2Center of Augmented Intelligence in Healthcare, 3Department of Radiation Oncology, China Medical University Hospital, Taichung; 4School of Medicine, College of Medicine, China Medical University,
Taichung; 5Department of Radiology, School of Medicine, College of Medicine, Taipei Medical University, Taipei; 6Department of Computer Science and
Engineering, National Chung Hsing University, Taichung; 7Department of Radiation Oncology, China Medical University Hospital, Yunlin; 8Division of
Hepato-Gastroenterology, Department of Internal Medicine, 9Department of Nuclear Medicine and PET Center, China Medical University Hospital,
Taichung; 10Department of Biomedical Imaging and Radiological Science, 11Graduate Institute of Biomedical Sciences, School of Medicine, College of
Medicine, China Medical University, Taichung; 12Department of Bioinformatics and Medical Engineering, Asia University, Taichung
Contributions: (I) Conception and design: SW Chen, WC Shen, CH Kao; (II) Administrative support: CH Kao; (III) Provision of study materials or patients: All authors; (IV) Collection and assembly of data: All authors; (V) Data analysis and interpretation: SW Chen, WC Shen, CH Kao; (VI) Manuscript writing: All authors; (VII) Final approval of manuscript: All authors.
#These authors contributed equally to this work.
Correspondence to: Chia-Hung Kao, MD. Graduate Institute of Biomedical Sciences, School of Medicine, College of Medicine, College of Medicine, China Medical University, No. 2, Yuh-Der Road, Taichung 404. Email: d10040@mail.cmuh.org.tw; dr.kaochiahung@gmail.com.
Background: Neoadjuvant chemoradiotherapy (NCRT) followed by surgery is the standard treatment for patients with locally advanced rectal cancer. This study developed a random forest (RF) model to predict pathological complete response (pCR) based on radiomics derived from baseline 18F-fluorodeoxyglucose ([18F] FDG)-positron emission tomography (PET)/computed tomography (CT).
Methods: This study included 169 patients with newly diagnosed rectal cancer. All patients received 18F[FDG]-PET/CT, NCRT, and surgery. In total, 68 radiomic features were extracted from the metabolic tumor volume. The numbers of splits in a decision tree and trees in an RF were determined based on their effects on predictive performance. Receiver operating characteristic curve analysis was performed to evaluate predictive performance and ascertain the optimal threshold for maximizing prediction accuracy.
Results: After NCRT, 22 patients (13%) achieved pCR, and 42 features that could differentiate tumors with pCR were used to construct the RF model. Six decision trees and seven splits were suitable. Accordingly, the sensitivity, specificity, positive predictive value, negative predictive value, and accuracy were 81.8%, 97.3%, 81.8%, 97.3%, and 95.3%, respectively.
Conclusions: By using an RF, we determined that radiomics derived from baseline 18F[FDG]-PET/CT could accurately predict pCR in patients with rectal cancer. Highly accurate and predictive values can be achieved but should be externally validated.
Keywords:18F-fluorodeoxyglucose ([18F]FDG); positron emission tomography (PET); computed tomography
(CT); rectal cancer; radiomics; pathological complete response; random forest (RF); machine learning; artificial intelligence
Submitted Nov 06, 2019. Accepted for publication Dec 27, 2019. doi: 10.21037/atm.2020.01.107
Introduction
Neoadjuvant chemoradiotherapy (NCRT) followed by total mesorectal excision (TME) is the standard treatment for locally advanced rectal carcinoma (1,2). Responses to NCRT are diverse, with a study reporting that 15–27% of patients achieved pathological complete response (pCR), 54–75% of patients achieved partial response, and others exhibited no response (3). Patients who achieved pCR have favorable long-term outcomes regardless of their initial T and N stages (3-5). Therefore, predicting tumor responses to NCRT before treatment may considerably affect patient care. Studies have advocated a “wait-and-see” policy for such patients because complete responders can avoid surgical morbidity and mortality (6-8). However, the feasibility of this approach depends on robust biomarkers for pCR. Several imaging modalities are used for staging and monitoring responses to NCRT in patients with rectal cancer. Two studies combining artificial intelligence (AI) with radiomic features derived from magnetic resonance imaging (MRI) or computed tomography (CT) after NCRT have demonstrated this approach to exhibit superior predictive performance in terms of pCR (9,10).
Several studies have used 18F-fluorodeoxyglucose ([18F] FDG)-positron emission tomography (PET)/CT imaging to predict tumor responses in patients with rectal cancer (11-15). Early changes in glucose metabolic parameters, such as the maximum standardized uptake value (SUVmax), assessed using sequential [18F]FDG-PET/CT during NCRT could predict responses to therapy (12,14). In particular, the reassessment of stages through [18F]FDG-PET/CT after NCRT can be beneficial for grouping outcomes. Currently, conventional [18F]FDG-PET/CT is not sufficiently accurate for safely selecting patients for organ-sparing strategies (16). Radiomic features derived from [18F]FDG-PET/CT have been applied for predicting responses to NCRT in patients with rectal cancer (17,18). Although radiomics in such studies have been associated with survival, none of the extracted features could effectively predict pCR.
A random forest (RF) is a powerful AI technique proposed by Breiman (19) and used for classification and regression. It consists of a set of binary decision trees and provides a framework for assessing the importance of input variables in predicting outcomes. In contrast to other machine-learning methods such as logistic regression and support vector machines, RFs can minimize the likelihood of overfitting (19) and manage datasets containing more variables than observations. These characteristics enable
the selection of variables based on their effects on outcome predictions. By using this method, we hypothesized that baseline radiomics derived from [18F]FDG-PET/CT could predict radiotherapy-based responses considering radiomics as potentially effective biomarkers (20). Because RFs have yet to be used to predict pCR after NCRT in patients with rectal cancer, this study applied this tool to assess the performance of radiomic features derived from [18 F]FDG-PET/CT for this endpoint.
Methods
Study design and patient population
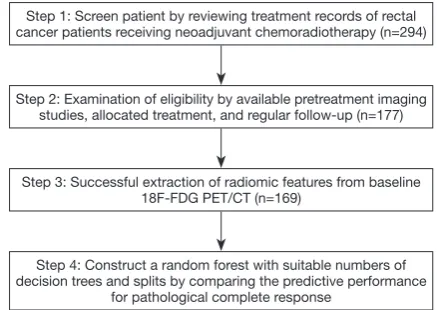
Figure 1 illustrates the flowchart of patient selection and
the study design. This retrospective study analyzed patients with newly diagnosed rectal cancer who were scheduled to undergo curative NCRT followed by surgical procedures at China Medical University Hospital between January 2009 and July 2016. All patients had biopsy-proven rectal adenocarcinoma. No tumors with mucinous or signet ring carcinomas were included in this cohort. This study was approved by our local institutional review board (certificate numbers: CMUH102-REC2-74 and DMR99-IRB-010-1).
NCRT
Combination drugs in all NCRT regimens were based on capecitabine, uracil-tegafur, or intravenous 5-fluorouracil. All patients were treated with intensity-modulated radiotherapy consisting of seven coplanar fields with 10-MV photons. The total dose applied to the pelvis was 45 Gy administered in 25 fractions over 5 weeks. The gross tumor and metastatic pelvic lymph nodes were boosted by applying a dose of 5.4 Gy divided into 3 fractions. Although not yet a standard treatment, intensity-modulated radiotherapy may help reduce treatment-related toxicities without compromising response rates (21).
Pathological assessment
PET/CT image acquisition
Patients received PET/CT for pretreatment staging and subsequently underwent primary tumor resection. Patients fasted for at least 4 h prior to [18F]FDG-PET/CT imaging to minimize the effect of serum glucose levels on acquired images. Images were captured using a PET/CT scanner (PET/CT-16 slice, Discovery STE, GE Medical System, Milwaukee, WI, USA) approximately 60 min after 370 MBq of [18F]FDG was administered to patients. Patients were requested to rest during the uptake period. PET/ CT commenced with the acquisition of a CT topogram to define the axial examination range. PET images were acquired after CT scans at 2 min per field of view (FOV) in the three-dimensional (3D) acquisition mode with an 11-slice overlap at the FOV borders. The CT images were reconstructed onto a 512×512 matrix and converted into a 128×128 matrix, yielding 511-keV-equivalent attenuation factors for correcting the attenuation of the corresponding PET images. The PET images were then reconstructed through iterative algorithms (3D ordered-subset expectation maximization, 20 iterations, 2 ordered-subsets) for attenuation correction using a 3.27-mm transaxial slice thickness covering the head to the upper thighs for further interpretation. A 3-mm full width at half maximum Gaussian filter was applied after reconstruction. Thematrix size was 128 voxels × 128 voxels × length of interest, and the voxel size was 5.47×5.47×3.27 mm3.
The [18F]FDG-PET data were input into Advantage Workstation (Ver. 4.4, GE Healthcare), and images were reviewed to localize target lesions. The derived results were confirmed by two nuclear medicine physicians. The PET/ CT workstation enabled quantifying [18F]FDG uptake for
SUV. This procedure was detailed in our previous report (23).
Radiomic analysis
The local maximum within a user-specific volume of interest (VOI) was detected according to the relationship between each voxel and adjacent voxels in terms of SUVs. The local maximum corresponding to the highest SUV within the spatial extent of a rectal tumor was manually identified by the nuclear medicine physicians and defined as SUVmax. Metabolic tumor volume (MTV) was defined using a relative threshold of SUVmax, namely SUVmax ×0.4. Although this method can lead to underestimation of functional volumes, we found that it could minimize the probability of connection between the extracted MTV and the adjacent organ. This approach was applied by Brooks (24). All voxels within the VOI and with an SUV greater than or equal to the threshold were identified and grouped on the basis of voxel connectivity. If the tumor and adjacent anatomic structures were incorrectly classified in a group, a watershed algorithm was employed to separate them. The group containing SUVmax was defined as the MTV of the rectal tumor.
The software used for feature extraction was developed in-house (23) and verified using open-source software. For each rectal tumor, 68 radiomics, including classical PET-related and texture features, were extracted from the MTV (Table S1). The classical PET features were approximately classified into two groups: descriptive features characterizing the SUV distribution and total-lesion-glycolysis-related features reflecting MTV activity. To calculate probability-based features, SUVs within the MTV were discretized using a fixed bin measuring 0.001 g/mL wide. The occurrence probability of each discretized SUV was calculated and used to derive entropy, energy, and diversity. In addition, to calculate texture features, SUVs within the MTV were discretized using a fixed number of 20 bins. Four textural matrices, namely the gray-level co-occurrence matrix (GLCM) (25), neighboring gray-level dependence matrix (NGLDM) (26), gray-level run-length matrix (GLRLM) (27), and gray-level size zone matrix (GLSZM) (28), were calculated to describe the heterogeneity of the discretized SUVs within the MTV. In total, 21, 5, 11, and 11 texture features were derived from the GLCM, NGLDM, GLRLM, and GLSZM, respectively. For each feature defined in the GLCM and GLRLM, the maximum measurement in all possible directions was regarded as the final measurement.
Step 1: Screen patient by reviewing treatment records of rectal cancer patients receiving neoadjuvant chemoradiotherapy (n=294)
Step 2: Examination of eligibility by available pretreatment imaging studies, allocated treatment, and regular follow-up (n=177)
Step 3: Successful extraction of radiomic features from baseline 18F-FDG PET/CT (n=169)
Step 4: Construct a random forest with suitable numbers of decision trees and splits by comparing the predictive performance
[image:3.595.55.274.84.239.2]for pathological complete response
RF training to estimate pCR probability
An RF model was constructed using bootstrap aggregation by individually training and aggregating decision trees. To train a decision tree, a bootstrap was obtained by randomly sampling N tumors with replacements from all enrolled tumors. Approximately one-third of the tumors were not included in the acquired bootstrap, reflecting the similar effect of cross-validation (19). During training, the bootstrap was recursively dichotomized by a set of decision splits. At each split, a set of features was randomly selected from all features as a group of candidates to maximize the dissimilarity between the constructed trees. The candidate achieving the highest impurity reduction after dichotomization was adopted as the split. By default, the splitting process was halted when impurity could not be further reduced. To avoid overfitting, a threshold was limited the maximum number of splits and simplified the constructed tree. In addition, the RF model required a threshold for the number of decision trees. Therefore, the constructed RF model was denoted as RFsplits,trees to indicate the defined threshold settings.
The probability of pCR for a tumor was estimated on the basis of the relative proportion of tumors with pCR in the leaf. After training a decision tree, each tumor in the bootstrap was classified to a leaf in accordance with the criteria in the internal nodes. Thus, for a leaf, the probability of pCR could be estimated on the basis of the relative proportion of tumors with pCR in that leaf. For example, if a leaf has six and four tumors with and without pCR, respectively, the probability of pCR for that leaf would be 6/10. Conventionally, a leaf was designated to a specific event as all or none in accordance with the highest probability. However, the events in the studied patients were not well balanced; a tumor tended to predict a negative pCR when the cutoff probability was set to 0.5. To minimize the likelihood of an inappropriate cutoff, the probabilities in all leaves were preserved for later calibration. Subsequently, the overall prediction probability of the adopted RF model was acquired by averaging the individual prediction probability of all decision trees. This forest-based prediction probability can considerably improve sensitivity in pCR detection using a calibrated cutoff.
Feature selection for RF construction
This study established a robust prediction model with satisfactory performance by using a minimal set of features.
In general, the performance of an RF is negatively associated with the similarity among the contained decision trees (18). Hence, in this study, the candidates of a split were randomly selected from all features to increase the dissimilarity among the decision trees. However, random selection can weaken a decision tree (19) because selected candidates might inaccurately predict pCR. Thus, feature selection was employed on the basis of relevant features for differentiating tumor pCR.
Statistical analysis
A receiver operating characteristic (ROC) curve analysis was performed to evaluate classification performance and ascertain the optimal threshold for maximizing prediction accuracy. The area under the ROC curve (AUC) was used to assess the difference between two or more RFs in predicting pCR. The difference between the two AUCs was examined using the method described by DeLong
et al. (29). An analysis of variance (ANOVA) was employed
to assess the difference in predictive performance between RFs constructed using different settings. A homogeneous subset was produced through post hoc tests to determine appropriate parameter settings for an RF. For each
RFsplits,trees, a set of pCR probabilities was derived from all studied tumors. The predictive performance of RFsplits,trees was evaluated by comparing the probabilities of tumors with and without pCR. Predictive indices were sensitivity (SE), specificity (SP), positive predictive value (PPV), negative predictive value (NPV), and accuracy. Statistical analysis was performed using MedCalc 18.2.1 or PASW 18.
Results
Patient characteristics
(61 patients), or lower third (64 patients) of the rectum. The median age was 59 years (range, 32–85 years); 115 patients were men, and 54 were women. The median interval from NCRT completion to surgery was 55 days. In total, 22 patients (13%) achieved a TRG4 response in the pathological specimen, and their tumors were classified as achieving pCR to NCRT.
Feature selection for RF construction
ROC curve analysis revealed that of the 68 extracted features, 42 could differentiate tumors on the basis of pCR (Table S1). Of these 42 features, 2, 5, and 35 were categorized as classical PET, probability-based, and texture features, respectively. Seven features, approximately the square root of 42, were randomly selected as candidates for constructing a decision split.
Suitable numbers of decision trees and splits
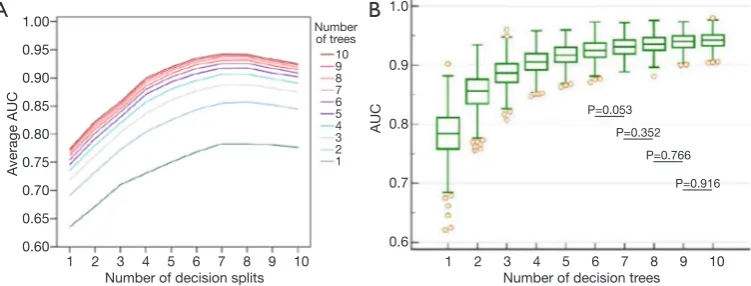
The number of decision trees in the constructed RF and splits in the decision tree were determined through exhaustive search. The ranges of both numbers were set from 1 to 10. For each combination of numbers of splits and trees, a group of 500 RFsplits,trees, called Gsplits,trees, was constructed. The predictive performance of a specific combination was evaluated by averaging the AUCs of the
Gsplits,trees. As illustrated in Figure 2A, when the number of splits was fixed, the averaged AUCs were positively associated with the number of decision trees. Notably, predictive performance markedly increased when the number of decision trees was lower than six, regardless of the number of splits. Similarly, when the number of trees was fixed, the averaged AUCs exhibited a positive correlation with the number of splits. However, the values decreased after eight splits.
The number of splits was determined on the basis of effects on predictive performance. When the number of decision trees was fixed, the effects of the number of splits were evaluated by comparing the difference between the AUCs of two Gsplits,trees in the post hoc ANOVA.
[image:5.595.47.285.96.642.2]The number of decision trees was determined on the basis of effects on predictive performance. As illustrated in Figure 2B, the predictive performance of G7,trees was positively associated with the number of trees. When AUCs between two G7,trees were compared on the basis of the post hoc ANOVA, differences between G7,6 and G7,7 were nonsignificant (P>0.05). Thus, the RF model was assembled
Table 1 Patient characteristics (N=169)
Characteristic Value
Age (years) 32–85 (median, 59)
Gender Male: 115, female: 54
Primary lesion location
Low rectum 64
Middle rectum 61
Upper rectum or rectosigmoid junction 44
CEA (ng/dL) 18.0±41.5 (0.5–241.9)
Pretreatment clinical staging (AJCC 7th ed.)
T stage T2: 20, T3: 132, T4: 17
N stage N0: 56, N1: 70, N2: 43
M stage M0: 167, M1: 2
Differentiation
W-D 9
M-D 114
P-D 8
Unknown 38
Concurrent chemotherapy regimen
Capecitabine 142
Uracil-Tegafur 19
Intravenous 5-fluorouracil based regimen
8
18F-FDG-PET/CT parameter
SUVmax 11.47±4.83
MTV (mL) 23.48±26.98
TLGmean (g) 178.54±336.86
Interval from the end of radiation to surgery
>4 and <8 week 92
≥8 and <12 week 77
Tumor regression grade (n, %)
Grade 0 0 [0]
Grade 1 29 [17]
Grade 2 35 [21]
Grade 3 83 [49]
Grade 4 22 [13]
with six decision trees.
RF structure and classification result
The RF model finally adopted in this study was selected from G7,6. As shown in Figure 2B, the AUCs of G7,6 ranged from 0.8718 to 0.9728 (standard deviation =0.01748). The 95% CIs for the arithmetic mean and median were 0.9235– 0.9266 and 0.9237–0.9268, respectively. An additional criterion, namely the F1 score, defined as 2 × SE × PPV/ (SE + PPV), was used to evaluate the performance of each RF in G7,6. Accordingly, the RF with the highest score was adopted, and the overall structure is depicted in Figure 3. The AUC of the RF model for predicting pCR was 0.941, as illustrated in Figure 4.
The classification results are summarized in Table 2. According to ROC curve analysis, the calibrated cutoff for dichotomizing the predictions into with or without pCR was set to 0.3013. The SE, SP, PPV, NPV, and accuracy were 81.8%, 97.3%, 81.8%, 97.3%, and 95.3%, respectively. The high SP and NPV exhibited by the constructed forest demonstrate its strong ability to reject the possibility of pCR after NCRT.
Cross-validation of the proposed model
We employed k-fold cross-validation to verify the robustness of the proposed model. The 169 patients enrolled in this study were randomly partitioned into five sets. Three sets had 4 and 29 tumors with and without pCR, respectively, whereas the remaining two sets contained 5
and 30 tumors with and without pCR, respectively. Each set was used once as a test set to predict pCR using the model trained by the other four sets. The average SE, SP, PPV, NPV, and accuracy of the five test sets were 0.74, 0.92, 0.67, 0.96, and 0.89, respectively.
Comparison with performance of human-engineered radiomic features
Binary logistic regression was conducted to assess the most robust feature to predict tumors with pCR. Of the 42 features (Table S1), short-run high gray-level emphasis selected using the forward likelihood ratio method was adopted to create the prediction model [chi-square (χ2) = 9.882, P=0.002], and the corresponding odds ratio and 95% CI were 1.04 and 1.014–1.067, respectively. A ROC analysis was conducted to compare the predictions of tumors with pCR with ground truth data. As displayed in Figure 4, the AUC value of this prediction model was 0.683, which was significantly inferior to that of the adopted RF (P<0.0001).
Discussion
Personalized medicine for patients with cancer involves identifying biological and medical imaging markers to predict therapeutic effects. Response to NCRT is critical because it directly affects postoperative treatment and prognosis. Patients who achieve pCR could benefit from improved local control, and a sphincter-saving procedure can be beneficial for those with low-lying tumors (1). Thus, early prediction of downstaging, particularly pCR, 1.00
0.95
0.90
0.85
0.80
0.75
0.70
0.65
0.60
1.0
0.9
0.8
0.7
0.6
1 2 3 4 5 6 7 8 9 10 1 2 3 4 5 6 7 8 9 10
A
verage AUC
AUC
Number of decision splits Number of decision trees Number
of trees 10 9 8 7 6 5 4 3 2 1
B
A
P=0.053 P=0.352
P=0.766
[image:6.595.112.488.86.229.2]P=0.916
100 80 60 40 20 0
0 20 40 60 80 100
Sensitivity (%)
[image:7.595.68.527.83.469.2]100-Specificity (%) Random forest Binary logistic regression
Figure 3 Overall structure of the adopted random forest.
[image:7.595.77.255.495.669.2]Figure 4 Comparison of areas under the receiver operating characteristic curves of the adopted random forest and binary logistic regression model.
Table 2 Classification results for pathological complete response by using the constructed random forest (N=169)
Prediction Pathological finding Indices
pCR Non-pCR
pCR 18 4 81.8%
non-pCR 4 143 97.3%
Indices 81.8% 97.3% 95.3%
pCR, pathological complete response.
could identify patients requiring more or less aggressive treatment to reduce the risk of complications. The gold standard for assessing tumoral response to preoperative NCRT is postoperative histopathological analysis. However, this method cannot be used for preoperative selection of individualized treatments. Nevertheless, ContrastN <0.006 <60.655 <0.437 <0.263 <0.437 <295.434 <0.026 <0.158 <−0.355 <1.346 <44.168 <94.948 <94.948 <107.356 <114.71 <107.5 <0.762 <0.553 <46.687 <0.008 <0.115 <0.124 <0.748 <17.736 0.333 <0.153 <291.559 <3.665 <5.138 <64.523 <89.133 <84.248 <7.68 0 0.5 0.125 0.5 <2.694 0 0 0.556 0.222 <58.5 <95.272 <1.275 <0.143
0.667
0.125 0
0.294 0.833 0 0 0.125 LGRE LGRE 0.643 0.25 0.133 RLNU 0 0 0 Busyness 0 DiversityD2 DiversityD4 ≥0.006 ≥60.655 ≥0.437 ≥0.263 ≥0.437 ≥295.434 ≥0.026 ≥0.158 ≥−0.355
≥1.346 ≥44.168
≥94.948 ≥94.948 ≥107.356 ≥114.71 ≥107.5 ≥0.762 ≥0.553 ≥46.687 ≥0.008 ≥0.115 ≥0.124 ≥0.748 ≥17.736 0 ≥0.153 ≥291.559 ≥3.665
≥5.138 ≥64.523
≥89.133 ≥84.248 ≥7.68 SRHGE GLNUr 0 Autocorrelation ≥2.694 LZE LRLGE 0.75 0.7 ≥58.5 ≥95.272 ≥1.275 ≥0.143 0.059 0.014 0.333 0.067 SZE Sum variance Sum average 0 0.6 ContrastG ContrastG Coarseness 1 0.308 0.111 0.125 0.417 Coarseness Complexity Strength LGHRE ZLNU LRLGE LZLGE 0.778 LRE LRE LGRE LZLGE
Information measure of correlation 1
Information measure of correlation 2 Difference variance
Sum variance
Sum of squares variance
Sum of squares variance ContrastG
MTV ContrastG
DiversityD2 Sum average
[image:7.595.309.550.519.599.2]several clinicopathological and treatment-related factors were reported to be independently associated with pCR, including a lower tumor grade, lower clinical T and N stages, higher radiation dose, and delay of surgery after 6–8 weeks (30). Additionally, retrospective cohort studies have identified other variables as potential predictors, including carcinoembryonic antigens (30) and shorter distance from the anal verge (31). However, the combination of these parameters cannot yield a sufficiently high predictive value to suggest less extensive surgery or a wait-and-see policy. Furthermore, post-NCRT and preoperative MRI with diffusion-weighted imaging (DWI) or [18 F]FDG-PET are not sufficiently accurate in safely selecting patients for organ preservation (16). By using an RF model, this study is the first to demonstrate that radiomics obtained from baseline [18F]FDG-PET can accurately predict pCR. The observed pCR rate is consistent with that obtained from a National Cancer Database analysis (32). Although a minority of patients achieved pCR after NCRT, our model provides a novel platform for future studies.
To date, clinical assessment is the most accurate method for identifying pCR after NCRT (30). Additional MRI or [18F]FDG-PET after NCRT might improve diagnostic performance (9,10,12,14,30). Compared with those of previous studies, the high SP and NPV exhibited by the constructed forest model demonstrate the model’s robust ability to classify patients for whom a wait-and-see strategy is unsuitable. Because a positive correlation was observed between PPV and predicted events, the relatively low SP and PPV exhibited by this model might be attributable to a minority of patients with pCR. To maximize the predictive ability of the constructed forest model, we intend to reassess the PPV by increasing the sample size or number of events in future research. In addition, overall predictive performance can be maximized through the integration of information from the proposed RF model and other predictive models after NCRT (9,10).
Despite the lack of a universal algorithm for computing radiomic features derived from [18F]FDG-PET in rectal cancer, implementing an imaging phenotype to predict a particular clinical outcome is valuable. Bang et al. (18) studied a set of textural features in 74 patients with rectal cancer by performing multivariate analysis and demonstrated that the kurtosis of the absolute gradient was significantly associated with recurrence. However, they revealed no significant associations between textural parameters and TRG. Lovinfosse et al. (17) conducted a similar trial on 66 patients treated with NCRT and
indicated that KRAS mutational status and total lesion glycolysis are significant predictors of good responders (TRG3 or TRG4) to NCRT. Notably, radiomic parameters, including homogeneity and coarseness, were significantly associated with disease-free survival. Radiomics derived from [18F]FDG-PET failed to demonstrate the predictive ability of TRG4 possibly because of the limited sample size and pCR events in both studies. To maximize the prognostic benefits of radiomics, future research should investigate overall and disease-free survival.
To achieve reproducible and accurate clinical utility, our use of prediction probability to construct the RF model facilitated the measurement of predictive performance through ROC analysis; this thus enabled the calibration of the cutoff used to dichotomize a tumor as achieving versus not achieving pCR. As shown in Figure 2, an improvement in the range of predictive performance converged with an increase in the numbers of splits and trees. When an RF had more than four decision trees (Figure 2B), the 25th and 75th percentiles of the AUCs of the constructed forests were greater than 0.9, indicating high prediction accuracy. Furthermore, candidates for establishing a split were randomly selected from available features. This suggests that the constructed decision trees were dissimilar, even when the same bootstrap was used. The dissimilarity between decision trees in an RF increased because they were constructed from an independent bootstrap randomly selected from tumors obtained from enrolled patients, thus creating dissimilarity among forests. This characteristic rendered this study reproducible by establishing suitable numbers of trees and splits. Moreover, the sensitivity and reproducibility in classifying tumors based on pCR were considerably improved through the calibration of optimum cutoffs. Despite the advantage exhibited in the proposed RF model, external validation studies using the same reconstruction method are required to examine the robustness of the forest-based prediction probability.
segmentation algorithms for various biological endpoints is crucial because of concerns pertaining to functional volume underestimation (33). In addition, the case distribution between pCR and non-pCR might have contributed to a bias in the classification results. In general, PPV and disease prevalence are positively correlated, resulting in a higher PPV in a cohort with a higher pCR rate. To maximize the predictive ability of the model, we intend to reassess the PPV by increasing the sample size or event number in the future. Moreover, although the RF model was constructed by implementing out-of-bag cross-validation, its robustness could be improved by including multiple feature selection methods or constraining feature selection to only the training dataset in order to prevent information leakage from the testing dataset. Furthermore, to optimize the clinical utility of radiomics, comparing other predictive models, including MRI-derived radiomic features, simultaneously would be valuable because MRI potentially describes distinct patterns in tumor physiology, such as phenotypic categories from DWI and dynamic contrast-enhanced imaging (34). Although MRI-derived radiomic studies face derivational challenges intrinsic to the technology, such as feature reproducibility due to scanner parameters or multiple tissue properties with specific acquisition characteristics (34), large amounts of imaging data should be retrieved and filtered using AI techniques in the future. Finally, the percentage of the pCR could have been affected by the interval between NCRT completion and surgery. Although no difference was observed in pCR ratios between intervals of <8 and
≥8 weeks in our cohort (χ2 P=0.25), one study suggested that an interval of >8 weeks is associated with an increased pCR rate (35). Nevertheless, the strengths of the present study include relatively robust machine learning methods and comprehensive radiomic analyses. Our findings represent a pivotal step in enabling TME customization for patients with rectal cancer who have received NCRT. After future validation studies, oncologists may be able to determine the feasibility and suitability of adopting a wait-and-see strategy or conservative surgery for patients. Awareness of this approach could be valuable in counseling patients regarding prognoses and treatment alternatives.
Conclusions
By using an RF model, we determined that radiomics derived from baseline [18F]FDG-PET could accurately predict pCR in patients with rectal cancer who had received NCRT. The RF model had high accuracy and predictive
value. Before clinical use in personalized treatment with a wait-and-see strategy, the proposed model requires validation in larger clinical studies.
Acknowledgments
Funding: This work was supported by grants from the
Ministry of Health and Welfare, Taiwan (MOHW108-TDU-B-212-133004), China Medical University Hospital (CMU107-ASIA-19, CRS-108-026), Asia University: computer-aided diagnosis for treatment response of rectal cancer (DMR-106-150), Academia Sinica Stroke Biosignature Project (BM10701010021), Ministry of Science and Technology, Taiwan (MOST), Clinical Trial Consortium for Stroke (MOST 108-2321-B-039-003-), Tseng-Lien Lin Foundation, Taichung, Taiwan, and Katsuzo and Kiyo Aoshima Memorial Funds, Japan. The funders had no role in study design, data collection and analysis, decision to publish, or preparation of the manuscript. No additional external funding was received for this study.
Footnote
Conflicts of Interest: The authors have no conflicts of interest
to declare.
Ethical Statement: The authors are accountable for all
aspects of the work in ensuring that questions related to the accuracy or integrity of any part of the work are appropriately investigated and resolved. This study was approved by the local institutional review board (IRB) (certificate numbers CMUH102-REC2-74 and DMR99-IRB-010-1). This is a retrospective study of image analyses. The IRB specifically waived the consent requirement.
Open Access Statement: This is an Open Access article
distributed in accordance with the Creative Commons Attribution-NonCommercial-NoDerivs 4.0 International License (CC BY-NC-ND 4.0), which permits the non-commercial replication and distribution of the article with the strict proviso that no changes or edits are made and the original work is properly cited (including links to both the formal publication through the relevant DOI and the license). See: https://creativecommons.org/licenses/by-nc-nd/4.0/.
References
versus postoperative chemoradiotherapy for rectal cancer. N Engl J Med 2004;351:1731-40.
2. Bosset JF, Collette L, Calais G, et al. Chemotherapy with preoperative radiotherapy in rectal cancer. N Engl J Med 2006;355:1114-23.
3. Maas M, Nelemans PJ, Valentini V, et al. Long-term outcome in patients with a pathological complete response after chemoradiation for rectal cancer: a pooled analysis of individual patient data. Lancet Oncol 2010;11:835-44. 4. García-Aguilar J, de Anda EH, Sirivongs P, et al.
A pathologic complete response to preoperative chemoradiation is associated with lower local recurrence and improved survival in rectal cancer patients treated by mesorectal excision. Dis Colon Rectum 2003;46:298-304. 5. Rödel C, Martus P, Papadoupolos T, et al. Prognostic
significance of tumor regression after preoperative chemoradiotherapy for rectal cancer. J Clin Oncol 2005;23:8688-96.
6. Habr-Gama A, Perez, Nadalin W. Operative versus nonoperative treatment for stage 0 distal rectal cancer following chemoradiation therapy: long-term results. Ann Surg 2004:240:711-7.
7. Maas M, Beets-Tan RG, Lambregts DM, et al. Wait-and-see policy for clinical complete responders after chemoradiation for rectal cancer. J Clin Oncol 2011;29:4633-40.
8. Dalton RS, Velineni R, Osborne ME, et al. A single-centre experience of chemoradiotherapy for rectal cancer: is there potential for nonoperative management? Colorectal Dis 2012;14:567-71.
9. Bibault JE, Giraud P, Housset M, et al. Deep learning and radiomics predict complete response after neo-adjuvant chemoradiation for locally advanced rectal cancer. Sci Rep 2018;8:16914.
10. Horvat N, Veeraraghavan H, Khan M, et al. MR imaging of rectal Cancer: Radiomics analysis to assess treatment response after neoadjuvant therapy. Radiology 2018;287:833-43.
11. Calvo FA, Domper M, Matute R, et al. 18F-FDG positron emission tomography staging and restaging in rectal cancer treated with preoperative chemoradiation. Int J Radiat Oncol Biol Phys 2004;58:528-35.
12. Capirci C, Rampin L, Erba PA, et al. Sequential FDG-PET/CT reliably predicts response of locally advanced rectal cancer to neo-adjuvant chemoradiation therapy. Eur J Nucl Med Mol Imaging 2007;34:1583-93.
13. Cascini GL, Avallone A, Delrio P, et al. 18F-FDG PET is an early predictor of pathologic tumor response to
preoperative radiochemotherapy in locally advanced rectal cancer. J Nucl Med 2006;47:1241-8.
14. Guillem JG, Moore HG, Akhurst T, et al. Sequential preoperative fluorodeoxyglucosepositron emission tomography assessment of response to preoperative chemoradiation: a means for determining long term outcomes of rectal cancer. J Am Coll Surg 2004;199:1-7. 15. Konski A, Hoffman J, Sigurdson E, et al. Can molecular imaging predict response to preoperative chemoradiation in patients with rectal cancer? A Fox Chase Cancer Center prospective experience. Semin Oncol 2005;32:S63-7. 16. Joye I, Deroose CM, Vandecaveye V, Haustermans K. The
role of diffusion-weighted MRI and (18)F-FDG PET/CT in the prediction of pathologic complete response after radiochemotherapy for rectal cancer: a systematic review. Radiother Oncol 2014;113:158-65.
17. Lovinfosse P, Polus M, Van Daele D, et al. FDG PET/ CT radiomics for predicting the outcome of locally advanced rectal cancer. Eur J Nucl Med Mol Imaging. 2018;45:365-75.
18. Bang JI, Ha S, Kang SB, et al. Prediction of neoadjuvant radiation chemotherapy response and survival using pretreatment 18F-FDG PET/CT scans in locally advanced rectal cancer. Eur J Nucl Med Mol Imaging 2016;43:422-31.
19. Breiman L. Random forests. Mach Learn 2001;45:5-32. 20. Hatt M, Tixier F, Pierce L, et al. Characterization of PET/
CT images using texture analysis: the past, the present any future? Eur J Nucl Med Mol Imaging 2017;44:151-65. 21. Samuelian JM, Callister MD, Ashman JB, et al. Reduced
acute bowel toxicity in patients treated with intensity-modulated radiotherapy for rectal cancer. Int J Radiat Oncol Biol Phys 2012;82:1981-7.
22. Dworak O, Keilholz L, Hoffmann A. Pathological features of rectal cancer after preoperative radiochemotherapy. Int J Colorectal Dis 1997;12:19-23.
23. Chen SW, Shen WC, Chen WTL, et al. Metabolic imaging phenotype using textural features of 18F-FDG PET/CT associated with genetic alterations of colorectal cancer. Mol Imaging Biol 2019;21:183-90.
24. Brooks FJ, Grigsby PW. Current measures of metabolic heterogeneity within cervical cancer do not predict disease outcome. Radiat Oncol 2011;6:69.
25. Haralick RM, Shanmugam K, Dinstein I. Textural features for image classification. IEEE Trans Syst Man Cybern. 1973;3:610-21.
Process 1983;23:341-52.
27. Loh H, Leu J, Luo R. The analysis of natural textures using run length features. IEEE Trans Ind Electron 1988;35:323-8.
28. Thibault G, Fertil B, Navarro C, et al. Texture indexes and gray level size zone matrix: application to cell nuclei classification. Pattern Recognition Inf Process 2009;7:140-5.
29. DeLong ER, DeLong DM, Clarke-Pearson DL. Comparing the areas under two or more correlated receiver operating characteristic curves: a nonparametric approach. Biometrics 1988;44:837-45.
30. Al-Sukhni E, Attwood K, Mattson DM, et al. Predictors of pathologic complete response following neoadjuvant chemoradiotherapy for rectal cancer. Ann Surg Oncol 2016;23:1177-86.
31. Das P, Skibber JM, Rodriguez-Bigas MA, et al. Predictors of tumor response and downstaging in patients who
receive preoperative chemoradiation for rectal cancer. Cancer 2007;109:1750-5.
32. Lorimer PD, Motz BM, Kirks RC, et al. Pathologic complete response rates after neoadjuvant treatment in rectal cancer: An analysis of the National Cancer Database. Ann Surg Oncol 2017;24:2095-103.
33. Sollini M, Cozzi L, Antunovic L, et al. PET Radiomics in NSCLC: state of the art and a proposal for harmonization of methodology. Sci Rep 2017;7:358.
34. Jethanandani A, Lin TA, Volpe S, et al. Exploring applications of radiomics in magnetic resonance imaging of head and neck cancer: A systematic review. Front Oncol 2018;8:131.
35. Probst CP, Becerra AZ, Aquina CT, et al. Extended intervals after neoadjuvant therapy in locally advanced rectal cancer: the key to improved tumor response and potential organ preservation. J Am Coll Surg 2015;221:430-40.
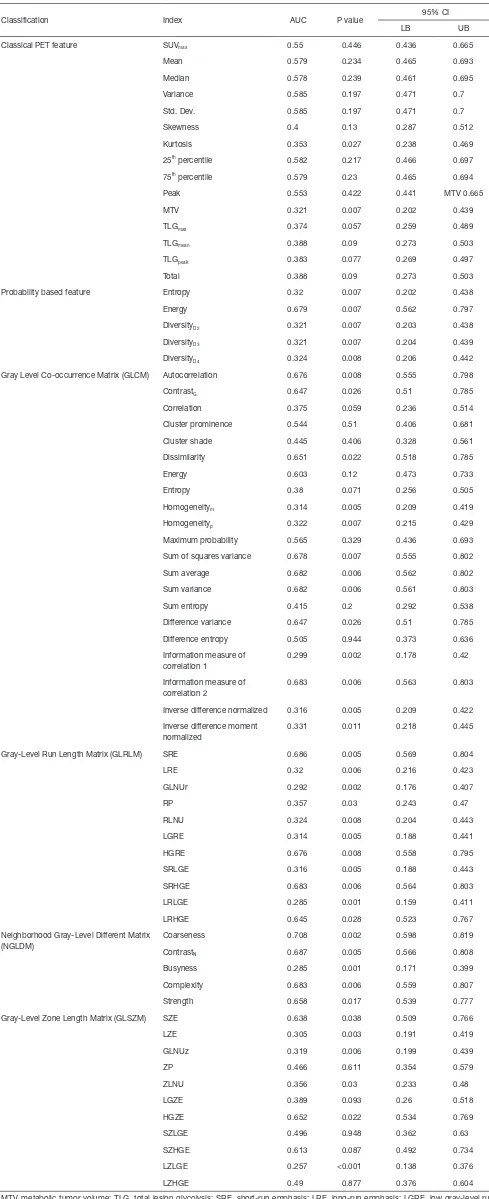
Table S1 Ability of traditional PET: probability-based, and textural features in differentiating tumors with tumor regression score 4 from those with other scores
Classification Index AUC P value 95% CI
LB UB
Classical PET feature SUVmax 0.55 0.446 0.436 0.665
Mean 0.579 0.234 0.465 0.693
Median 0.578 0.239 0.461 0.695
Variance 0.585 0.197 0.471 0.7
Std. Dev. 0.585 0.197 0.471 0.7
Skewness 0.4 0.13 0.287 0.512
Kurtosis 0.353 0.027 0.238 0.469
25th percentile 0.582 0.217 0.466 0.697
75th percentile 0.579 0.23 0.465 0.694
Peak 0.553 0.422 0.441 MTV 0.665
MTV 0.321 0.007 0.202 0.439
TLGmax 0.374 0.057 0.259 0.489
TLGmean 0.388 0.09 0.273 0.503
TLGpeak 0.383 0.077 0.269 0.497
Total 0.388 0.09 0.273 0.503
Probability based feature Entropy 0.32 0.007 0.202 0.438
Energy 0.679 0.007 0.562 0.797
DiversityD2 0.321 0.007 0.203 0.438
DiversityD3 0.321 0.007 0.204 0.439
DiversityD4 0.324 0.008 0.206 0.442
Gray Level Co-occurrence Matrix (GLCM) Autocorrelation 0.676 0.008 0.555 0.798
ContrastG 0.647 0.026 0.51 0.785
Correlation 0.375 0.059 0.236 0.514
Cluster prominence 0.544 0.51 0.406 0.681
Cluster shade 0.445 0.406 0.328 0.561
Dissimilarity 0.651 0.022 0.518 0.785
Energy 0.603 0.12 0.473 0.733
Entropy 0.38 0.071 0.256 0.505
Homogeneitym 0.314 0.005 0.209 0.419
Homogeneityp 0.322 0.007 0.215 0.429
Maximum probability 0.565 0.329 0.436 0.693
Sum of squares variance 0.678 0.007 0.555 0.802
Sum average 0.682 0.006 0.562 0.802
Sum variance 0.682 0.006 0.561 0.803
Sum entropy 0.415 0.2 0.292 0.538
Difference variance 0.647 0.026 0.51 0.785
Difference entropy 0.505 0.944 0.373 0.636
Information measure of correlation 1
0.299 0.002 0.178 0.42
Information measure of correlation 2
0.683 0.006 0.563 0.803
Inverse difference normalized 0.316 0.005 0.209 0.422
Inverse difference moment normalized
0.331 0.011 0.218 0.445
Gray-Level Run Length Matrix (GLRLM) SRE 0.686 0.005 0.569 0.804
LRE 0.32 0.006 0.216 0.423
GLNUr 0.292 0.002 0.176 0.407
RP 0.357 0.03 0.243 0.47
RLNU 0.324 0.008 0.204 0.443
LGRE 0.314 0.005 0.188 0.441
HGRE 0.676 0.008 0.558 0.795
SRLGE 0.316 0.005 0.188 0.443
SRHGE 0.683 0.006 0.564 0.803
LRLGE 0.285 0.001 0.159 0.411
LRHGE 0.645 0.028 0.523 0.767
Neighborhood Gray-Level Different Matrix (NGLDM)
Coarseness 0.708 0.002 0.598 0.819
ContrastN 0.687 0.005 0.566 0.808
Busyness 0.285 0.001 0.171 0.399
Complexity 0.683 0.006 0.559 0.807
Strength 0.658 0.017 0.539 0.777
Gray-Level Zone Length Matrix (GLSZM) SZE 0.638 0.038 0.509 0.766
LZE 0.305 0.003 0.191 0.419
GLNUz 0.319 0.006 0.199 0.439
ZP 0.466 0.611 0.354 0.579
ZLNU 0.356 0.03 0.233 0.48
LGZE 0.389 0.093 0.26 0.518
HGZE 0.652 0.022 0.534 0.769
SZLGE 0.496 0.948 0.362 0.63
SZHGE 0.613 0.087 0.492 0.734
LZLGE 0.257 <0.001 0.138 0.376
LZHGE 0.49 0.877 0.376 0.604
MTV, metabolic tumor volume; TLG, total lesion glycolysis; SRE, short-run emphasis; LRE, long-run emphasis; LGRE, low gray-level run emphasis; HGRE, high gray-level run emphasis; SRLGE, short-run low gray-level emphasis; SRHGE, short-run high gray-level emphasis; LRLGE = long-run low gray-level emphasis; LRHGE, long-run high gray-level emphasis; GLNUr, gray-level nonuniformity for run; RLNU, run-length nonuniformity; RP, run percentage; SZE, short-zone emphasis; LZE, long-zone emphasis; LGZE, low gray-level zone emphasis; HGZE, high gray-level zone emphasis; SZLGE, short-zone low gray-level emphasis; SZHGE, short-zone high gray-level emphasis; LZLGE, long-zone low gray-level emphasis; LZHGE, long-zone high gray-level emphasis; GLNUz, gray-level nonuniformity for zone; ZLNU, zone
length nonuniformity; ZP, zone percentage. Definition of 25th percentile: The 25th percentile is a measurement of relative standing within
SUVs of an MTV, indicating that 25% of all SUVs are below the MTV. The same model is applied for the 75th percentile. Definition of
peak: The average of SUVmax and SUVs of 26 adjacent voxels. Total: Sum of all SUVs within the MTV.
1 (1 ) 1
( ) n
Dn i
Diversity − =
=