International Journal of Advanced Research in Computer Science
RESEARCH PAPER
Available Online at www.ijarcs.info
Olap Mining in Clinical Decision Support System for Medical Diagnosis
Reddy Sony Krishna Dept of CSE
Andhra loyola Institute of Technology, AndhraPradesh,India.
Neelima Naralasetty Dept of IT
V.R.Siddhartha Engineering College AndhraPradesh,India.
Jayalakshmi Gundabathina Dept of IT
V.R.Siddhartha Engineering College AndhraPradesh,India.
Abstract: Medical area produces increasingly voluminous amounts of electronic data which is more complicated for decision making. The developed clinical decision support system (CDSS) used a prototype On-Line Analytical Processing (OLAP) mining for medical diagnosis using advanced technologies such as On-Line Analytical Processing and Data Mining to deliver advanced capabilities by combining the strengths of both. This approach provides a rich acquaintance environment, not achievable by using OLAP alone or data mining alone. This work deals with CDSS using OLAP mining prototype to prepare diagnosis reports contains the proportion of patients’ sick and healthy on the whole medical data set. Using developed CDSS physicians and health care professionals obtains a decision on decisive symptom values that can be enumerated for further study on disease. These decisive symptom values and analysis reports of clinical support system are provided with better visualization results to the user that improves clinical environment.
Keywords:-Clinical decision support system,OLAP, decisive symptom,diabetes.
I. INTRODUCTION
There is no improvised system for clinical environments summarized results. In the field of health care the incorporation of data warehousing, Online Analytical Processing(OLAP) and data mining techniques and an easy to use decision support platform, very much supports the decision making process for health care professionals. In clinical decision support systems individual usage of data mining and OLAP does not give better results. For recording business transactions On-LineTransaction Processing (OLTP) systems depends on relational data bases. Doctors use reports to make clinical decisions that are generated by applying structured query language (SQL) on the recorded two dimensional information and automate repetitive tasks. An important research tool data mining can discover hidden knowledge in the data and identify problems along several dimensions [1].
In our locality hospitals maintains Medical record department (MRD) separately to maintain data records of patients. Electronic data record is necessary for analyzing and decision making. Individual patient and his personal doctor only track their own record. There are some clinical decision support systems that were developed for the improvements of clinical research, but not give the appropriate results by using the OLTP operations that gives results but having complexity in building queries and retrieving results. A prototype CDSS(Clinical Decision Support System) using OLAP Mining which combines the strengths of both On-line Analytical Processing and Data Mining. We can classify the patients according their stages and treatment is based on the classification of data. The
classified data is considered as the OLAP data which can be used for better visualization and retrieval of required data. This system gives details of percentage of patients are sick and healthy. Particular symptom or attribute level is critical that can be used for further research of their study. Analysis reports for better visualization and understanding of patients that improves clinical environment and provides information for doctors’ further research.
In existing system OLAP and data mining are performed individually that does not give effective results. The online transactional processing used for current transactions but not for multidimensional data, historical data for analysis. The Medical data records are maintained manually that are difficult to analyzes to give proper treatment to patient. Doctors and clinical managers uses existing clinical decision support systems that are used to allocate the doctors to the patients, but not to consider which kind of patients are used for further researches and count of patients effecting with problem that have many considerations.
II. RELATEDWORK
A data warehouse is a subject-oriented, integrated, time variant, and nonvolatile collection of data in support of management’s decision-making process.
a. Subject-Oriented:
b. Integrated:
Integrating multiple, heterogeneous data sources like flat files, online transaction processing records for data extraction. Data cleaning [10] and data integration techniques are applied. Ensure consistency in naming conventions, encoding structures, attribute measures, etc. among different data sources.
c. Time Variant:
The time horizon for the data warehouse is significantly longer than that of operational systems. Current value data is considered for the operational data base. Data ware house data contains long time information obtained by historical prospective. Every key structure in the data warehouse contains an element of time, explicitly or implicitly, but the key of operational data may or may not contain “time element” [10].
d. Non-Volatile:
A physically separate store of data transformed from the operational environment. Operational update of data does not occur in the data warehouse environment. Does not require transaction processing, recovery, and concurrency control mechanisms Requires only two operations in data accessing: Initial loading of data and access of data.
A. Health Care’s Version Of A Decision Support System: a. Managerial/Executive Decision Support System:
Typical finance systems for employees and patient details or a compilation of systems including ad-hoc reporting may be other systems. These managerial or executive systems include a physicians, business, and patient data[3].
b. Clinical Decision Support System: The important aspect of Clinical decision support system (CDSS) is assisting physicians and other health care professionals in decision making like determine diagnosis of patients by embedding an interactive Support systems link health observations with health knowledge to influence health choices by clinicians for improved health care. There are evidence based systems in which the evidences are placed and patient data is matched with the evidence to getting results. It improves efficiency, cost benefited, better utilization of hospital resources, future prediction based on the patients results [3].
c. HCPS: Health care processing systems is one of the patient survey care system the intent of the HCAHPS initiative is to provide a standardized and data collection methodology for measuring patients' perspectives on hospital care.
Prior to the HCAHPS there was no standard form assuring patients' perspectives on hospital care. Prior to the HCAHPS there was no standard for collecting information from the patient after these standard implementation every hospital concentrate on these standards in collecting information by comparing with this standard reports. HCAHPS survey items complement the data hospitals currently collect to support improvements in internal customer services and quality related activities.
Table I Difference between OLAP and OLTP
OLTP OLAP
Users Clerk, IT professional
Knowledge worker
Function Day to day operations
Decision support
DB design Application-oriented
Subject-oriented
Data Current, up-to-date Detailed Historical, Summarized, multidimensional Integrated Unit of work
Short, simple transaction
Complex query
#users Thousands Hundreds Metric Transaction
throughput
Querythroughput, response
B. hkDecision Tree:
Decision trees classify instances or examples by starting at the root of the tree and moving through it until a leaf node. Decision tree is one of the classification techniques in the data mining approaches. The science and technology of exploring large and complex bodies of data in order to discover useful patterns. The area is of great importance because it enables modeling and knowledge extraction from the abundance of data available. Decision trees, originally implemented in decision theory and statistics, are highly effective tools in other areas such as data mining, text mining, information extraction, machine learning, and pattern recognition. Decision trees are self-explanatory and easy to follow when compacted, these are able to handle a variety of input data: nominal, numeric and textual, able to process datasets that may have errors or missing values, and High predictive performance for a relatively small computational effort. Decision tree is a classifier in the form of a tree structure.
a. Decision node: specifies a test on a single attribute. b. Leaf node: indicates the value of the target attribute. c. Arc/edge: split of one attribute.
d. Path: a disjunction of test to make the final decision
C. Diabetic Diagnosis:
The binary-valued diagnostic variable presented in this dataset relates whether a patient shows signs of diabetes according to World Health Organization criteria (i.e., if the 2 hour post-load plasma glucose was at least 200 mg/dl at any survey examination or if found during routine medical care). Several constraints were placed on the selection of these instances from a larger database. In particular, all patients here are females at least 21 years old of Pima Indian heritage. Each instance represents individual patients and their various medical attributes along with diabetes classification Attributes [3]
a. PG Concentration: Plasma glucose b. Serum Ins: Serum Insulin
c. BMI: Body Mass Index d. Age: Age (years)
e. Class: Diagnosis = sick, healthy
III. SYSTEMIMPLEMENTATION
Figure 1. Model of the system [2]
Fig. 1 describes proposed system model that satisfies all the functional requirements of the OLAP mining in clinical decision support system for medical diagnosis. Initially patient details are maintained in the form of text based electronic data on which we can perform datamining classification technique of decision tree generation using ID3 algorithm. On analysing decision tree a concept hirarchy is constructed for performing operations on that and to generate an OLAP cube. Finally different analysis reports are obtained by appling number of operations like filtering ,summerization on OLAP cube.
D. Electronic Medical Data:
The current challenge is extracting the required information and transformation of electronic health records (HER s) into useful information. An EHR is only the first step – data must be leveraged through technology to inform clinical practice and decision-making. In terms of actual application, modeling can be used to support clinical decisions provided a flexible, adaptable IT framework can consolidate data from different sources. Continuous improvement of clinical decision support and advancement of clinical knowledge are seen as key features for future systems that uses EHRs as a data source in decision making. EHRs may include a range of data, including medical history, medication and allergies, laboratory test results, personal statistics like age and weight, and billing information. EHRs reduces the chances of data replication as there is only one modifiable file, which means the file is constantly up to date when viewed at a later date and eliminates the issue of lost forms or paperwork. With an electronic health record solution, we can enhance automation, improve the availability of patient information, increase collaboration, and simplify integration of health automation tools. In our system electronic medical data is the text data that contains a textual information of the number of patients diabetic details like plasma glucose, serim, age, body mask index values that are used to calculate whether the patient is healthy or sick [12].
E. Data Mining Classification Technique:
Supervised learning and unsupervised learning are the two categories in data mining. Supervised learning, also called directed data mining, assumes that the user knows ahead of time what the classes are and that there are
examples of each class available. The data set used in this process is called the training sample. The training sample is composed of dependent or target variables, and independent variables or input.
In supervised learning, mapping of data items into one of the predefined classes. One of the critical tasks is to create a classification model, known as a classifier, which will predict the class of some entities or patterns based on the values of the input attributes. Choosing the right classifier is a critical step in the pattern recognition process[14]. A variety of techniques have been used to obtain good classifiers. Some of the more widely used and well known techniques that are used in data mining include decision trees, logistic regression, neural networks, and nearest neighbor approach. In our clinical decision support systems we are using a data mining classification technique of decision trees with the input attributes of pg, serim, age, bmi [14]
F. Id3 Algorithm:
Id3 is one of the decision tree algorithm follows greedy search to check each attribute at each and every of decision tree of given set. It is a classification technique, to classify an erudite set by metric –information gain. we need to minimize the depth of the tree. Thus, we need some function which should be able to measure the most balanced splitting. The node which selected for best splitting depends on the information gain, node having highest information gain selected as splitting node. The information gain, Gain(S, A) of an attribute A [4].
Gain(S, A) =Entropy(S) -Sum for v from 1 to n of
(|Sv|/|S|) × Entropy (Sv). (2)
In direction to define information gain exactly, we need to deliberate entropy. First, let’s assume that the resulting decision tree classifies instance into two classes without loss of simplification and we would call them P (positive) and N (negative). Given set S, containing these positive and negative targets, the entropy of S related to this Boolean classification is:
Entropy(S) =-P (positive) log2P (positive) -P
(negative) log2P (negative) (3)
P (positive): proportion of positive examples in S P (negative): proportion of negative examples in S Entropy(S) obtained by proportion of positive and negative examples of set S, To minimize the decision tree depth; we need to select the optimal attribute for splitting the tree node, so that we can easily imply the attribute with the maximum entropy reduction. The attribute that can help in maximum entropy reduction is the optimal attribute for splitting [4]. We have to use this concept of gain to rank attributes to build decision trees where at each node is located the attribute with utmost gain among the attributes that not yet considered in the path from the root. The purpose of this ordering is to generate small decision trees so that required information can be identified after only a few decision tree splitting and match a hoped for plainness of the process of decision making.
G. Decision Trees:
the case of diabetic patient the attributes of patient is body mask index, serim , plasma glucose, age and class attributes is positive or negative i.e. patient having diabetes or not. The use of decision trees is perhaps the easiest to understand and the most widely used method that falls into the category of supervised learning. A decision tree consists of nodes and arcs which connect nodes. To make a decision, one starts at the root node, and asks questions to determine which arc to follow, until one reaches a leaf node and the decision is made [8].
Figure 2. Basic structure of tree
In Fig 2, each non-leaf node of a decision tree corresponds to an input attribute, and each arc to a possible value of that attribute. A leaf node corresponds to the expected value of the output attribute when the input attributes are described by the path from the root node to that leaf node.
In a good decision tree, each non-leaf node should correspond to the input attribute which is the most informative about the output attribute amongst all the input attributes not yet considered in the path from the root node to that node. This is because we would like to predict the output attribute using the smallest possible number of questions on average. Entropy is used to determine how informative a particular input attribute is about the output attribute for a subset of the training data. Entropy is a measure of uncertainty in communication systems introduced by Shannon (1948). It is fundamental in modern information theory.
A typical decision tree system adopts a top-down strategy in searching for a solution. It consists of nodes where predictor attributes are tested. At each node, the algorithm examines all attributes and all values of each attribute with respect to determining the attribute and a value of the attribute that will best separate the data into more homogeneous subgroups with respect to the target variable. In other words, each node is a classification question and the branches of the tree are partitions of the data set into different classes. This process repeats itself in a recursive, iterative manner until no further separation of the data is feasible or a single classification can be applied to each member of the derived subgroups. Therefore, the terminal nodes at the end of the branches of the decision tree represent the different classes [17].
In our system decision tree is obtained by using ID3 algorithm on the attributes of bmi, pg, serim , age with a class attribute healthy or sick. The decision tree is obtained by calculating the entropy value. A tree obtained with number of sub nodes at a particular attribute value we can not classify the patient is healthy or sick at that point another
sub node is added to the tree. The tree formation is ended with the classification of patient is healthy or sick. This decision tree is used as an input for the building concept hierarchy. The concept hierarchy building is based on the decision node values that were obtained from the decision tree that was generated by using decision tree classification data mining technique.
H. Concept Hierarchy Building :
[image:4.595.322.560.284.402.2]Concept hierarchies are a kind of concise and general form of concept description widely used. Many knowledge representations are variants of concept hierarchies in different ways of expression. For transaction databases, as an example, association rules are the set of rules that describe the relative relationships in a partial ordering hierarchy of large item sets. Decision tree is another type of concept hierarchy used for generating classification rules and classifying the categories of data. The other type of concept hierarchy, like clusters, is a one-level concept grouping data with high similarity into classes [5].
Figure 3. Example of Concept Hierarchy
A concept hierarchy defines step by step mapping some lower level concepts into more general concepts and at the same time more general concepts on one or set of attributes are partially order according to specific ordering sets. The concept hierarchy seems to be one tree like structure general concept at root part that is divided into sun category of next level ,in further level each sub category is again divided into more sub categories from level to levels as depicted in Fig 3, mapping low-level concepts (i.e., Level 3) to more general concepts (i.e., Level 0). The most general concept can be an universal concept, whereas the most specific concepts correspond to the specific values of attributes in the database. Each node in the tree of concept hierarchy represents a concept which helps to express knowledge and data relationships in a database as a concise, high level term. Formally, suppose that a hierarchy Cis defined on a set of domains Ci, …, Ck, we have Cl: {Di × … × Dk} ->Cl-1 ->… ->C0 , where Cldenotes the set of concepts at the primitive level, Hl-1 denotes the concepts at one level higher than those at Cl, and C0 represents the most general concept on the top level denoted as “ANY”, as Figure …. Illustrates [15].
Methods for generation of concept hierarchies for categorical data.
schema level such as street < city <province <state < country.
b. Specification of a portion of a hierarchy by explicit data grouping: This is identically a manual definition of a portion of a concept hierarchy.By explicit value enumeration defining an entire concept hierarchy is unrealistic for large databases. However, it is realistic to specify explicit groupings for a small portion of the intermediate-level data.
c. Specification of a set of attributes but not their partial ordering: One attribute depends on the other attribute but not depend on the another attribute this is partial dependency. The ordering by omitting this partial approach is specification of a set of attributes but not their partial ordering In this category system automatically generate a meaning full concept hierarchy by attribute ordering on the attribute that are ordered only but not partially ordered.
d. Specification of only of partial set of attributes: Sometimes a user can be sloppy when defining a hierarchy, or may have only a vague idea about what should be included in a hierarchy. Consequently the user may have included only a small subset of the relevant attributes for the location, the user may have only specified street and city. To handle such partially specified hierarchies, it is important to embed data semantics in the database schema so that attributes with tight semantic connections can be pinned together [5].
[image:5.595.321.555.435.583.2]In our system the concept hierarchy is based on the decision tree generated, each decision node of the class attribute gives a new level for this concept hierarchy. We are using a category of Specification of a portion of a hierarchy by explicit data grouping in our clinical decision support system. The concept hierarchy building is based on the set theory is implemented for marinating levels in the hierarchy some small portion of data records are grouped into one level that is the parent to the other level which is a decision node attribute.
Figure 4. CDSS concept hierarchy [5]
In the above Fig 4, level0 is divided into level10, level11 and level12.level12 is divided into two sub levels level20 and level21 the entire information is bullied in a hierarchical manner. The data is obtained by performing olap operations on the conceptual tree.
I. OLAP Cube Generation:
There are three categories of schemas for cube generation:
a. Star Schema: All dimension tables are connected to a middle fact table.
b. Snowflake schema: A refinement of star schema where some dimensional hierarchy is normalized into a set of smaller dimension tables, forming a shape similar to snowflake.
c. Fact constellations: Each dimension table is connected with multiple fact tables, viewed as a
collection of stars, therefore called galaxy schema or fact constellation.
a) Measures: A data cube function is a numerical function that can be evaluated at each point in the data cube space. Given a data point in the data cube space: Entry(n1, n2, …, nk)where vi is the value corresponding to dimension di. We need to apply the aggregate measures to the dimension values n1, n2, …, nk
b) Distributive: If the result derived by applying the function to k aggregate values is the same as that derived by applying the function on all the data without partitioning.
Example: count (), sum (), min (), max ().
c) Algebraic: Use distributive aggregate functions. If it can be computed by an algebraic function with M
arguments (where M is a bounded integer), each of which is obtained by applying a distributive aggregate function.
In this system we are using OLAP cube writer for building the OLAP cube. The tables that are used to build the cube are the concept hierarchy tables. Choose the tables from the data base by connecting OLAP cube writer to the MY SQL JDBC connector. The Cube generation is based on the tables’ selection while creating the cube. Select the number of dimensions and measures from any of the tables. Maintain the relation of parent–child by connecting the parent table attribute to the child table attributes. If there is no relation the will not be generated. We can perform the number of operations like aggregating results, filtering operations, crucial points of the attributes, ranking operations, counting values on the total number of records. We are using Snow flake schema to build the cube.
Figure 5. OLAP cube
Fig 5, shows the OLAP cube generation with a parent of level 0 having Four Childs and a grandchild .The second level has a child that was a grandchild to the level 0 and acts like a child to the level 13.
J. OLAP Operations:
a. Roll Up: It is performed by climbing up hierarchy of a dimension or by dimension reduction (reduce the cube by one or more dimensions). The roll up operation in the example is based location (roll up on location) is equivalent to grouping the data by country [7].
[image:5.595.76.246.507.557.2]c. Slice and Dice: Project and Select operations. Slice is used to retrieve only a particular part of the dimension from the more number of dimensions.
d. Pivot: Re-orient the cube for an alternative presentation of the data and Transform 3D view to series of 2D planes [9].
K. Visualization:
Data visualization allows anyone to dispose and present information instinctively. People grasp data better through pictures, graphs, symbols than by reading text information. Visual analysis is a process of getting data, representing it different forms, noticing results and asking follow on questions. On applying filter drill up and drill down operations on the results we can get more summarized results and other information form the single results. Without interactivity, the analyst is left with unanswered questions. With the right interactivity, the data visualization becomes a natural extension of the analyst’s thought process [13]. Data visualization tools provide an interface to represent single information into number of visual formats and theoretical information is visualized in graphical, pictorial representations. By enabling anyone to answer their own questions without needing programming knowledge or specialized skills, the process of analyzing data gets much faster, easier and more insightful.
There are several different types of visual modules that allow the user and the system to interact. In our system the first is the data mining result in the form of decision tree. Decision trees are very effective to represent the mining data as compared to other classification techniques. Another visual module is the concept hierarchy operations which give the results of operations getting the sub node details, leaf nodes, and level wise details of the single path. The pie, bar chart Module provides the user better understanding of results and summarization values without giving any queries on them simply by performing operations through visual interfaces. The pie, bar charts provides the details of percentage of people sick and healthy and the crucial point of the classification attribute that is used for the doctors and researchers to improve patient diagnosis and their research levels [13].
IV. RESULTSANDOBSERVATIONS
Here we performed combing of data mining and online analytical processing together to build a new approach of OLAP mining the data mining techniques that are combined with multidimensional cube generation for better analysis and reports.
Figure6. Generated decision tree
[image:6.595.318.558.303.472.2]Fig 6, shows a text base electronic patient data set with attributes bmi, age, serim, pg. Data set is input for the ID3 decision tree algorithm.On running algorithm a decision tree is generated with diagnosis value of sick or healthy.
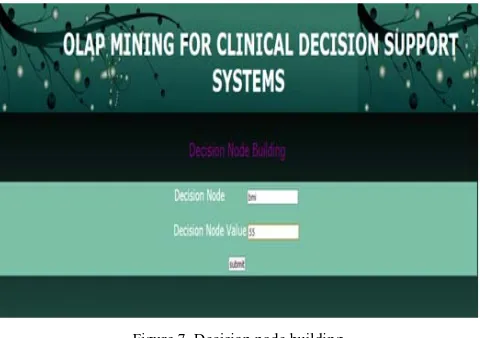
Figure 7. Decision node building
Fig 7 shows decision node and its value is given as input for maintaining decision tree details in the database. These values are used to maintain uniqueness throughout the data.
Figure8. Concept Hierarchy Building
Figure9. Operations On Concept hierarchy
Fig 9 shows The first operation is used for building concept hierarchy which uses a set theory. The input for the concept hierarchy building is the data set existed in the database results with serial numbers in the tree wise manner. Retrieving a full tree, finding all the leaf nodes, retrieving a single path are the operations on the concept hierarchy.The results are based on the levels existed in the tree.
Figure10. Full tree nodes
Fig 10 shows Selecting Full tree details are the one of the option of the concept hierarchy.On selecting the Option of full tree details.The result of the Full tree Nodes.
[image:7.595.41.282.344.580.2]Figure11. OLAP Cube
[image:7.595.319.557.414.613.2]Fig 11 showsthese are the tables which are used for the OLAP cube.This is the snow flake schema which is used for the OLAP cube.We have to maintain a parent child relation from level to level tables.First level attribute should be connected to the parent of the second level to maintain the relation.After successful relationships existence an OLAP cube is generated by using OLAP cube writer.
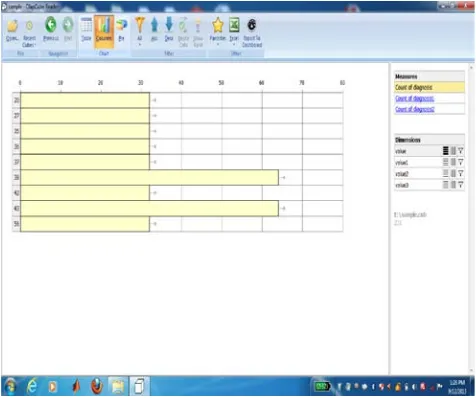
Figure13. Visual Representations of count of diagnosis value
Fig 12, 13, shows after successful OLAP cube building the results are obtained based on the dimensions and measures. A measure of count of diagnosis dimensions of value1 consists of bmi details.A value 38 and 43 have the more count so these are the crucial points to be considered.The representation is based on the user choice like pie chart, bar chart or column based.
V. CONCLUSION
The primary goal of this paper is developing a clinical decision support system for physicians and health care professionalsby using OLAP mining that combines data mining classification technique and Online analytical processing for obtaining benefits of both. This paper is beneficial for health care professionals on obtaining results of how much proportion of patients are diabetic on the whole hospital patients, decisive point of attribute or symptom which is used to improve research on that category of patients. Obtained visualization results by CDSS on performing online analytical processing operations improved clinical environment.
VI. REFERENCES
[1] Chua sook ling. and Sellapan.,Clinical Decision Support System Using OLAP Mining , IEEE faculty of information technology, MNCC Transactions ICT Issue in 2012.
[2] Dr Walid Qassim Qwaider., Apply On-Line Analytical Processing (OLAP) With Data Mining For Clinical Decision Support International Journal of Managing Information Technology (IJMIT) Vol.4, No.1, February 2012.
[3] P.Yasodha, M. Kannan., Analysis of a Population of Diabetic Patients Databases in Weka Tool International Journal of Scientific & Engineering Research Volume 2, Issue 5, May-2011 1ISSN 2229-5518.
[4] NishantMathur, Sumit Kumar, Santosh Kumar, and Rajni Jindal The Base Strategy for ID3 Algorithm of Data
MiningUsingHavrda and Charvat Entropy Based on Decision Tree International Journal of Information and Electronics Engineering, Vol. 2, No. 2, March 2012. [5] Storing Hierarchical Data in a Database…….;Gijs Van
Tulder, April 30,2
[6] Understanding Oracle OLAP Dimensions And Cubes, Mark Rittman.
[7] Improving estimation accuracy of aggregate queries on data cubes, ElahehPourabbas and ArieShoshani, Data & Knowledge Engineering, 2009.
[9] Web Space: Managing hierarchical data in my sql, mike hillyerspersonal web space.
[10] Data Mining Concepts and Techniques,Second Edition by Jiawei Han and MichelineKamber, University of Illinois at Urbana-Champaign, Morgan Kaufmann Publishers is an imprint of Elsevier.
[11] Sanjay Goli ,et al,High Performance Data Mining Using Data Cubes On Parallel Computers, Northwestern University Technological Institute, 2145 Sheridan Road, Evanston IL-60208
[12] Bennett CC and TW Doub. (2010) Data mining and electronic health records: Selecting optimal clinical treatments in practice.Proceedings of the 6th International Conference on Data Mining.pp. 313-318.
[13] A Modular Framework for Clinical Decision Support Systems: Medical Device Plug-and-Play is Critical Williams M, Wu F, Kazanzides P, Brady K, Fackler J Johns Hopkins University, and Baltimore MD 21218. [14] Kim, H. and Loh, W.-Y. 2001, Classification trees with
unbiased multiway splits, Journal of the American Statistical Association, vol. 96, pp. 589-604.
[15] Been-ChianChien and Su-Yu Liao Mining Categorical Concept Hierarchies in Large Databases Department of Information Engineering, I-Shou UniversityKaohsiung 840, Taiwan
[16] Witten, T.H and Frank, E. 2000 Data mining: Practical machine learning tools and techniques with Java implementations. Morgan Kaufmann, San Francisco.
![Figure 1. Model of the system [2]](https://thumb-us.123doks.com/thumbv2/123dok_us/697281.1077437/3.595.55.268.52.264/figure-model-of-the-system.webp)

![Figure 4. CDSS concept hierarchy [5]](https://thumb-us.123doks.com/thumbv2/123dok_us/697281.1077437/5.595.76.246.507.557/figure-cdss-concept-hierarchy.webp)