Volume 3, No. 3, May-June 2012
International Journal of Advanced Research in Computer Science
RESEARCH PAPER
Available Online at www.ijarcs.info
ISSN No. 0976-5697
A Comparative Analysis for Wavelets and ThresholdEstimation Selection for Denoising of
Audio Signals of Some Indian Musical Instruments
Neema Verma*
Electronics and Communication Engg.Department Hindustan Institute of Technology and Management
Keetham, Agra, UP, India. [email protected]
A. K. Verma
Electrical Engineering Department Faculty of Engg.,Dayalbagh Educational Institute
Dayalbagh, Agra, UP, India. [email protected]
Abstract: It is known that noise is present in all communication channels, therefore, the generated signal, when transmitted through these channels, get corrupted. Denoising of such noisy signals without loosing its features is a challenging task. The wavelet based methods has proved to be one of the best tool for denoising purposes. The proper selection of wavelet function and noise estimation algorithm is a complex task. As not all wavelet function and all noise estimation methods work well for all types of signals. In this paper an effort has been made to find a suitable wavelet function and noise estimation method to give good denoising results of audio signals from some Indian musical instruments such as Tabla, Pakhawaj, Flute, Harmonium and Taanpura. For this purpose Haar, Db10, Coif5 and Bior6.8 wavelets are considered and some well known threshold estimation methods i.e.Sqtwolog, SURE (Rigrsure and Heursure) and Minimaxi are considered for comparative analysis. The quality of denoised musical signal is expressed in terms of PSNR as compared to original signals.
Keywords: Wavelets; Denoising; Haar; Db10; Coif5; Bior6.8;Minimaxi;Rigrsure; Heursure; Square-Root-Log.
I. INTRODUCTION
Signal distortion created by noise is the major problem occurring in generation and transmission of signals and therefore, affects the performance of associated systems. Many techniques have been developed for removing noise from signals while retaining details.To achieve the goal of noise reduction without losing much detail, wavelet transform based techniques have shown promising and encouraging results in these areas because of some of their excellent properties like time frequency localization and multi resolution analysis.
Denoising of audio signal of musical instruments has become an important research field. To achieve good audio quality noise reduction of musical signal is desirable. A noise is an unwanted signal which deteriorates the characteristics of original signal. There are various types of noises present in environment such as colored noise, burst noise, White noise etc. This noise signal may occupy either some specific frequency band or entire frequency band. When noise also share the frequency band of signal, then it becomes very difficult to remove this noise without losing some signal information. Therefore, noise removal without losing original features of signal is a challenging task and has become an active area of research. In wavelet based techniques denoising is done by soft and hard thresholding of wavelet coefficients.
In wavelet analysis low frequency coefficients mainly represent signal and high frequency coefficients with randomness represent noise. Denoising is achieved by selecting a threshold for such high frequency coefficients. A
sizable amount of work has been done in area of wavelet based denoising and reported in literature. An effective method based on wavelet transform of signal denoising
utilizing soft thresholding is given in [1]. It suggests that non-linear denoising known as wavelet shrinkage, of high frequencycomponents performs well over conventional frequency selective filter approach. The threshold values for correlated noise signals are calculated by a method proposed by Johnston and Silverman [2]. A modified threshold selection method is reported in [3]. It suggests that high threshold values for audio signals cut part of the original signal too. Another method which improves SNR of a signal in presence of transients and harmonics utilizing block thresholding is proposed in [4]. A multi-wavelet transform method proposed in [5] with appropriate initialization represent signal in a better way than the conventional wavelet thresholding methods. It clearly identifies noise and only the shrinkage function is modified to multivariate shrinkage.
A noise reduction filter is proposed in [6]. It passes the noisy signal to an adaptive prediction filter and first and second signal component is obtained. The first component represents predictable part of noisy signal and second to a prediction error. Both the components are then attenuated according to the signal and noise content level which are further recombined to form enhanced output signal with low delay, low computation and reduced colored and white noise.
signal is further reconstructed with the application of Haar wavelet transform. It gives good denoising performance both in terms of PSNR and audible quality of the audio signal. A performance comparison of various denoising methods is presented in [10]. It suggests Coif5 wavelet and lowest decomposition level to be most appropriate for denoising of speech signals. Also Heursure method is suggested in [11] to give better denoising performance of audio signals from Indian musical instruments. The rest of the paper is organized as follows, section II gives brief introduction to wavelet transform analysis, section III describes denoising schemes, section IV displays the experimental results, section V represents the conclusion and references are given in section VI.
II. DISCRETEWAVELETTRANSFORM
The Wavelet Transform (WT) is a mathematical tool useful in the analysis of signals. Its representation involves the decomposition of the signals in wavelet basis functions
given by,
(1)
Here are called scale and position parameters respectively. If scales and positions are chosen based on powers of two, so called dyadic scales and positions, then analysis becomes much more efficient and just as accurate. It was developed in 1988 by S. Mallat. In this case, wavelet function becomes,
(2)
In orthonormal basis for .For a given function , the inner product then gives the discrete wavelet transform as, [12]
[image:2.612.341.562.60.170.2](3) The multi resolution theory given by S. Mallat and Meyer proves that any conjugate mirror filter characterizes a wavelet that generates an orthonormal basis of , and that a fast discrete wavelet transform is implemented by cascading these conjugate mirror filters. The wavelet decomposition of a signal based on the multi resolution theory can be obtained using digital FIR filters [13]. The FIR filter based wavelet decomposition scheme is shown as shown in figure 1.
Figure 1. One level wavelet decomposition (Analysis)
[image:2.612.342.557.332.454.2]The arrangement shown above has used two wavelet decomposition (Analysis) filters which are High Pass and Low Pass respectively followed by down sampling by 2 producing half of input data point of High and Low frequency. The High frequency coefficients are called Detailed Coefficients (cD) and Low frequency coefficients are called Approximation Coefficients (cA). After decomposition, the signal can be reconstructed back by Inverse Wavelet Transform. The corresponding Filter Bank structure for reconstruction is shown in figure 2.
Figure 2. One level wavelet reconstruction (Synthesis)
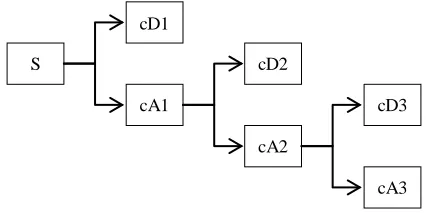
The signal S can be decomposed in several levels. A three level wavelet decomposition tree is shown in figure 3 [14].
Figure 3. Three level wavelet decomposition tree
III. WAVELETDENOISINGSCHEMES
To prevent deterioration in quality of instrumental signals, denoising of the signal is required. Let assume an instrumental signal is corrupted by the noise as
, where is White Gaussian Noise. White Gaussian noise is difficult to remove as it is located at all frequencies.
S
cD1
cA1
cA2 cD2
cA3 cD3
cD
cA
2
2 Detailed
Coefficients
Approximation Coefficients
cD
cA 2
2
Detailed Coefficients
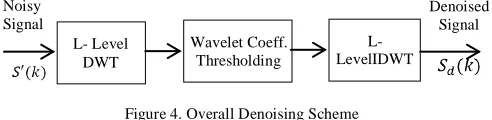
[image:2.612.343.556.525.633.2]The wavelet based overall denoising scheme is shown in figure 4.
Figure 4. Overall Denoising Scheme
As seen from figure 4, the denoising scheme involves three main steps,
a. L-level Wavelet Decomposition of input noisy signal. b. Threshold estimation and thresholding of wavelet
coefficients.
c. L-level Inverse Wavelet Transform for reconstruction of denoised signal.
Wavelet denoising involves thresholding in which coefficients below a specific threshold value are set to zero. It helps in eliminating noise but main characteristics of the original signal are preserved. This is called Hard Thresholding while Soft-Thresholding set the wavelet coefficients to zero which are below threshold as well as it simply shrinks or scales other coefficients which are above the threshold value [1]. Threshold selection is an important process which directly affects the quality of output denoised signal. There are several well-known threshold estimation methods available in literature. Some of them are discussed here briefly. In this paper, performances of four well-known standard threshold estimation methods are investigated for audio signals of Indian musical instruments corrupted by white Gaussian Noise. The effect of wavelet decomposition level (L) is also investigated. These four methods are briefly described as follows:
A. Minimaxi Criterion:
This method finds threshold using minimaxi principle. It uses a fixed threshold to yield minimaxi performance for mean square error against an ideal procedure. The Minimax principle is used in statistics to design estimators. Since the de-noised signal can be assimilated to the estimator of the unknown regression function, the minimaxi estimator is the option that realizes the minimum, over a given set of functions of the maximum Mean Square Error (MSE). This procedure finds optimal thresholds [15]. The threshold is given by:
λ (4)
Where and is the detailed wavelet
coefficient vector at unit scale and is the length of signal vector.
B. Sqtwolog Criterion:
The threshold values ( ) are calculated by universal threshold (square root log) method given by,
(5)
Where, is the length of the noisy signal at scale and is Median Absolute Deviation (MAD) at scale given by,
(6)
Where, represent wavelet coefficients at scale
C. Rigrsure:
It is a soft threshold evaluator of unbiased risk. Suppose is a vector consists of the square of wavelet coefficients from small to large. Select the minimum value (bth ) from risk vector, which is given as,
(7)
as the risk value. The selected threshold is where, is the bthsquared wavelet coefficient (coefficient at minimum risk) chosen from the vector and σ is the standard deviation of the noisy signal.
D. Heursure:
Threshold is selected using a combination of Sqtwolog and Rigrsure methods. If the signal to noise ratio is very small, the SURE method’s estimation is poor. In such case, fixed form threshold of Sqtwolog method gives better threshold estimation [15]. Let threshold obtained from Sqtwolog method is and threshold obtained from Rigrsure is then Heuristic SURE gives the threshold given by,
λ (8)
Where, and .The is length
of wavelet coefficient vector and is the sum of squared wavelet coefficients given as
Threshold determination is an important problem. A small threshold may yield a result which may be noisy and large threshold can cut significant part of signal thus losing the important details of the signal.
IV. EXPERIMENTALRESULTS
As noisy musical test samples, five audio signals each of 10 seconds duration sampled at 8000 samples per second are analyzed for the experiment. These audio signals are taken from Indian musical instruments viz. Tabla, Pakhawaj, Flute, Harmonium and Taanpura. For performance comparison of various methods of denoising, with decomposition level L =2 is selected. The effect of various denoising methods on audio musical samples is investigated. For comparison and measurement of the quality of denoising, the Peak Signal to Noise Ratio (PSNR) is calculated between original musical signal and denoised musical signal given by,
L- Level DWT
Wavelet Coeff. Thresholding
L- LevelIDWT Noisy
Signal
(9)
Where, is maximum value of signal and is given by,
(10)
and MSE is mean Square Error given by,
(11)
[image:4.612.322.580.169.474.2]PSNR values for various musical signals are shown comparatively in table1 to 5.
Table 1: Comparison of PSNR (db) for Tabla at L =2
Method Haar Db10 Coif5 Bior6.8
Sqtwolog 30.605 36.550 36.564 36.486
Minimaxi 30.973 36.609 36.619 36.554
Heursure 33.112 36.746 36.574 36.661
[image:4.612.51.275.239.324.2]Rigrsure 33.349 36.746 36.752 36.659
Table 2: Comparison of PSNR (db) for Pakhawaj at L =2
Method Haar Db10 Coif5 Bior6.8
Sqtwolog 37.076 42.172 42.224 42.117
Minimaxi 37.542 42.232 42.294 42.185
Heursure 39.359 42.319 42.554 42.291
[image:4.612.51.273.358.444.2]Rigrsure 39.359 42.274 42.385 42.248
Table 3: Comparison of PSNR (db) for Flute at L =2
Method Haar Db10 Coif5 Bior6.8
Sqtwolog 31.646 38.299 38.240 38.361
Minimaxi 31.874 38.299 38.240 38.361
Heursure 34.238 38.299 38.241 38.361
Rigrsure 34.271 38.299 38.238 38.343
Table 4: Comparison of PSNR (db) for Harmonium at L =2
Method Haar Db10 Coif5 Bior6.8
Sqtwolog 23.756 32.349 32.506 31.959
Minimaxi 24.560 33.339 33.529 33.058
Heursure 31.384 38.519 38.672 38.505
Rigrsure 31.384 38.519 38.672 38.505
Table 5: Comparison of PSNR (db) for Taanpura at L =2
Method Haar Db10 Coif5 Bior6.8
Sqtwolog 25.393 37.202 37.502 36.333
Minimaxi 26.130 37.213 37.569 36.609
Heursure 31.597 37.645 37.850 37.359
Rigrsure 31.597 37.644 37.848 37.357
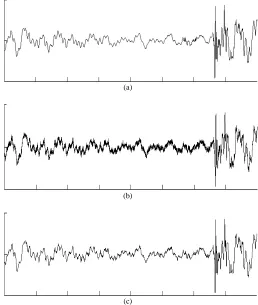
The part of original audiosignal (noise free) of musical instrument Pakhawaj, its noisy version (corrupted by white Gaussian noise) and denoised waveform using Heursure method at level 2 and Coif5 wavelet, are shown in figure 5.
(a)
(b)
(c)
Figure 5. (a) Original noise free signal of Pakhawaj, (b) Signal corrupted by white Gaussian noise, (c) Denoised signal using Heursure at L=2
As it can be seen from the figure 5, the denoised version of sound is much similar to the original noise free sound of pakhawaj and hearing perception is also very good.
V. CONCLUSIONS
In this paper, performance of various wavelet based thresholding methods for denoising of audio signals of some Indian musical instruments viz.Tabla, Pakhawaj, Flute, Harmonium and Taanpura, corrupted by white Gaussian Noise is presented along with comparative analysis of suggesting the
suitable wavelet function. For denoisingwavelet
[image:4.612.51.273.477.553.2] [image:4.612.51.274.588.666.2] [image:4.612.52.272.699.730.2]as compared to other wavelets. The Haar wavelet is performing poorer as compared to others also it gives unwanted distortion in reconstructed voice when heard, as it is not a smooth wavelet. In general, there is slight difference in the performance of Db10, Coif5 and Bior6.8 as all are higher order and smooth wavelets and can be selected for denoising of such audio signals. The results show that the best suitable thresholding method for these specific audio musical signals is SURE method. Both Rigrsure and Heursure are almost equivalent in all cases. Finally it is concluded that the combination of Coif5 and SURE can be efficiently used for better denoising of audio signals of these Indian musical instruments.
VI. REFERENCES
[1] Donoho D. L., Johnston I.M., “De-Noising by soft thresholding”,IEEE Transaction on Information Theory, 1995, Vol. 41(3), pp. 613-627.
[2] Johnston I. M., Silverman B. W., “Wavelet threshold estimators for data with correlated noise”, Journal of Royal Statistical Society, 1997, Series B 59, pp 319–351.
[3] MatkoSaric, LukiBilicic and HrvojeDujmic, “White noise reduction of audio signal using wavelets transform with modified universal threshold”, Proceedings of the 4th WSEAS International Conference on Signal Processing Robotics and
Automation,World Scientific, Wisconsin, USA, 1995.
[4] Guoshen Yu, StephaneMallat and Emmanuel Bacry, “Audio denoising by time-frequency block thresholding”, IEEE Transactions on Signal Processing, Vol. 56, No. 5, 2008.
[5] Tai-Chiu Hsung, Daniel Pak-Kong and K. C. Ho, “Optimizing the multiwavelet shrinkage denoising”, IEEE transactions on Signal Processing, Vol. 53, No. 1, January 2005.
[6] Graham P. Eatwell, “Noise reduction filter”, patent number 5742 694, 21 April 1998.
[7] M. Lmg, H. Guo, J. E. Odegard, C. S. Burrusand R. O.Wells, Jr., “Noise reduction using un-decimated discrete wavelet transform”, IEEE Signal Processing Letters, Vol. 3, No.1, Jan 1996.
[8] Israel Cohen, “Speech enhancement using a non-causal aprioriSNR Estimator”, IEEE Signal Processing Letters, Vol. 11, No. 9, September 2004.
[9] B. Jaishankarand and K. Duraiswamy, “Audio denoising using wavelet transform”, International Journal of Advances in Engineering and Technology, ISSN: 2231-1963, 2012.
[10] A. K. Verma and NeemaVerma, “A comparative performance analysis of wavelets in denoising of speech signals”, Proceedings of IJCA, National Conference of Information Systems and Computer Networks (ISCON), pp. 29-32, ISBN: 973-93-80867-86-3, 2012.
[11] NeemaVerma, A.K. Verma, “Performance analysis of wavelet thresholding methods in denoising of audio signals of some Indian musical instruments”, International Journal of Engineering Science and Technology (IJEST), Vol. 4, No.5, pp. 2040-2045, ISSN 0975-5462, May 2012.
[12] Daubechies Ingrid, “Ten Lectures on Wavelets”, 9e, SIAM, ISBN: 780- 89871-274-2, 2006.
[13] MallatStephane, “A Wavelet Tour of Signal Processing”, 3e, Academic Press, ISBN 978-01-237-4370-1, 2008.