INTRACELLULAR SODIUM AND CONTRACTILE
DYSFUNCTION IN LEFT VENTRICULAR HYPERTROPHY
A thesis
presented to University College London in fulfilment of the regulations
for the degree of Doctor of Philosophy
by
Dr Rosaire Gray MD, MRCP.
ProQuest Number: U642438
All rights reserved
INFORMATION TO ALL USERS
The quality of this reproduction is dependent upon the quality of the copy submitted.
In the unlikely event that the author did not send a complete manuscript and there are missing pages, these will be noted. Also, if material had to be removed,
a note will indicate the deletion.
uest.
ProQuest U642438
Published by ProQuest LLC(2015). Copyright of the Dissertation is held by the Author.
All rights reserved.
This work is protected against unauthorized copying under Title 17, United States Code. Microform Edition © ProQuest LLC.
ProQuest LLC
789 East Eisenhower Parkway P.O. Box 1346
Abstract
Left ventricular hypertrophy (LVH) is associated with the development o f heart failure and arrhythmias. The mechanisms underlying this decompensation are unclear. The hypothesis that LVH is associated with a raised intracellular sodium, [Na^]j which by upsetting the regulation of other intracellular ions impairs the positive staircase was tested.
LVH was induced in guinea-pigs by ascending aortic constriction and the extent of hypertrophy quantified by measuring heart-to-body weight ratio. The control group consisted of sham-operated and unoperated animals. The tension generated in response to increasing stimulation frequency and [Na^]j were measured. The force-ffequency response was depressed and [Na^]j increased from 7.4 ± 1.4 to 12.1 ± 1 .4 mM with LVH. There was a close relationship between the decline of the force-frequency response and the increase o f [Na^]i which was also observed when the [Na^]i was increased with strophanthidin in normal myocardium.
Possible mechanisms to account for the raised [Na^]i are explored. The recovery of a raised [Na'^Ji after an acute acidosis was slowed in hypertrophied myocardium and stabilised at a higher level, suggesting that the membrane mechanisms that regulate
[Na^]i are reset.
Intracellular pH, pHj, and [Ca^^], [Ca^^Ji, were measured in isolated myocytes using epifluoresence microscopy. pH, decreased progressively with increasing severity of hypertrophy and the sarcoplasmic buffering capacity increased with increasing acidosis. The recovery o f pHj from an intracellular acidosis was slowed in myocytes from aortic constricted (AC) hearts but the total H^ efflux rate was not different indicating no effect on Na^-H^-exchange activity.
Resting [Ca^^]i was not significantly different in myocytes from AC hearts but the caffeine induced release of [Ca^^] from the sarcoplasmic reticulum (SR) was reduced. The time course o f the decay phase of the caffeine was prolonged in myocytes from AC hearts indicating reduced activity o f the Na^-Ca^^-exchanger.
Acknowledgement
This thesis would not have been completed without the help and support o f colleagues and friends to whom I would now like to express my sincere thanks.
In particular I would like to thank the following:
Professor Chris Fry, my supervisor for guiding me, with infinite patience in my study of the cellular pathology of myocardial hypertrophy. I am indebted to him for his enthusiasm and advice, his friendship and support, leading to the completion of this thesis.
Professor James Malone-Lee, my clinical supervisor, who provided endless support and encouragement to enable me to complete this thesis.
Mark Turner for his technical expertise, advice and help.
Phil Eaton for his technical expertise, endless advice and support with the Western blots
My colleagues in the laboratory, especially Dr Richard Wu, Dr Gui-Ping Sui, Valerie Proctor, Dr Peter Carey and Dr Alf Botchway who gave freely of their time, help and advice and made research a rich and enjoyable experience.
A special thanks to Dr Vidya Mohamed-All for her support and encouragement.
CONTENTS
Title 1
Abstract 2
Acknowledgement 3
Contents 4
List of Figures 12
List of Plates 19
List of Tables 20
List of abbreviations 24
Chapter 1. Introduction 28
1. Clinical pathology of left ventricular hypertrophy 28
1.1. Electrophysiological changes in hypertrophy 31
1.2. Gap junctions 33
1.2.1. Connexin proteins in hypertrophy 33
1.3. Contractile function in myocardial hypertrophy 34
1.3.1. Force-frequency relationships in hypertrophy 36
1.4. Excitation-contraction coupling 37
1.5. Mechanisms underlying rate-dependant changes in contractile force 43
1.5.1. Intracellular ions and contractile function 43
1.5.1.1. Role of intracellular Ca^^ 43
1.5.1.2. Role of intracellular Na^ 43
1.5.2. Mechanical restitution 45
1.5.2.1. Mechanical restitution in hypertrophy 46
1.5.3. Post-rest potentiation 46
1.5.4. Effect o f strophanthidin 47
1.6. Intracellular ions in myocardial hypertrophy 47
1.6.1. Intracellular Na^ in hypertrophy 48
1.6.1.1. Functional implications of the rise in [Na^]i 48
1.6.2. Intracellular Ca^^ in hypertrophy 49
1.6.3. Sarcoplasmic reticulum function in hypertrophy 50 1.6.4. Intracellular pH, pHj, in hypertrophy 52
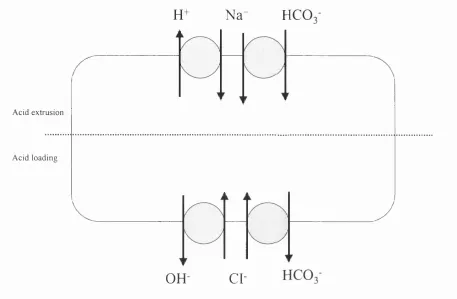
1.7. Regulation of intracellular pH, pH| 52
1.7.1. Cellular mechanisms for control of pHj in mammalian myocardium 53 1.7.2. Membrane transport systems controlling pH, 53
1.7.3. Physico-chemical buffering, p 54
1.8. Membrane proteins and channels in hypertrophy 55
1.8.1. The Na^-K^-ATPase pump 5 5
1.8.1.1. Na^-K^-ATPase pump function in hypertrophy 56 1.8.1.2. Na^-K^-ATPase pump isoform expression in hypertrophy 58 1.8.1.3. Physiological relevance of changes in isoform expression 58 1.8.1.4. Sarcoplasmic reticulum Ca^^-ATPase (SERCA2) expression
in hypertrophy 60
1.8.3. The sarcoplasmic reticulum release channel, the ryanodine receptor,
in hypertrophy 61
1.8.4. Na^-Ca^^-exchanger expression in hypertrophy 63
1.8.5. Calcium channels in hypertrophy 65
1.8.6. The Na^-H^-exchanger 67 1.8.6.1. The Na^-H^-exchanger in hypertrophy 6 8
1.9. Summary 69
1.10. Hypotheses 71
Chapter 2. Methods 72
2.0. General protocol 72
2.1. The experimental model of left ventricular hypertrophy 72
2.1.1. Details of the animals used 72
2.1.2. Anaesthesia, intubation and ventilation 72
2.1.3. Incision and operation 73
2.1.4. Recovery 74
2.1.5. Regression of left ventricular hypertrophy 74
2.2. Solutions and chemicals 75
2.3. Isolated preparations 75
2.3.1. Tension recordings 76
2.3.2. Experimental procedures 79
2.4. Preparation of ion-selective microelectrodes 80
2.4.1. Manufacture of Ag/AgCl electrodes 81
2.4.2. Preparation of microelectrodes 83
2.4.3. Preparation of reference electrodes 83
2.4.4. Preparation of Na^-selective microelectrodes 83
2.4.5. Connections to recording devices 84
2.4.6. Description o f headstage 84
2.5. Cell isolation 90
2.5.1. Langendorff perfusion method 90
2.6. Measurement of intracellular pH (pH,) by epifluorescence microscopy 92
2.6.1. Intracellular pH fluorescent indicator 92
2.6.2. Intracellular loading of BCECF 93
2.6.3. The experimental set-up 93
2.6.4. Experimental procedure 96
2.6.5. Calibration of the BCECF fluorescence signal 96
2.6.6. Data storage and analysis 97
2.7. Intracellular buffering capacity 97
2.7.1. Calculation of extracellular [N H /], [N H /]o 98 2.7.2. Calculation of intracellular [NH4^], [N H /]i 99 2.7.3. Estimation of intracellular buffering capacity 100
2.8. N a e x c h a n g e turnover 101
2.8.1. Rate of pHj recovery from acid load 101
2.8.2. Calculation of acid-equivalent efflux 101
2.9. Measurement of intracellular Ca^^ by epifluorescence microscopy 102
2.9.1. Intracellular Ca^^ fluorescent indicator 102
2.9.2. Intracellular loading of Fura-2 103
2.9.3. Calibration of the Fura-2 fluorescence signal 103 2.9.3.1 In vitro determination of the Fura-2 dissociation constant 103 2.9.4. Estimation of sarcoplasmic reticulum Ca^^ content 104
2.10. SDS-PAGE Western blots 105
2.10.1. Sample preparation 106
2.10.2. SDS-PAGE (sodium dodecyl sulphate-polyacrylamide gel
electrophoresis) / W estem blotting 106
2.11. Statistical analysis 109
Chapter 3. Results 110
3.1. Assessment of magnitude of hypertrophy produced by aortic-constriction 110
3.1.1. Measurement of heart-to-body weight ratio 110 3.1.2. Regression of left ventricular hypertrophy 112
3.2. Mechanical properties of the isolated myocardial preparation 113
3.2.1. The force-frequency relationship 113
3.2.1.1. The force-frequency relationship and heart-to-body
weight ratio 117
3.2.2. Post-rest potentiation 119
3.2.3. Effect of regression of LVH on contractile function 120
3.2.4. Summary 120
3.3. Contractility and strophanthidin 121
3.3.1. The inotropic response to strophanthidin 121 3.3.2. The effect of strophanthidin on the force-frequency relationship 122 3.3.3. The effect of strophanthidin on post-rest potentiation 123
3.3.4. Summary 126
3.4. The effect of reduced external [Na] on contractile function 127
3.5. The effect of increased extracellular [Ca] on contractile function 128
3.6. Summary 129
3.7. Intracellular Na^ concentration, [Na^ji and hypertrophy 129
3.8. Summary 137
3.9. Measurement of intracellular pH, pHi 138
3.9.1. Measurement of pHi in isolated cells 138
3.9.2. Effect of hypertrophy on [pH]i 139
3.9.3. pHj as a function o f heart-to-body weight ratio 139
3.10. Determination of intracellular buffering capacity 140
3.10.1. Theory of measurement of P 140
3.10.2. Determination of non-bicarbonate intracellular buffering
capacity, pi 141
3.10.3. pi in cells from control and aortic-constricted hearts 141
3.10.4. Correlation of pi with pHi 143
3.10.5. Determination o f bicarbonate and non-bicarbonate intracellular
buffering capacity, ptot 143
3.10.6. ptot in cells from control hearts 146
3.10.7. Bicarbonate dependent buffering, pco2 146
3.10.8. Correlation of ptot with pHi 146
3.11. pHi recovery from intracellular acidosis 147
3.11.1. Calculation of the non-bicarbonate dependent pHi recovery rate 147 3.11.2. Calculation of the bicarbonate and non-bicarbonate dependent
pHi recovery rate 149
3.12. Calculation of sarcolemmal acid flux (Jh) 150
3.12.1. Non-bicarbonate acid-equivalent flux in myocytes from control
and aortic-constricted hearts 150
3.12.2. Non-bicarbonate acid-equivalent flux in myocytes from control
hearts 151
3.13. Summary 155
3.14. Measurement of intracellular [Ca^"^], [Ca^^ji 156
3.14.2. Effect o f hypertrophy on resting [Ca^^Jj 156 3.14.3. Effect o f hypertrophy on SR content 156 3.14.4. Effect o f reduced external Na on SR Ca^^ content 161 3.14.5. Estimation of the rate of Ca^^ efflux 165 3.14.6. Effect o f reduced external [Na] on the rate o f Ca^^ efflux 168
3.14.7. Refilling of the SR 169
3.14.8. Summary 171
3.15. Na^-K^-ATPase pum p isoforms 172
3.15.1. Quantitative immunoblotting 172
3.15.2. Calsequestrin in hypertrophy 172
3.15.3. a-isoform expression in hypertrophy 172
3.16. The sarcoplasmic reticulum Ca^^-ATPase pum p (SERCA2) 175
3.17. Sum m ary 176
C hapter 4. Discussion 177
4.1. Methods 177
4.1.1. The model o f hypertrophy 177
4.1.2. Measurement of intracellular [Na^] using ion-selective
microelectrodes 179
4.1.3. Epifluorescence microscopy and determination of intracellular pH 184 4.1.3. Limitations of epifluorescence microscopy for determination of
pHi and buffering capacity 185
4.1.5. Use o f Fura-2 to measure [Ca^^ji 188
4.1.6. Use o f isolated myocytes 189
4.1.7. SDS-PAGE Western blots and the Na^-K^-pump isoforms 191
4.2. Results 191
4.2.1. Mechanical function in hypertrophy 191
4.2.2. The rise o f [Na^], and the force-ffequency relationship in
4.2.3. Effects of reduced [ N a ]o on the force-frequency relationship 197
4.2.4. Mechanisms underlying the rise o f [Na^]i in hypertrophy 198 4.2.4.1. Role of the Na^-K^-ATPase pump in the rise
of [Na^]i in hypertrophy 198
4.2.5. pHi in hypertrophy 203
4.2.6. Mechanisms underlying intracellular acidosis in hypertrophy 205 4.2.7. Functional implications of the fall in pHj in hypertrophy 206 4.2.8. Intracellular buffering capacity in hypertrophy 207 4.2.9. Characterisation of recovery from aeid-load in normal
guinea-pig myocytes 208
4.2.10. [Ca^^ji in hypertrophy 208
4.2.11. Caffeine and SR calcium content 209
4.2.12. The SR Ca^^-ATPase (SERCA2) pump in hypertrophy 212
4.3. Conclusions 213
5.0. References 214
List of Figures
Figure 1.1. Schematic diagram showing the events during excitation-contraction
coupling 41
Figure 1.2. Schematic representation o f the ion pumps and channels involved in the
regulation of [Ca^^Ji and [Na^], 42
Figure 1.3. Schematic representation of the sodium dependence of twitch tension 44
Figure 1.4. Model of pHj control in the ventricular myocyte 54
Figure 2.1. Diagram of the superfusion apparatus 77
Figure 2.2. Calibration of tension transducer at a fixed recording gain 78
Figure 2.3. Schematic representation o f a microelectrode selective for Na^ is shown in (A) and the experimental arrangement is shown in (B) 81
Figure 2.4 Manufacture of Ag/AgCl electrodes. In the upper panel (A), the procedure for cleaning Ag wire is shown and in the lower panel (B), the procedure for coating the Ag wire with AgCl is shown 82
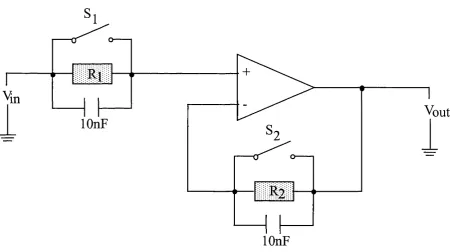
Figure 2.5. Headstage for ion-selective microelectrodes comprising isolation
amplifier AD 204 and clock driver AD 246 85
Figure 2.6. The arrangement for measuring the input bias currents at the non inverting and inverting inputs of an op amp 86
Figure 2.7. Schematic representation o f the experimental arrangement for measurement of intracellular [Na^] using ion-selective microelectrodes 87
Figure 2.8. Calibration of a Na^-selective microelectrode using calibrating solutions
Figure 2.9. Calibration of Na^-selective microelectrode. The potential difference
recorded is plotted against log [Na] 90
Figure 2.10. A schematic representation of the experimental set-up for epifluoresence
microscopy 95
Figure 3.1. Relationship between heart-to-body weight ratio and duration of ascending aortic clip placement (n=60 animals) 111
Figure 3.2. Steady-state isometric tension expressed as a function of stimulation frequency in preparations from control (open circles) and aortic-
constricted (filled circles) guinea-pigs 114
Figure 3.3. Steady-state isometric tension as a function o f stimulation frequency in
aortic-constricted hearts 116
Figure 3.4. The force-frequency relationship (T(i.6/0.8)) as a function o f heart-to-body weight ratio in isolated preparations from control and aortic-constricted
hearts 118
Figure 3.5. (A) Heart-to-body weight ratios (HER) and (B) force-frequency relationships (T(i.6/0.8)) from unoperated LV, sham-operated LV, moderate (HER 4.0 to 5.5 g.kg'\ n=21) and severe hypertrophy (HER>5.5 g.kg'\
n=19) 118
Figure 3.6. Post-rest tension and heart-body weight ratio in left ventricular papillary muscles from control (open circles) and aortic-constricted hearts (filled
circles) 119
Figure 3.7. The inotropic response to strophanthidin in isolated preparations from control (open circles) (n=18) and aortic-constricted (filled circles) (n=9)
guinea pig hearts 122
aortic-constricted (filled circles) hearts 123
Figure 3.9. Comparison of the force-frequency response in control and aortic
constricted guinea-pigs 124
Figure 3.10. Post-rest tension in the presence o f strophanthidin in isolated preparations from control (open circles) and aortic-constricted (filled circles) hearts
125
Figure 3.11. The inotropic response to reduced extracellular [Na] in isolated preparations from control guinea-pig hearts 127
Figure 3.12. The effect of reduced extracellular [Na] on the force-frequency relationship (T(i ,6/0.8)) in isolated preparations from control hearts 128
Figure 3.13. AEm recorded by a KCl-filled microelectrode and a Na^-sensitive microelectrode on superfusing the preparation with 40 mM KCl Tyrode's
solution 130
Figure 3.14. Calibration o f Na^-selective microelectrodes in mixed NaCl and KCl
solutions 131
Figure 3.15. Relationship between intracellular [Na^] and heart-to-body weight ratio 133
Figure 3.16. Intracellular [Na^] measured using ion-selective microelectrodes in isolated papillary muscles from unoperated and sham-operated left ventricle, moderate hypertrophy (HER 4.0-5.5 g.kg'^) and severe
hypertrophy (HER >5.5 g.kg'^) 134
Figure 3.17. The relationship between the force-frequency response (T(i,6/0.8)) and
Figure 3.18 Recordings of [Na^]i and membrane potential, Em, from A: a sham-operated animal and B: an aortic-constricted animal 136
Figure 3.19. Measurement and intracellular calibration o f pHj in an isolated myocyte 138
Figure 3.20. The relationship between pHi and heart-to-body weight ratio 140
Figure 3.21. Derived plot o f pHj in a myocyte isolated from an aortic-constricted heart following application of lOmM NH4CI and its subsequent removal in the
absence and presence of ImM amiloride 142
Figure 3.22. Relationship between p, and heart-to-body weight ratio 144
Figure 3.23. Relationship between pi and steady-state pHj 145
Figure 3.24. Relationship between ptot and steady-state pH| of individual cells isolated
from control hearts 147
Figure 3.25. Relationship of Ptot (filled triangles) and pi (open circles) and steady-state pHi in myocytes isolated from control hearts 148
Figure 3.26. The rate of recovery of pHi on NH4CI removal in the absence of amiloride in a myocyte from a control heart (A) and from an aortic-constricted heart
(B) 148
Figure 3.27. Non-bicarbonate dependent efflux rate as a function of intracellular pH at the commencement o f acid extrusion in 6 8 myocytes isolated from control hearts (open circles) and 2 1 myocytes from aortic-constricted
hearts (filled circles) 151
Figure 3.29. Effect of 1 mM amiloride and reduced external Na^ on recovery from
NH4CI induced acidosis in a myocyte from a control heart 153
Figure 3.30. Bicarbonate and non-bicarbonate dependent efflux rate as a function of intracellular pFl at the commencement o f acid extrusion in 68 myocytes
isolated from control hearts 154
Figure 3.31. efflux rate as a function of intracellular pH in myocytes isolated from
control hearts 154
Figure 3.32. Resting [Ca^^Ji in isolated myocytes from control and aortic constricted hearts measured using the fluorescent indicator Fura-2 157
Figure 3.33. Derived plot of a caffeine transient from a control (continuous line) and an aortic-constricted (broken line) heart 158
Figure 3.34. Relationship between SR calcium content, measured in isolated myocytes as the increase in [Ca^^Ji produced on application of 10 mM caffeine, and
heart-to-body weight ratio 161
Figure 3.35. Derived plot of the effect of reduced external Na concentration (29 mM NaCl Tyrode's) on [Ca^^]i measured using the fluorescent indicator, Fura- 2 and plotted as the ratio of fluorescence emitted at 340:380 nm in a
myocyte from an aortic-constricted heart 164
Figure 3.36. Derived plot of the effect of altering external Na concentration on [Ca^^ji measured using the fluorescent indicator, Fura-2 and plotted as the ratio of the fluorescence output at 340/380 nm in a myocyte isolated from a
sham-operated heart 164
Figure 3.37. Time constant of the decay of the caffeine transient in a myocyte from a control heart (A) and a myocyte from an aortic-constricted heart (B)
Figure 3.38. Relationship between the time constant of the recovery phase of the caffeine transient (xi) and heart-to-body weight ratio 167
Figure 3.39. Time constant (xi) of the recovery phase o f the caffeine transient after KCl-induced-depolarisation and reducing external Na in myocytes from control (open circles) and aortic-constricted (closed circles) hearts 169
Figure 3.40. Relationship between the time constant of the recovery phase of the undershoot of the caffeine transient (x:) and heart-to-body weight ratio
170
Figure 3.41. Densitometric quantification of western blot analysis of calsequestrin in right (RV) and left ventricular (LV) samples from sham-operated, aortic constricted (AC) and debanded (deb) guinea-pig hearts 173
Figure 3.42. Immunological detection of the ai-isoform of the Na^-K^-ATPase pump 174
Figure 3.43. Densitometric quantification of western blot analysis of the ai-isoform of the Na^-K^-ATPase pump in right (RV) and left ventricular (LV) samples from sham-operated, aortic constricted (AC) and debanded (deb) guinea-
pig hearts 174
Figure 3.44. Densitometric quantification of western blot analysis of the ag-isofbrm of the Na^-K^-ATPase pump in right (RV) and left ventricular (LV) samples from sham operated, aortic constricted (AC) and debanded (deb) guinea-
pig hearts 175
Figure 3.45. Densitometric quantification of western blot analysis o f SERCA2 pump in right (RV) and left ventricular (LV) samples from sham operated, aortic constricted (AC) and debanded (deb) guinea-pig hearts 176
sham-operated hearts, moderate LVH (HBR 4.0-5.5 g.kg'^) and severe
LVH (HER >5.5 g.kg^) 193
Figure 4 .2 . Membrane potential (Em) and equilibrium potential for Na^-Ca^^exchange
(ENa-Ca) 196
Figure 4.3. Values o f [Na^]i (filled circles) and pH, (open circles) in unoperated and sham operated hearts, moderate LVH (HBR 4.0-5.5 g.kg'^) and severe
List of plates
Plate 1. Tension generated in response to increasing stimulation frequency from 0.8 to 1.6 Hz in a papillary muscle from a sham-operated heart in A and
an aortic constricted heart in B 115
Plate 2. The effect o f addition and removal of NH4CI on pH, in a myocyte from a
sham-operated animal 142
Plate 3. In A the increase in [Ca^^]i in response to 10 mM caffeine in a myocyte from a sham-operated heart is illustrated. In B the increase in [Ca^^Ji in response to 40mM KCl is illustrated followed by a caffeine response in
another cell from a sham-operated heart 159
Plate 4. Change in [Ca^^Ji in response to superfusion with reduced external Na solution and 10 mM caffeine in a myocyte from a control heart 163
Plate 5. Change in [Ca^^]i in response to 10 mM caffeine before and during superfusion with reduced external [Na] solution plotted as 340:380
List of Tables
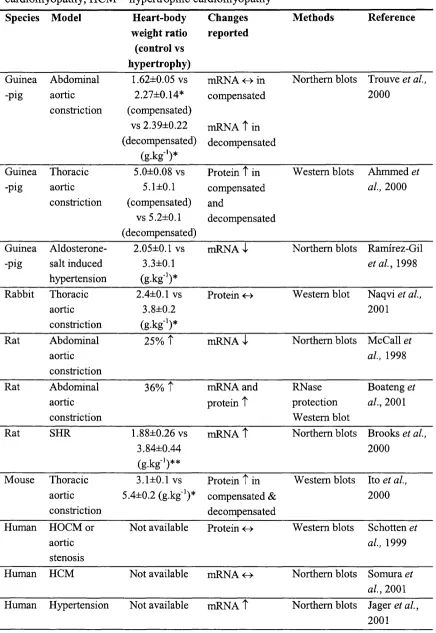
Table 1.1. Studies of Na^-K^-ATPase pump function in hypertrophy 57
Tablel.2. Summary o f studies of Na^-K^-ATPase pump isoform expression in
hypertrophy 59
Table 1.3. Summary o f studies of the SR Ca^-ATPase (SERCA2) expression in
hypertrophy 61
Table 1.4. Summary of studies of Na^-Ca^^-exchanger expression in hypertrophy 64
Table 2.1. Composition of normal Tyrode's solution 76
Table 2.2. Composition of low-Na Tyrode's solution 79
Table 2.3. Combination of normal and low-Na Tyrode's solutions 80
Table 2.4. Calibrating solutions for Na^-selective micro electrodes 89
Table 2.5. Nominal calcium free Tyrode’s solution 91
Table 2.6. Composition of Kraftbriihe (KB) solution 92
Table 2.7. Composition of solutions used for calibration of BCECF signal 97
Table 2.8. Composition of 10 mM HEPES-buffered Tyrode’s solution 100
Table 2.9. Composition of HEPES and bicarbonate-buffered Tyrode's solutions with
reduced [Na^] 102
Table 2.10. Composition of solution used to mimic the intracellular environment 104
Table 2.12. Details of the specific antibodies used to detect the a-isoforms of the
Na^-K^-ATPase pump, SERCA2 and calsequestrin 108
Table 3.1. Effect of ascending aortic constriction on heart weight and heart-to-body
weight ratio in all animal groups 112
Table 3.2. Effect o f removal of the ascending aortic constriction on heart weight and
heart-to-body weight ratio 112
Table 3.3. Force-ffequency relationships (T(i.6/o,8)) and heart-to-body weight ratios in isolated papillary muscles from control and aortic-constricted guinea-pig
hearts 117
Table 3.4. Force-frequency relationships (T(i.6/0.8)), post-rest tension and heart-to-body weight ratios in LV papillary muscles from debanded and sham-
sham operated guinea-pig hearts 120
Table 3.5. Effect of strophanthidin on post-rest tension in control and
aortic-constricted guinea-pig myocardium 125
Table 3.6. The effect o f increased extracellular [Ca] on contractile function and the force-frequency relationship (T(i ,6/0.8)) in isolated myocardium from
control hearts 129
Table 3.7. Heart-to-body weight ratios and intracellular [Na^] measured using ion-selective microelectrodes in isolated papillary muscles from control and
aortic-constricted hearts 132
Table 3.8. Changes in pHj and the rate of recovery o f pH, on NH4CI removal in the absence of amiloride in bicarbonate- and HEPES-buffered Tyrode's
solution 149
Table 3.10. Change of [Ca^^Ji during exposure to 40 mM KCl in isolated myocytes measured using the fluorescent indicator, Fura-2 161
Table 3.11. Change of [Ca^^]i on application of 10 mM caffeine (after a brief exposure to 40 mM KCl) in isolated myocytes measured using the
fluorescent indicator, Fura-2 161
Table 3.12. Change of [Ca^"^]i during superfusion with reduced external Na solution (29 mM NaCl Tyrode's) in isolated myocytes measured using the
fluorescent indicator, Fura-2 163
Table 3.13. Change of [Ca^^Ji on application of 10 mM caffeine (after superfusion with reduced external Na solution (29 mM NaCl Tyrode's)) in isolated myocytes measured using the fluorescent indicator, Fura-2 166
Table 3.14. Peak and nadir o f [Ca^"^]i and the time constant of the decay of the caffeine response (after a brief exposure to 40 mM KCl) in isolated myocytes. [Ca^"^]i measured using the fluorescent indicator, Fura-2 168
Table 4.1. Summary of published values for [Na^]i in muscle strips, isolated myocytes and intact heart
Table 4.2. Effect o f temperature, species and the method o f measurement on [Na 183
Table 4.3. Summary of values for pH, in muscle strips, isolated myocytes and intact
heart 186
Table 4.4. Summary of values for resting [Ca^^]i in muscle strips, isolated myocytes
and intact heart 190
Table 4.5. Studies of [Na^]i in myocardial hypertrophy 195
Table 4.7. Summary of values of pHj in hypertrophied myocardium 204
List of Abbreviations p pi Ptot All AC AE AL AM ANP AP APD ATP BCECF °C [Ca'"], CAPSO CICR Cx Dahl Deb
A [C a'"]i
DIDS DOCA DTT ECG ECL EDTA EGTA Eca Eise Em
cellular H" buffering capacity (mequiv.l'\pH unit‘d)
intrinsic cellular H" buffering capacity (mcquiv.l ^pH unit’’) combined bicarbonate and intrinsic cellular H" buffering capacity (m cquiv.f\pH unif^)
angiotensin II aortic constricted anion exchanger aldosterone
acctoxymctbylcstcr atrial natriuretic peptide action potential
action potential duration adenosine triphosphate
2',7'-bis(carboxyetbyl)-5(6)-carboxyfluorescein centigrade
intracellular calcium concentration
3-[cyclobexylamino]-2-bydroxyl-1 -propanesulpbonic acid calcium induced calcium release
connexin
deoxycorticostcronc-acctate salt sensitive hypertension debanded
change of intracellular Ca'" concentration
4,4'-diisotbiocyanoto-stilbene-2,2'-disulpbonic acid deoxycorticosterone-acetate
ditbiotbreitol electrocardiogram
enhanced cbemiluminescenee ethylene diamine tetra-acetic acid
ethylene glycol-bis-(P-aminoetbyl ether) N,N,N',N'-tetra acetic acid electrochemical gradient for Ca'"
Ene ENa.Ca fA FET g HBR HCM HEPES HOCM HRP Hz Ica Ica(TTX) ISE Jh KB Kd kg 1 LV LVH MES mm nm M min ml pi mM I^M ms mV
L V dP/dtmax
n
Na^ equilibrium potential
equilibrium potential for the Na^-Ca^^-exchanger femptoamps
Field effect transistor gram
heart-to-body weight ratio hypertrophic cardiomyopathy
N-[2-hydroxyethyl] piperazine-N'-[2-ethanesulphonic acid] hypertrophic obstructive cardiomyopathy
horseradish peroxidase hertz
L-type Ca^^ channel current
Tetrodotoxin-inhibitable voltage-gated Ca^^ conducting Na^ channel ion-selective micro electrode
acid-equivalent efflux Kraflbriihe dissociation constant kilogram litre left ventricle
left ventricular hypertrophy
2-[N-morpholino] ethane-sulphonic acid millimetre nanometre molar minutes millilitre micro litre millimolar micromlar millisecond millivolt
[Na1,
[N a^ o
NHE ns Q 3-OMFPase op amp PBS PCR pd pHi pHo pNPPase PVDF r R RT-PCR RV RVH SA S.D SDS SDS-PAGE secs S.E.M SERCA SHR SNARE SR Tl %2 T TTX V
intracellular Na^ concentration extracellular Na^ concentration Na^-H^-exchanger
not significant Ohm
K-dependent 3-0-methylfluorescein phosphatase operational amplifier
phosphate buffered saline polymerase chain reaction potential difference intracellular pH extracellular pH
K-dependent paranitrophenyl phosphatase activity polyvinyl difluoridine membrane
correlation coefficient ratio of fluorescent outputs
reverse transcription polymerase chain reaction right ventricle
right ventricular hypertrophy sino-atrial
standard deviation sodium dodecyl sulphate
sodium dodecyl sulphate-polyacrylamide gel electrophoresis seconds
standard error of the mean
sarcoplasmic reticulum Ca^^-ATPase spontaneously hypertensive rat carboxyseminaphthorhodafluor sarcoplasmic reticulum
time constant of the recovery phase of the caffeine transient
time constant of recovery of the undershoot of the caffeine transient tension
vs versus
wt weight
w/v weight/volume
^^P-NMR proton-decoupled phosphorus-31 magnetic resonance spectroscopy [i]i intracellular concentration of an ion, i
Chapter 1 : Introduction
Left ventricular hypertrophy (LVH) is an adaptive process that enables the heart to compensate for an increased mechanical load such as aortic stenosis or systemic hypertension. However, in population studies the presence o f electrocardiographic or echocardiographic LVH is associated with increased mortality due to ventricular arrhythmias (Levy et al., 1987) and heart failure (Levy et a l, 1990). Studies in animal models suggest that there is a gradual transition from compensated hypertrophy to decompensation and heart failure (Siri et al., 1989; Capasso et al., 1990). A similar transition is seen in patients with systemic hypertension and aortic stenosis in whom gradual chronic pressure overload of the left ventricle results in myocardial hypertrophy with subsequent dilatation and heart failure.
The mechanisms underlying this decompensation remain unclear but preliminary evidence suggests that the changes are gradual, originating in the compensated phase of hypertrophy and represent alterations to cell physiology that underlie electrical and mechanical dysfunction. Regression of LVH after removal o f the abnormal load is well documented (Ikonomidis et a l, 2001; Sleight et al., 2001). It is therefore, of clinical importance to ascertain the properties of hypertrophied myocardium that develop and which if left untreated result in a decline in cardiac function. A better understanding of the primary mechanisms involved in the response o f the heart to chronic pressure overload may facilitate the development of new therapeutic modalities, as well as the development of better guidelines for the prevention of cardiac hypertrophy.
1. Clinical pathology of left ventricular hypertrophy
The myocardium has a remarkable ability to alter its structure in response to sustained changes in haemodynamic load. Physiological or pathological circulatory changes that result in a sustained increase in load, eventually result in an increase in heart weight. Growth occurs to normalise wall stress where wall stress is described by Laplace's Law as
Under physiological conditions such as growth or aerobic training, cardiac output is maintained by an increase in stroke work. Chamber radius increases and wall stress rises. However, with time myocardial growth occurs and wall thickness increases until wall stress is normalised. The hypertrophy produced is proportional to the increase in chamber size demanded by the increase in stroke work. The hypertrophy is mild and left ventricular function is preserved.
Pathological conditions such as aortic valve stenosis and systemic hypertension also produce a sustained increase in afterload. Left ventricular pressure increases to overcome the resistance to ejection and wall stress increases. Myocardial growth occurs to normalise wall stress by becoming thicker without an increase in radius. As a result there is symmetrical thickening of the ventricular walls at the expense of cavity size. This process is referred to as concentric left ventricular hypertrophy.
It is now recognised that even during the compensated phase of hypertrophy there are changes to the normal physiology of the myocardium. Impaired diastolic relaxation is the earliest evidence o f dysftmction in LVH (Topol et al., 1985). As the hypertrophied ventricle becomes stiller, ventricular filling is impaired (Cuocolo et al., 1990). However, as hypertrophy progresses systolic ftmction also becomes impaired, the ventricle begins to dilate and stroke volume falls. This decompensation is associated with increased sympathetic tone and activation of the renin-angiotensin system in an attempt to compensate for the reduced cardiac output. This decompensated phase is recognised clinically as congestive cardiac failure. It represents the end-stage of the disease process when irreversible structural changes have already occurred. Heart failure is associated with considerable mortality and morbidity, with a median survival of 1.7 years in men and 3.2 years in women (Lloyd-Jones, 2001).
greater metabolic disadvantage and hypoxia following brief periods of ischaemia especially during increased cardiac work in hypertrophied myocardium (McAinsh et al.,
1995).
In addition to mechanical dysfunction, other changes occur to muscle physiology during the process of hypertrophy which affect the electrophysiology of the myocardium and present clinically as sudden death. The Framingham study showed that both electrocardiographically (Kannel et a l, 1975) and echocardiographically (Haider et al.,
1998) detected LVH are associated with an increased risk o f sudden death that was in excess of the risk attributable to hypertension or other associated cardiovascular risk factors (Kannel & Sorlie, 1981). Sudden death is a recognised consequence of ventricular fibrillation or ventricular tachycardia in almost all monitored cases. Electrocardiographic (McLenachan et al., 1987) and echocardiographic (Levy et al.,
1987) evidence o f LVH are associated with an increased risk of simple and complex ventricular arrhythmias. Mortality is increased in subjects with asymptomatic ventricular arrhythmias and echocardiographically determined LVH (Bikkina et a l, 1993).
The susceptibility of the hypertrophied myocardium to ventricular arrhythmias appears to be independent of myocardial ischaemia (Szlachcic et al., 1992), however, in the presence of ischaemia, hypertrophy further increases the risk o f arrhythmias (Aronow et a l, 1988). Regression of LVH is associated with a reduced risk of arrhythmias (Messerli
et a l, 1989) but studies to date are too small to determine the effect o f regression on sudden cardiac death. These observations suggest that there is a primary abnormality in hypertrophy that predisposes to arrhythmias.
Mechanisms o f ventricular arrhythmias include automaticity, triggered activity and re entry. Both automaticity and triggered activity give rise to aberrant pacemaker activity via early and late afterdepolarisations, which are thought to be produced by electrophysiological mechanisms operating at the level of the single cell. Re-entry is a function of multicellular tissue which occurs when propagation o f the action potential from cell to cell is impaired. Re-entry is thought to be the most important mechanism in ventricular tachycardia. The requirements for producing re-entry in cardiac muscle include unidirectional block and décrémentai conduction. Several factors have been proposed to exacerbate re-entrant excitation, including anisotopic conduction and small scale discontinuities (about 100 pm) in the conduction pathway (Spach et a i, 1981; Spach & Heidlage, 1995).
1.1. Electrophysiological changes in hypertrophy
The most widely reported electrophysiological change associated with hypertrophy is prolongation of the action potential duration (APD). Prolonged APD has been reported in rats (Gulch et al., 1979; Aranson, 1980; Thollon et al., 1989; Stilli et a l, 2001), guinea-pigs (Nordin et a l, 1989), cats (Kleiman & Houser, 1988) and rabbits (Bril et a l,
1991) using isolated superfused papillary muscles (Gulch et al, 1979; Aronson 1980) and isolated myocytes (Kleiman & Houser, 1988; Nordin et a l, 1989; Ahmmed et a l,
findings is that isolated myocardial tissue is frequently studied at very low stimulation frequencies and since stimulation frequency has a marked influence on action potential duration the changes observed may be related to the stimulation conditions. This explanation is supported by the absence of action potential prolongation in hypertrophied myocytes paced at higher stimulation frequencies (Nordin et al., 1989; Davey et al.,
2001).
Non-uniform prolongation of action potential may also be proarrhythmic by increasing dispersion of repolarisation or refractoriness and favouring re-entry. LVH has also been reported to produce regional differences in electrophysiological effects with prolongation of APD in epicardial but not endocardial cells seen both in isolated cells (Hicks et a l,
1995; Bryant et ah, 1997) and whole hearts (Wolk et al., 2000). Increased dispersion of ventricular repolarisation as measured by the difference between the maximum and minimum monophasic APD on the epicardial surface has also been demonstrated in hypertrophy (Gomez et al., 1997a; Gillis et a l, 1998) and this effect is more marked in ischaemia (Wolk et a l, 2000). Acute myocardial ischaemia increases APD dispersion between the normal and ischaemic zones in rat hearts and regression o f LVH reduces this electrical inhomogenity (Kohya et a l, 1995).
Delayed ventricular activation, indicated by prolongation o f the QRS duration on the electrocardiogram (EGG) is a recognised feature of LVH in man (Winterton et a l, 1994). In patients with echocardiographically documented LVH, programmed electrical stimulation shows significant prolongation of infra-nodal conduction and an increased incidence of non-sustained ventricular tachycardia (Coste et a l, 1988). Delayed conduction time has been demonstrated in isolated preparations from guinea-pigs (Winterton et a l, 1994) and humans (McIntyre & Fry, 1997) with LVH. Accentuation o f the conduction delay was also observed during ischaemia (Winterton et a l, 1994; Cooklin et a l, 1998). This is likely to increase the arrhythmogenic potential in hypertrophied myocardium as slowed conduction is important in creating conditions necessary to sustain re-entrant arrhythmias.
conditions (Cooklin et a l, 1998). If the increase in gap junction resistance is sufficient (above 1 0 0 0 Q cm) it will delay propagation at the gap junctions and increase the likelihood of unidirectional block and re-entrant arrhythmias by discontinuous propagation (Quan & Ruddy, 1990). Even, if hypertrophy alone were not sufficient to generate discontinuous propagation, the increased susceptibility of the hypertrophied heart to ischaemia would further increase gap junction resistance so that the combination of hypertrophy and ischaemia would be effective in increasing the incidence o f such abnormal electrical activity.
The normal pattern o f anisotropic conduction in ventricular myocardium, by which conduction parallel to the longitudinal axis of the myocyte is up to 4 times faster than that along the transverse axis is altered in LVH; the anisotropic ratio was reduced largely due to a reduction in longitudinal conduction velocity (Carey et a l, 2001). More recently using a three dimensional map of intracellular resistance we have shown that local discontinuities of current flow on a millimetre scale which would be sufficient to increase susceptibility to re-entrant mechanisms are more prevalent in hypertrophied myocardium (Fry et a l, 2001).
1.2. Gap junctions
The changes in conduction velocity observed in hypertrophy may result from remodelling and / or redistribution of gap junctions. The normal pattern o f anisotropic conduction in ventricular myocardium described above is dependent on the low- resistivity o f the gap-junction membranes, their distribution, and their abundance. Gap junctions include a hexagonal array of proteins called connexins, which provide electrical coupling between cells. Three connexins, 43, 40 and 45 are expressed in mammalian heart and the predominant one is connexin 43 (Cx43). In normal myocardium, gap junctions are predominantly located at the axial ends o f ventricular myocytes and form end-to-end connections.
1.2.1. Connexin proteins in hypertrophy
hypertrophied rat hearts made hypertensive by renal artery clipping or deoxycorticosterone / salt administration (Haefliger et al., 1997) and moreover increased Cx43 protein has been reported in the early phase of hypertrophy due to renovascular hypertension in guinea-pigs (Peters et a l, 1993a). Rather than a change in the number of connexins, an altered pattern of distribution may occur. Disturbed Cx43 gap junction distribution has been shown to correlate with the location of re-entrant circuits in the epicardial border zone of healing canine infarcts (Peters et a l, 1997). In the hypertrophied left ventricle of aortic-banded rats, redistribution of Cx43 from the longitudinal to the transverse axis has been demonstrated (Emdad et a l, 2001). Similar redistribution was observed in pressure overload-induced right ventricular hypertrophy in rats in association with alteration of anisotropic conduction properties (Uzzaman et a l,
2000) similar to those reported by Carey et al (2001). Gap junction conductance is also influenced by the state of phosphorylation (Moreno et a l, 1994) with phosphorylation of Cx43 reducing conductance and changes in cytoplasmic metabolism such as intracellular acidosis (Firek & Weingart, 1995) and an increase in intracellular Ca^^, [Ca^^ji, (Maurer & Weingart, 1987) also reducing conductance. As discussed later changes to intracellular pH and Ca^^ have been described in hypertrophy.
1.3. Contractile function in myocardial hypertrophy
Studies of contractile function in animal models o f hypertrophy are conflicting. These conflicting findings may be due to the particular model studied, the age of the animal at the time of the insult, differences in the response of the right and left ventricle to pressure-overload, the duration o f pressure-overload, the degree of hypertrophy produced or the way in which contractile function was measured.
the effect on peak tension, the isometric tension profile and in particular the relaxation phase is prolonged (Gwathmey & Morgan, 1985; Yoneda et al., 2001).
In LVH studies are also conflicting. In isolated myocytes from the spontaneously hypertensive rat (SHR) (Delbridge et a l, 1996), and in rats with abdominal aortic- constriction contractile function was depressed (McCall et al., 1997). In left ventricular myocytes from severe hypertrophy in the cat, reduced contraction amplitude, longer duration of contraction and reduced velocity of both contraction and relaxation were observed (Bailey & Houser, 1992). In severe but not mild hypertrophy secondary to aortic banding in the guinea-pig, a decrease in peak tension was associated with slowed tension development (Lecarpentier et al., 1987). Other studies, however (Capasso et al.,
1982; Flesch et al., 1997; Milnes & MacLeod, 2001) show no effect on peak isometric tension generation, but prolonged time to peak tension and reduced shortening velocity. In isolated myocytes from guinea-pigs with mild LVH induced by infra-renal aortic banding, contraction size was increased and time-to-peak contraction and half-relaxation time were both prolonged (Davey et al., 2001). In intact ventricles from pigs subjected to pressure-overload indices of contractile function were normal (Wisenbaugh et al.,
1983), whereas in ferrets with LVH both systolic and diastolic function were impaired (Bentivegna et a l, 1991) and in rats with abdominal aortic-constriction increased systolic function was observed from early to late stages of hypertrophy (Ohkusa et al., 1997). In one study, SHR's showed normal systolic function until the later stages of hypertrophy when it was depressed (Mirsky et a l, 1983), whereas in other studies both enhanced (Shorofsky et al., 1999; Mill et al., 1998) and reduced (Wise et al., 1998) contractility were observed in this model. It is important to point out that like the electrophysiological investigations, many o f these studies were carried out at low pacing rates and there is little information on cardiac function in hypertrophy at more physiological heart rates.
cell rather than a mechanically normal cell contracting in an abnormal interstitial environment (Mann et al., 1991).
In 1871, Bowditch et al noted that in contracting myocardium the interval between beats was one of the most important factors that determined the strength of contraction. This allows quantification of contractile function independent o f preload and afterload (Anderson et al., 1973) and can be studied by investigating the strength of contraction (i) in relation to the preceding stimulus interval, mechanical restitution and (ii) in response to sequential increase in the frequency of stimulation, the force-ffequency relationship.
To describe the various force-interval relationships in myocardium, Koch-Weser and Blinks (1963) introduced the abstract terms of positive and negative inotropic effects of activation. Increasing stimulation frequency can cause a positive effect on contractility by increasing sarcoplasmic reticulum (SR) Ca^^ load or a negative effect due to refractoriness of excitation-contraction coupling. The balance between these factors will determine whether the force-frequency response is positive, negative or biphasic, i.e. a combination of both. Normal ventricular myocardium from humans and most animal species demonstrates a positive force-frequency relationship i.e. increasing stimulus frequency increases contractility, whereas in failing myocardium a negative relationship is found (Mulieri et al., 1992; Davies et al., 1995; Pieske et al., 1999). Negative force- frequency relationships are also seen in rat and ferret ventricle and in atrial myocardium (Koch-Weser & Blinks, 1963; Wang et a l, 1993). The negative force-frequency relationship has been attributed to the short action potential duration typical of rat ventricular muscle and atrial tissue, however, in human myocardium a negative force- frequency response has been observed despite the presence o f long action potentials (Mubagwa et al., 1994).
1.3.1. Force-frequency relationships in hypertrophy
hypertrophy, cell shortening was greater at frequencies less than 1 2 0 beats per minute and tended to decrease with increasing frequencies (Sipido et al., 2000).
1.4. Excitation-contraction coupling
Excitation-contraction coupling qualifies a process by which voltage changes induce Ca^^ movement that originates both from the external milieu and from internal stores. During depolarisation Ca^^ influx is mediated by the dihydropyridine sensitive, voltage- activated L-type Ca^^ channels and Na^-Ca^^-exchange. During repolarisation Ca^^ efflux occurs through Na^-Ca^^-exchange that couples the efflux of 1 Ca^^ to the influx of 3 Na^. This efflux o f Ca^^ is electrogenic without direct energy expenditure and tends to depolarise the cell. This Na^ influx together with the Na^ influx through the Na"^ channel increases intracellular [Na^], [Na^]i, which is in turn controlled by the Na^-K^- ATPase which causes Na^ efflux in exchange for K"^ and is closely linked to the Na”^- Ca^^-exchanger. The amount of Na^ necessary to account for the rapid depolarisation phase of the action potential in cardiac cells is small, approximately 1 nmol.f^ cell water (Pike et al., 1993).
The internal stores o f Ca^^ are located in the SR where the concentration o f Ca^^ is much higher than in the rest of the intracellular space. Ca^^ needs energy to enter the SR and utilises Ca^^ ATPase. The release of Ca^^ from the SR is under the control o f a Ca^^ channel, called the ryanodine receptor. The external Ca^^ entering the cell activates the Ca^^ release channel, giving rise to the phenomenon of Ca^^-induced Ca^^-release (CICR). The two principal sources of Ca^^ that may provide the activating calcium for CICR are the sarcolemmal dihydropyridine sensitive, voltage-activated L-type Ca^^ channels and the Na^-Ca^^-exchanger. Under normal circumstances the major source of Ca^^ to trigger CICR is Ca^^ entry via the L-type Ca^^ channels. The resulting rise in intracellular [Ca^^], [Ca^^Ji is too small to activate the myofilaments but can trigger a larger release of Ca^^ from the SR. The potential role of Ca^^ entry via other mechanisms such as reverse mode Na^-Ca^^-exchange is discussed below.
L-type channels are responsible for the majority of Ca^^ that enters the cardiac cell during the plateau phase of the action potential. The T-type Ca^^ channels activate at more negative potentials and have faster kinetics. T-type Ca^^ channels are present in all types of cardiac cells but are more prevalent in atrial cells, sino-atrial (SA) node cells and Purkinje cells and are thought to play a role in pacemaker activity. Evidence in normal ventricular myocardium suggests that Ca^^ influx through T-type Ca^^ channels cannot trigger normal phasic contractions (Bouchard et al., 1993).
The threshold level of intracellular Ca^^ that causes Ca^^-induced Ca^^-release is approximately 0.5 pM (Fabiato & Fabiato, 1978). However, the amount of Ca^^ released from the SR is not simply determined by the amount of Ca^^ that enters the cytoplasm but also by the rate of increase (Fabiato & Fabiato, 1978). The local control hypothesis of excitation-contraction coupling proposes that Ca^^ influx causes a local increase in [Ca^^Ji, in diffusion-limited subsarcolemmal spaces (called the 'restricted space') where the T-tubules and junctional SR are in close proximity. This promotes Ca^^ binding to and opening of the Ca^^ release channel (the ryanodine receptor) in the junctional SR and the resulting SR Ca^^ release causes the cytosolic Ca^^ transient. In keeping with this hypothesis detailed ultrastructural studies have demonstrated a close physical relationship between the sarcolemmal L-type Ca^^ channel, the Na^-Ca^^-exchanger, and the ryanodine receptor in the junctional SR (Carl et a l, 1995; Sun et a l, 1995).
Application of laser scanning confocal microscopy and Ca^^-sensitive fluorescent indicators to myocardial cells has made it possible to measure local non-propagating elevations of [Ca^^Ji, called Ca^^ sparks, at the level o f individual sarcomeres (Cheng et al, 1993). These Ca^^ sparks represent the release o f Ca^^ from one or a cluster of SR Ca^^ release channels (ryanodine receptors) triggered by the opening o f a single L-type Ca^^ channel. (Shachlock et a l, 1995; Santana et a l, 1996). Recent evidence confirms that Ca^^ sparks sum independently to produce the whole-cell Ca^^ transient (Cleemann
The L-type current is the major trigger for Ca^^ release, however other triggers have been suggested. It has been proposed that Na^ entry into the ’restricted space’ during the action potential, rapidly increases the local intracellular Na^ concentration, which activates the Na^-Ca^^-exchanger in the reverse direction generating an inward Ca^^ flux that then triggers the release of from the SR. The direction o f the Ca^^ fluxes produced by Na^-Ca^^-exchange depends on the electrochemical gradients for Na^ (ENa), and Ca^^ (Eca) and the membrane potential (Em). For an electrogenic 3 Na^ for 1 Ca^^ exchange: E^aCa = SE^a - 2Eca- In cardiac muscle cells the reversal potential is readily encountered under physiological conditions and can be changed by small changes in [Na^]i. Accordingly when the membrane potential is depolarised strongly or when intracellular Na^ is elevated, reverse-mode Na^-Ca^^ exchange activity can increase myoplasmic Ca^^.
Reverse-mode Na^-Ca^^ exchange has been demonstrated in feline (Nuss & Houser, 1992) and guinea-pig (Kohmoto et al., 1994; Levi et al., 1994b) ventricular myocytes. However, studies in the rat suggest that the release o f SR thought to be due to reverse-mode Na^-Ca^^-exchange is more likely due to loss of voltage control either throughout the cell or in the T-tubules (Bouchard et al., 1993). Furthermore, Ca^^ entry via reverse-mode Na^-Ca^^-exchange does not trigger Ca^^ sparks but rather a slow increase in intracellular Ca^^ (Lopez-Lopez et al., 1995) and the contractions initiated are slow (Nuss & Houser, 1992) with a delayed onset o f the Ca^^ transient (LeBlanc & Hume, 1990). It is possible that there are species differences in the role o f the reverse mode of the Na^-Ca^^-exchanger in the initiation of contraction in the normal heart and the exchange may become important in pathological conditions or if intracellular Na^ is elevated. Recently, increased Ca^^ influx via the exchanger, contributing to SR Ca^^ loading has been described in dogs with LVH (Sipido et al., 2000) and in rabbit heart after myocardial infarction (Litwin & Bridge, 1997).
A TTX-inhibitable, voltage-gated Ca^^ conducting Na^ channel (Ica(T T X )) has been
et al, 1995) but whether it plays a role in excitation-contraction coupling under physiological conditions is unclear.
Recently, it has been postulated that a component of SR Ca^^ release in mammalian cardiac muscle is activated by changes in membrane voltage. However, on present evidence it seems unlikely that this voltage-sensitive Ca^^ release mechanism has an important role to play in excitation-contraction coupling (Wier & Balke, 1999).
The target for the released Ca^^ is the contractile apparatus composed of thin filament proteins including the troponin complex. The transient rise in [Ca^^]i, initiates a series of chemical events with cross-bridge formation, which result in cell shortening and or the generation of force. A schematic representation o f the events during excitation- contraction coupling is shown in figure 1.1. The magnitude o f the force developed by cardiac muscle is largely a function of the sarcoplasmic [Ca^^], and changes to the sensitivity of the contractile proteins to Ca^^ are of little importance (Lecarpentier et a l,
1987). A reduction in myosin ATPase activity has been shown in rats with LVH (Capasso et al., 1982), and in rabbits (Maughan et a l, 1979) and cats (Carey et a l, 1978) with right ventricular hypertrophy but not in guinea-pigs (Waldenstom et a l, 1985), pigs (Wisenbaugh et a l, 1983) or humans (Mercadier et a l, 1983).
Ca^+
N a'
Ca2+
SR
Ài
1. Influx of Ca?^ via membrane channels during the action potential both directly contributes to the rise in [Ca^^Ji and via;
Ca^^ induced release from the SR
3. Ca^^ binds to the myofibrils initiating contraction
4. Relaxation occurs by Ca^^ release from the myofibrils consequent upon reduction of
2.
5.
[Ca^'^Ji due to;
2+
Ca^^ uptake by the SR Ca^^-ATPase 6. Ca^^ uptake by the mitochondria (M) and 7. Transfer to the SR
Ca^^ efflux via Na^-Ca^^ exchange. The net level o f [Ca^^]j is maintained by this exchange and by
9. Ca^^ extrusion via the sarcolemmal Ca^^-ATPase2+
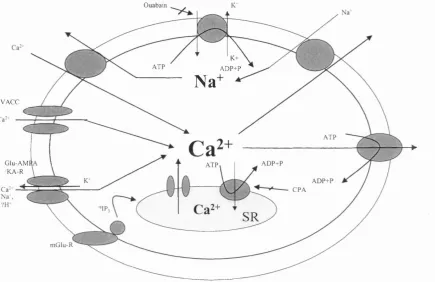
membrane in regulating sarcoplasmic [Ca^^] varies with species and tissue type (Fabiato & Fabiato, 1979; Cooper & Fry, 1990). In comparison with humans and large mammals, rodents have a higher dependence on SERCA2 relative to Na^-Ca^^-exchange (Bassani et al., 1994a; Bers et al., 1996). A schematic representation of the ion channels and pumps involved in the regulation of [Ca^’^Jj and [Na^]j is shown in figure 1.2.
Ouabain
K+ A D P + P A T P
N a
V A C C
Ca--A T P G lu -A M f
/K A -R
A D P + P
A D P + P C P A .'IP;
SR m G lu -R
Figure 1.2. Schematic representation of the ion pumps and channels involved in the regulation of [Ca^^Jj and [Na^],
1.4.1. 'Ca overload'
Increasing [Ca^^ji generally results in an increase in tension development. However, under some conditions, developed tension decreases and this fall in tension is described as 'Ca overload'. When calcium levels are progressively elevated, the SR begins to release calcium in oscillatory pulses during diastole and there is a progressive fall in developed tension (Allen et al., 1985a). The fall in tension is presumably due to less Ca^^ available for release in systole rather than reduced sensitivity of the contractile proteins to Ca^^ in 'Ca overload'. Furthemiore, if sufficient amounts of calcium are released during oscillations, the Na^-Ca^^-exchanger will be activated and since this
exchange is electrogenic it generates an inward current that causes after depolarisations that in turn may contribute to arrhythmias.
1.5. Mechanisms underlying rate-dependant changes in contractile force
1.5.1. Intracellular ions and contractile function
1.5.1.1. Role o f intracellular
The positive inotropic effect of increasing stimulus frequency is mediated by changes in [Ca^^Ji. As stimulation frequency increases the intracellular calcium transient during twitch contraction also increases (Allen & Blinks, 1978). Ca^^ entry through the Ca^^ channels may increase progressively with increase o f stimulation frequency and more Ca^^ may accumulate in the SR and be available for release during twitch contraction. The time available for efflux from the cell during diastole is reduced at higher stimulation frequencies resulting in a net gain of [Ca^^Jj.
Further support for the hypothesis that the contractile response during changes in stimulation frequency is dependent on the state of calcium loading o f the cell comes from the study of Frampton et al (1991b). In rat cardiac myocytes demonstrating a positive force-frequency response an increase in systolic Ca^^, diastolic Ca^^ and the amount of Ca^^ available for release from the SR was observed with increase in stimulation frequency. However, in cells showing a negative force-frequency response, systolic Ca^^ decreased or remained unchanged and the amount of Ca^"^ that could be released from the SR was unchanged.
1.5.1.2. Role o f intracellular Na^
During the action potential [Ca^^Ji rises from -150 nM to IpM (Shattock & Bers, 1989) but the influx o f Na^ by I^a is small (1 nmol.l'^ cell water). Intracellular Na^ is typically 6 - 8 mM but may rise by several mM and result in an increase in contractility as for example after inhibition of the Na^-K^-ATPase pump. An increase in stimulation frequency has also been shown to increase [Na^]i (Cohen et al., 1982; Harrison et al.,
al., 1988). The rise of [Na^]i is believed to result in an elevation of [Ca^^]i via Na^-Ca^^- exchange.
The Na^-Ca^^-exchanger can move Ca^^ either inward or outward depending on the magnitude of the electrochemical gradient for Na^. An increase of [Na^]i will decrease the Na^ gradient across the sarcolemma and thereby attenuate the Ca^^ efflux through Na^-Ca^^-exchange in diastole and increase Ca^^ influx during systole. This augments the cellular calcium load, and more Ca^^ is available for release during each contraction leading to a larger [Ca^^]i transient, thus contributing to the positive force-frequency response seen in most species. This is also the mechanism o f the positive inotropic action o f cardiac glycosides. A schematic representation o f this is shown in figure 1.3. Therefore, a rise in [Na^]i might contribute to the preservation of myocardial contractility in compensated hypertrophy as the increased [Na^Jj would enhance Na^-Ca^^ exchange, thereby increasing and contractility.
T Cà a lly onlSà'*'-C^-exchangp dun% systde
► TDiastolic Œ ^ tSRChiçtalæ ► TSRCkndease ► tSystdic Ck ► Tlensicn
Figure 1.3. Schematic representation of the sodium dependence o f twitch tension
The equilibrium potential for the Na^-Ca^^-exchanger, ENa.Ca, is given by the difference between the equilibrium potential for each ion (ENa.Ca = 3ENa-2Eca). In normal myocardium, during diastole E^a.ca —50mV and as the membrane potential, Em, is — 8OmV, Ca^^ extrusion by the exchanger operating in 'forward' mode will be thermodynamically favoured. In contrast when Em is more positive than E^a.ca, as for example during depolarisation when the rise in membrane potential during the action potential exceeds the rise in E^a.ca secondary to sarcolemma Ca^^ influx, the exchange reverses and Ca^^ influx is thermodynamically favoured. When [Na^]j is elevated, the Ewa.ca falls, reducing the driving force for Ca^^ extrusion thereby elevating and consequently tension. This mechanism provides a theoretical basis for the observed species differences in response to alteration in stimulation frequency. The point at which the exchange reverses will be dictated by the duration o f the action potential relative to that of the Ca^^ transient. This provides a possible explanation for the negative force- frequency relationship in those animals where [Na'^Jj is elevated as Ca^^ gain at rest and loss during repetitive activity will be favoured (Shattock & Bers, 1989).
1.5.2. Mechanical restitution
As well as the state of calcium loading of the cell, the recovery of the processes that lead to contraction may play a role in the response of cardiac muscle to changes in stimulation frequency. Mechanical restitution describes the recovery o f myocardial contractility during the interval between beats. The processes responsible for the initiation of muscle contraction take a finite time to recover and if a stimulus occurs before this process is complete, contractile force will be reduced.
The processes underlying mechanical restitution remain uncertain but it seems to be largely dependent on the circulation of intracellular Ca^^; an altered sensitivity o f the myofilaments to Ca^^ does not appear to play a role in intact myocardium (Mclvor et al.,
trigger for release but this is unlikely to be the case in human or guinea-pig myocardium (Cooper & Fry, 1990). (ii) a delay in the transfer of calcium within the SR from the uptake sites in the longitudinal eistemae to the release sites in the terminal cristae (Wier & Yue, 1986; Seed & Walker, 1988) (iii) refractoriness o f the SR release channels (Wier & Yue, 1986) and (iv) transiently enhanced uptake by the SR after the Ca^^ transient (Sehouten, 1990), so that in a subsequent release o f Ca^^ from the SR, more is taken back immediately into the SR and less enters the cytoplasm to activate the myofilaments.
1.5.2.1. Mechanical restitution in hypertrophy
In hypertrophied human myocardium from patients with aortic stenosis, peak isometric tension and rates of development and relaxation o f tension were not significantly different from non-hypertrophied human myocardium (Cooper et al., 1992). However, mechanical recovery of the myocardium between beats was slower in the hypertrophied myocardium and correlated with the degree o f hypertrophy measured echocardiographically (Cooper et al., 1992). A similar finding has been reported in cats with right ventricular hypertrophy (Anderson et al., 1977), however, mechanical restitution was faster in guinea-pigs with LVH secondary to infra-renal aortic banding (Davey et al., 2001).
1.5.3. Post-rest potentiation