Craig Moodie 1
Running Head: COMMON CONNECTIVITY PHENOTYPES IN RBD AND PD
Common Connectivity Phenotypes in Rapid Eye Movement Sleep Behavior Disorder and Parkinson’s Disease: The Search for an Intermediate Phenotype
Craig A. Moodie1, Kelvin O. Lim2,3 , Bryon A. Mueller3, Laura S. Hemmy3, Michael J.
Howell4, Paul J. Tuite4
1 Department of Psychology, Stanford University
2 Department of Neuroscience, University of Minnesota Medical School
3 Department of Psychiatry, University of Minnesota Medical School
4 Department of Neurology, University of Minnesota Medical School
Corresponding Author: Paul J Tuite, 516 Delaware Street S.E. Minneapolis, MN 55455, [email protected]
Number of words for Abstract: 200
Number of words for Article Body: 3755
Number of Figures: 8
Number of Tables: 0
Abstract
Rapid eye movement sleep behavior disorder (RBD) is often prodromal to
Parkinson’s disease (PD). Thus there should be detectable in vivo functional
signatures shared between RBD and PD that aid in disease classification. To assess
common in-vivo phenotypes, resting state data was collected on a 3T clinical MRI
platform and a novel functional connectivity magnetic resonance imaging (fcMRI)
approach, which combined independent component analysis (ICA) and graph
theory, was used to evaluate deficits in interconnectivity among 15 PD, 14 RBD and
13 control participants. Whole brain and network-level analyses revealed the
largest deficits in network connectivity in PD compared with controls, with less
severe differences between RBD and controls. Importantly, the network-level
analysis demonstrated decreased network interconnectivity, with the greatest
aberrant networks in PD, and a subset in RBD. Additionally, a disease classification
algorithm predicted PD cases by being trained on RBD cases with 0.87 sensitivity
and 0.68 specificity. The functional alterations in cortical networks in RBD extended
beyond the brainstem. These findings demonstrate progressive reductions in
connectivity between brain networks, with less severe deficits in RBD than PD.
Moreover, RBD phenotypes can be used to predict PD status in a cross-sectional
sample, which suggests RBD is an intermediate phenotype.
Word Count: 200
Keywords:
Introduction
Parkinson’s disease (PD) is a neurodegenerative disorder characterized by
progressive deposition of abnormal alpha-synuclein aggregates (i.e.,
synucleinopathy) that affects 1% of the population over the age of 60 years (Samii,
Nutt, & Ransom, 2004). Several lines of evidence suggest that PD initially affects
structures that relate to non-motor features such as the olfactory bulb: hyposmia,
enteric plexus: constipation, and pons: rapid eye movement behavior disorder
(RBD). Subsequently, the substantia nigra is affected which leads to the classic
motor features, followed by cortical pathology resulting in cognitive decline (Borek,
Amick, & Friedman, 2006; Braak, Ghebremedhin, Rub, Bratzke, & Del Tredici, 2004;
Luk et al., 2013).RBD, a disorder of dream enactment, is often the heralding clinical
feature of PD. Under non-pathological conditions, REM sleep is characterized by
active mentation combined with skeletal muscle paralysis. In RBD, REM atonia is
lost and patients will act out their dreams, often violently with thrashing, punching,
and kicking. Previous studies have demonstrated that approximately 50% of
individuals with RBD convert to PD or another synucleinopathy within a decade of
diagnosis (Iranzo, Santamaria, & Tolosa, 2009; Postuma, Aarsland, et al., 2012;
Schenck, Boeve, & Mahowald, 2013). Further, RBD combined with other non-motor
features, such as anosmia and/or constipation, increase the risk of early conversion
(Bezard & Fernagut, 2014).
Structural magnetic resonance techniques such as diffusion tensor imaging
(DTI) have identified abnormalities in PD (Cho et al., 2010; Vaillancourt et al., 2009)
functional MRI has also demonstrated functional connectivity abnormalities in PD,
for instance in the default mode network (van Eimeren, Monchi, Ballanger, &
Strafella, 2009), fcMRI techniques are just now being applied to RBD (Ellmore et al.,
2013) and have not been applied to comparisons of the two disorders.
Dopamine-dependent differences in functional connectivity between the basal ganglia and
cortex have also been found in PD (Williams et al., 2002; Yu, Liu, Wang, Chen, & Liu,
2013), and similar differences have also been reported for associations between
several other brain regions, particularly cortical regions related to motor
functioning (Sharman et al., 2012; Wu et al., 2011). It has been shown that these
imaging phenotypes can predate the onset of impairments such as recognition
memory deficits and, hence, imaging methods are being developed for in vivo
classification of PD (Ibarretxe-bilbao et al., 2011; Long et al., 2012; Morales et al.,
2012; Prodoehl et al., 2013).
As RBD is a prodromal syndrome of PD, we sought to evaluate alterations in
connectivity among participants with RBD compared to PD as well as controls.
Additionally, we sought to utilize ICA and graph theory as the means of capturing
the functional networks and assessing their interconnectivity. ICA has been utilized
as a powerful data-driven tool for deriving intrinsic connectivity networks (ICNs)
from functional data, and graph theory has recently been used to describe the
complex interactions between brain regions (Smith, 2012). Hence, the combination
of these methodologies allows for the examination of the morphology and
connectivity of the ICNs underlying the common phenotypes in PD and RBD, and
interested in whether the connectivity profile present in RBD could be used as an in
vivo clinical classifier of disease state, as this provides a potential means for
developing a tool for the early identification of PD in pre-motor or presymptomatic
Materials and Methods
Participants
Fifteen individuals with PD, 14 individuals with idiopathic RBD and 13
controls (16 females, 26 males, mean age 60.0 ± 11.5) were included in this analysis
from a larger sample recruited for a 123I-Ioflupane (DaTSCAN) study to evaluate
individuals with PD and those at risk for developing PD. The Institutional Review
Board of the University of Minnesota approved all protocols and all participants
gave informed consent before participating in the study. All participant information
was de-identified at the beginning of the study and all participants were
pre-screened using exclusionary criteria for both PD and idiopathic RBD.
All participants were initially assessed using the Unified PD Rating Scale
(UPDRS)-based criteria (Poewe, Rascol, Sampaio, Stebbins, & Goetz, 2003). In
addition, the enrolled PD patients all met the research diagnostic criteria
established by the Queen Square Brain Bank (Brooks, 2012; Massano & Bhatia, 2012). All PD patients were medicated at the time of the study and did not have
notable sleep disturbances. All RBD patients were diagnosed with a clinical history
of dream enactment along with an in laboratory polysomnogram confirming REM
sleep without atonia (AASM, 2001). RBD patients were excluded if the onset of
dream enactment coincided with use of serotonergic antidepressant medication.
Additionally, participants were excluded if they presented with a clinically
significant acute or unstable physical or psychological disease on screening or in
their history. In addition, exposure to investigational or radiological drugs within
subjects who were enrolled did not have a first degree relative with PD and were
without a significant central nervous system neurological condition.
MR Acquisition and Imaging Parameters
A resting-state functional scan, a field map and high resolution T1 weighted
anatomical images were acquired on a 3T Siemens TIM Trio MRI scanner using the
system standard 12-channel receive-only head coil. For the resting state BOLD fMRI
acquisition (EPI; TR=2000ms, TE=30ms, voxel size=3.4x3.4x4mm, matrix
size=64x64, 34 AC-PC aligned single oblique axial slices with interleaved slice
acquisition, 260 volumes, 9 min) the participants were instructed to close their eyes,
remain awake, and not think about anything in particular. A field map acquisition
(TR=300ms, TE=1.94/4.40ms, voxel and orientation matching fMRI scan, 1 min)
was acquired just after the resting state scan. A structural T1-weighted image
(MPRAGE, TR=2530ms, TE=3.65ms, TI=1100ms, flip angle=7 degrees, voxel
size=1x1x1mm, 11 min) was collected and used for the anatomical registration of
the functional scans.
Image Data Preprocessing
All data were preprocessed and analyzed with the FMRIB FSL 4.1.9 software
(http://www.fmrib.ox.ac.uk/fsl). Preprocessing included the exclusion of the first 3
volumes to allow for magnetization stabilization, motion correction with the
MCFLIRT linear registration algorithm (Jenkinson, Bannister, Brady, & Smith, 2002),
B0 unwarping, interleaved slice-timing correction, brain extraction using the BET
kernel, and pass temporal filtering. The images were registered to
high-resolution T1 anatomical images and the MNI 2mm brain image using FLIRT.
FMRI Image Data Analysis
Intrinsic Connectivity Network (ICN) Generation
Data-driven ICA components were derived from the EPI functional scans
using the FSL’s temporal concatenation independent component analysis (TICA)
software in the MELODIC ICA toolkit (Beckmann & Smith, 2004). This probabilistic
TICA algorithm was used to generate global spatial maps and timeseries from the
full matrix of voxel signals from scans from all participants. The MELODIC algorithm
was constrained to thirty (30) components, which allowed for the standardization
of the total number of components generated at the group and participant levels.
The resulting components were subjected to a permutation procedure, which
diminished any initial random value and participant-order effects (Wisner, Atluri,
Lim, & MacDonald III, 2013).
The global ICA-derived components were then visually inspected and
components that did not include neuronal signal, such as components with voxels
outside the brain in the ventricles, were removed (Beckmann, 2012). The remaining
components were identified as ICNs and were included in subsequent analyses.
These global ICNs were then used as templates for back-transformation of
individual-level spatial maps and timeseries with FSL’s dual spatio-temporal
regression software.
The individual-level, back-transformed ICN timeseries were used as the basis
of the analysis of ICN time course entropy as well as all subsequent analyses.
Univariate entropy here is defined as the Shannon entropy (Shannon, 1948) and is
measured for each signal, i.e. within each ICN and then averaged across ICNs and
participants within each group. For the bivariate metrics, the mean score for the ith
column of the connectivity matrix represents how well each node (ICN) is connected
to all other nodes in the graph and, hence, the strength of the graph in this analysis
is defined as the average strength across all ICNs. Similarly, the variance of the ith
column of the connectivity matrix represents the variability in the strength of
connectivity for each ICN and, hence, the diversity is the average variability within
group (Lynall et al., 2010).
Interconnectivity Analyses
To examine how well each individual network is connected with all other
networks, we computed an individual-level cross-correlation. The individual-level
ICN timeseries underwent an exhaustive cross-correlation procedure in which each
ICN was correlated with every other ICN in order to produce correlation matrices.
The cross-correlation scores were averaged across all participants per ICN within
each group, and a statistical threshold based on the z-transformed overall ICN
correlation values and sample size was used to determine which of the ICNs
exhibited significant interconnectivity.
To determine mean interconnectivity differences across groups, ICN
timeseries were concatenated across participants within each group in order to
concatenated timeseries vectors were then all correlated within groups, and these
scores were contrasted using a t-test. All group comparisons were done using a
one-tailed alpha (p < 0.05), which was then corrected for the comparison of the three
groups using a Bonferroni correction that yielded an adjusted “multivariate
significance” alpha (p < 0.017).
Random Forests Prediction of Disease State
A random forest machine learning algorithm was employed to determine the
accuracy of classification of group status between control, RBD and PD and, hence,
disease severity. The forests were populated by decision trees which were trained
to distinguish persons with RBD from controls using their scores for connectivity
strength and diversity. This forest was then used to predict PD status based on the
classes from the training data. Hence, the algorithm returned vectors of assignments
for both the PD and control connectivity profiles, in which control was “0” and PD
was “1”. After group status was predicted using the classification algorithm, the two
vectors of predicted and real scores were correlated. In addition, sensitivity and
specificity were calculated using the following formulas:
Sensitivity = true positives / true positives + false negatives
Specificity = true positives / true positives + false positives
In order to provide an unbiased classification, the matrix of scores for
controls was split into two test and train subgroups for the purposes of training and
smaller than the training (RBD) and testing (PD), these subgroups were intermixed
with another group of age matched controls, on which data had also been collected
at the University of Minnesota. Hence, there were 10 subjects in the control training
group, 14 subjects in the RBD training group, 10 subjects in the control testing
group and 15 subjects in the PD testing group. There were no significant differences
between the separate groups of controls in either demographics or connectivity
scores.
3D Brain Figure Generation
All brain images were generated using Mango (the Multi-image Analysis GUI)
viewer from the Research Imaging Institute of University of Texas Health Science
Center (http://ric.uthscsa.edu/mango/index.html). All ICN overlays from the global
ICA output were rendered on a 3D surface built off the MNI 152 T1 1-mm brain
template. This 3D rendering was then made translucent to reveal the subsurface
structures contained in each ICN. This was particularly important for sub-cortical
Results
The UPDRS scores for the three groups were as follows: PD = 24.20 ± 9.24,
RBD = 8.53 ± 5.82, control = 2.92 ± 2.53. The multi-group ICA, which was performed
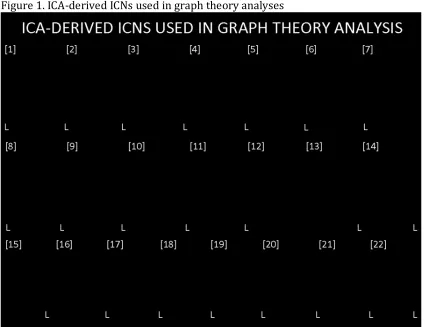
with data from all three groups, produced 22 common non-artifactual ICNs (Fig. 1).
Of these 22 ICNs, 7 contained areas related to motor functioning, including the
midbrain, cerebellum, primary motor cortex (M1) and corresponding
somatosensory areas, pre-motor and supplementary regions, as well as the
posterior parietal cortex. After all global maps were generated, these networks were
also back-transformed into individual-level space in order to capture possible
disease-relevant variance, which would be reflected as patient and control group
differences.
In the univariate whole brain analysis, no significant differences were found
in the entropy of the ICN timeseries when comparing the control and PD groups (t =
1.09, df = 25.78, p = 0.14, d= 0.41), the control and RBD groups (t = 0.45, df = 15.59,
p = 0.67, d = 0.17), or RBD and PD groups (t = 0.94, df = 16.65, p = 0.18, d = 0.36)
(Fig. 2). In the bivariate analyses, a significant difference was observed in
connectivity strength between the control and PD groups (t = 3.23, df = 22.73, p =
0.002, d = 1.24), the difference between the control and RBD groups (t = 2.05, df =
21.059, p = 0.027, d = 0.80) was near significance after Bonferroni correction, and a
weaker trend level difference was observed between the RBD and PD groups (t =
1.57, df = 26.88, p = 0.06, d = 0.58) (Fig. 3). For the diversity of connectivity, a
significant difference was again found between the control and PD group (t = 3.42,
groups (t = 1.91, df = 23.73, p = 0.03, d = 0.74) and the RBD and PD groups (t = 1.77,
df = 26.77, p = 0.04, d = 0.65) were only at trend level after Bonferroni correction
(Fig. 4).
Given that previous relationships have been established between signal
entropy and the strength and diversity of connectivity (Bassett, Nelson, Mueller,
Camchong, & Lim, 2012), these relationships were assessed and it was observed
that there were indeed group differences in the scores for the Pearson correlation
between strength and entropy (Fig. 5) and the Pearson correlation between
diversity and entropy (Fig. 6). Significant group differences were observed for group
comparisons between controls and PD (t = 3.03, df = 25.2, p = 0.003), controls and
RBD (t = 2.33, df = 20.5, p = 0.015), but not PD vs RBD (t = 0.12, df = 24.37, p = 0.45)
for the correlation between strength and entropy within group. For the t-tests of the
scores from the Pearson’s correlation of diversity and entropy per group, the
comparison of the scores for the control and PD groups (t = 3.1, df = 23.28, p =
0.002) showed a significant group difference, but the scores of the control and RBD
groups (t = 1.65, df = 18.55, p = 0.06) were not significantly different, neither were
those for PD vs RBD groups (t =0.73, df = 24.44, p-value = 0.24).
For the individual-level ICN cross-correlation, in the control group, 17 ICNs
passed the threshold. For RBD, 14 ICNs passed threshold and were a subset of the
17 ICNs found in the controls. Similarly, for the PD group, only 10 ICNs passed
threshold, which were again a subset of the 14 found in RBD group, and the larger
For the group-level cross-correlation, the t-test of interconnectivity scores
showed that the control group had higher mean interconnectivity scores than both
the PD group (t = 4.16, df = 390.87, p = 0.00002) and RBD group (t = 2.00, df =
489.98, p = 0.023), but the comparison of the control and RBD groups only had
marginal multivariate significance (p <.017). In addition, it was observed that the
RBD group had a higher group-level cross-correlation score when compared to the
PD group (t = 2.80, df = 547.09, p = 0.003), even after Bonferroni correction.
The random forest classifier that was trained on a subgroup of controls
versus RBD patients was tested on how well it could distinguish a separate group of
controls from PD patients. It returned a vector of group assignments for controls (0)
versus persons with Parkinson’s disease (Figure 1). It was found that there was a
correlation of r = 0.69 between the predicted and real scores, and the Parkinson’s
Discussion
The combined ICA - graph theory analyses of the connectivity profiles of the
PD, RBD and control groups is a novel analysis strategy that is unlike seed-based
approaches or typical ICA or graph theory analyses, in that it combines the
data-driven network depiction of ICA and the descriptive power of graph theory to
examine both global and network-level phenomena. Using this methodology, several
metrics showed that there were significant differences between the three groups.
Moreover, all the metrics revealed connectivity phenotypes in which the RBD group
was intermediate between the PD and control groups, with a nested decrease in
network interconnectivity going from controls to RBD to PD being the most striking
finding.
In the univariate analysis of network entropy, there were no significant
differences between the groups. However, this is not inconsistent with our previous
findings of no significant differences in entropy related to disease state between
persons with schizophrenia and controls (Bassett, Nelson, Mueller, Camchong, &
Lim, 2011). Bivariate connectivity strength was strongest for controls, and less so
for both the RBD and PD groups. Interestingly, while there was a significant
connectivity strength difference between the control and PD groups, the differences
between the control and PD group as well as PD and RBD groups were not
significant after multiple comparison correction. Of note, the RBD group strength
was in between that of the control and PD groups, thus suggesting an intermediate
phenotype. These findings are consistent with other investigations that have
persons who have not yet manifested PD (Fantini, Postuma, Montplaisir, &
Ferini-strambi, 2006; Postuma, Gagnon, & Montplaisir, 2012; Postuma, Aarsland, et al.,
2012).
For the bivariate analysis of diversity of connectivity, it was again found that
diversity was highest for controls and lower for persons with both RBD and PD.
Again, there was a trend showing that RBD was intermediate between controls and
PD, but although the differences between the control and RBD as well as RBD and
PD groups showed a strong trend, this did not reach significance after multiple
comparison correction. In our previous analysis of connectivity diversity between
controls and persons with schizophrenia, it was found that the schizophrenia group
had significantly higher diversity than controls (Bassett et al., 2011), which
contrasts with our findings in PD. This suggests that the diversity of connectivity is
sensitive to different types of disease-related aberrations and, in schizophrenia,
neuronal disorganization results in cognitive and behavioral deficits, as well as
aberrant sensory and limbic processing, which is also reflected in an increase in
connectivity diversity. In the case of PD, it is known that synuclein pathology often
extends throughout the brain, which is then reflected in a decrease in connectivity
diversity. In addition, the decrease in diversity demonstrated in RBD cases as
compared to controls is consistent with the progressive deposition of
alpha-synuclein pathology in brainstem and cortical regions.
While there were no significant group differences for signal entropy, the
correlations between connectivity strength and signal entropy showed significant
Similarly, there was a significant difference between the control and PD groups for
the correlation of entropy and diversity and this inverse association was again
strongest for controls and weakest for the PD cases. This means that higher
connectivity strength and diversity leads to lower signal entropy in a
non-pathological state and this relationship is diminished with increasing pathology.
Based upon this trend and our other connectivity findings we would suggest that the
lack of significant group differences in entropy is simply due to a lack of power.
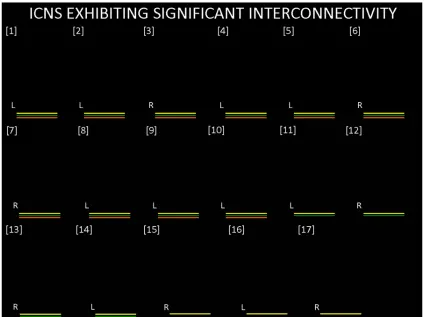
In the interconnectivity analysis, it was observed that, of all the 22 functional
networks, 17 ICNs exhibited significant interconnectivity in the control group. Of
these 17 networks, a subset of 14 exhibited significant interconnectivity for the RBD
group, and an even smaller subset of 10 for the PD group. Hence, there was a nested
decrease in interconnectivity between the PD, RBD and control groups, respectively.
This observation was corroborated by the analysis of the canonical ICN timeseries
per group, in which it was found that the mean interconnectivity was highest for the
control group, significantly lower for the RBD group and, significantly lower still for
the PD group. This group nesting implies that there is a common set of ICNs that
generally have high interregional connectivity in healthy controls, but that some of
these ICNs have decreased connectivity when individuals present with RBD, and
that these same ICNs have deficient interconnectivity in the case of PD, in
combination with an additional set of ICNs. Hence, this suggests that there is a
common network-level deficit in both RBD and PD cases, but that this deficit is more
To test this assertion, a random forests classifier was trained on a sample of
RBD cases and controls and tested on its ability to identify PD cases. The high level
of sensitivity and specificity that was obtained by this machine learning algorithm
supports our findings that there is a sub-clinical state that is detectable in RBD and
that is also informative of PD. While the accuracy was not perfect, we believe that as
more information is gained about the in vivo states of both PD and its pre-clinical
syndromes such as RBD, we will have greater predictive power to use phenotypes
from the pre-clinical states to predict the onset of PD. However, the ultimate test
will be to predict disease onset in pre-clinical patients in a longitudinal design in
order to see how well these in vivo phenotypes can inform early detection models.
In conclusion, these findings demonstrate that there is a nested decrease in
interconnectivity across RBD and PD, with increasing network dysfunction evident
in a more advanced disease state (Ibarretxe-bilbao et al., 2011). Furthermore, we
used these fcMRI metrics to detect increasing dysfunction in brain networks, as we
used machine learning of the RBD connectivity profile to classify the PD connectivity
profile. This finding is supported by a study in which regional fluctuation and
synchronization differences between PD and controls allowed for blind separation
of the two groups with good accuracy, specificity and sensitivity (Long et al., 2012).
Hence, the interconnectivity phenotypes can serve as a possible biophysiological
marker of disease progression even prior to the onset of relevant clinical symptoms,
Acknowledgements: Preliminary data from this project was presented at the
International REM Sleep Behavior Disorder Study Group Meeting in Valencia, Spain
(October 2013) and the Organization for Human Brain Mapping Annual Meeting in
Hamburg, Germany (June 2014). Data collection for this study was supported by a
grant from GE Healthcare, Inc., grant number 10-DAT-003. The authors are grateful
to Christa Raszkowski for her assistance with the recruitment of participants for
this study and for all participants who made this study possible.
Author Contributions:
Conceptualization, Paul Tuite, Laura Hemmy, Kelvin Lim and Michael Howell; Data
curation, Laura Hemmy, Michael Howell and Bryon Mueller; Formal analysis, Craig
Moodie, Laura Hemmy and Bryon Mueller; Funding acquisition, Paul Tuite;
Investigation, Paul Tuite, Craig Moodie, Laura Hemmy, Kelvin Lim, Michael Howell
and Bryon Mueller; Methodology, Paul Tuite, Laura Hemmy, Michael Howell and
Bryon Mueller; Project administration, Paul Tuite, Laura Hemmy and Kelvin Lim;
Resources, Laura Hemmy and Michael Howell; Software, Craig Moodie, Laura
Hemmy, Kelvin Lim and Bryon Mueller; Supervision, Paul Tuite and Kelvin Lim;
Validation, Laura Hemmy; Writing – original draft, Craig Moodie; Writing – review &
editing, Paul Tuite, Craig Moodie, Laura Hemmy, Kelvin Lim, Michael Howell and
Financial Disclosures: Data collection for this study was supported by a grant from
GE Healthcare, Inc., grant number 10-DAT-003. Paul Tuite, the senior author on this
paper also received funding from the National Institutes of Health (NIH) and
Northwestern University for evaluation of isradipine, NIH for being part of the Udall
Parkinson Centers, Michael J. Fox foundation for the Biofind study and funding from
Biogen and Bristol-Myers Squibb for evaluation of tau-directed monoclonal
antibody BIIB092 for progressive supranuclear palsy. Dr. Tuite had been supported
by a grant from the UK Parkinson’s Organization to evaluate N-acetylcysteine in a
clinical trial.. The other authors have no other conflicts of interest, financial or
References
1. AASM. (2001). THE INTERNATIONAL CLASSIFICATION OF SLEEP DISORDERS, REVISED: Diagnostic and Coding Manual. Westchester, IL: American Academy of Sleep Medicine.
2. Bassett, D. S., Nelson, B. G., Mueller, B. A., Camchong, J., & Lim, K. O. (2011). Altered resting state complexity in schizophrenia. Neuroimage. Retrieved from
http://www.hubmed.org/display.cgi?uids=22008374
3. Beckmann, C. F. (2012). Modelling with independent components. NeuroImage, 62(2), 891–901. doi:10.1016/j.neuroimage.2012.02.020
4. Beckmann, C., & Smith, S. (2004). Probabilistic independent component analysis for functional magnetic resonance imaging. Institute of Electrical and Electronics Engineers Transactions on Medical Imaging, 23(2), 137–52. Retrieved from http://ieeexplore.ieee.org/xpls/abs_all.jsp?arnumber=1263605
5. Bezard, E., & Fernagut, P.-O. (2014). Premotor parkinsonism models. Parkinsonism & Related Disorders, 20S1, S17–S19. doi:10.1016/S1353-8020(13)70007-5
6. Borek, L., Amick, M., & Friedman, J. (2006). Non-motor aspects of Parkinson’s disease. CNS Spectrums, 7(July). Retrieved from
http://mbldownloads.com/0706CNS_Borek_CME.pdf
7. Braak, H., Ghebremedhin, E., Rub, U., Bratzke, H., & Del Tredici, K. (2004). Stages in the development of Parkinson’s disease-related pathology. Cell Tissue Res, 318, 121–134.
8. Brooks, D. J. (2012). Parkinson’s disease: Diagnosis. Parkinsonism and Realted Disorders, 18, S31–S33. doi:10.1016/S1353-8020(11)70012-8
9. Cho, Z., Oh, S., Kim, J., Park, S.-Y., Kwon, D.-H., Jeong, H.-J., … Jeon, B. S. (2010). Direct Visualization of Parkinson ’ s Disease by In Vivo Human Brain Imaging Using 7 . 0T Magnetic Resonance Imaging. Movement Disorders, xx(xxx), 1–6. doi:10.1002/23465
10. Ellmore, T. M., Castriotta, R. J., Hendley, K. L., Aalbers, B. M., Furr-stimming, E., Hood, A. J., … Schiess, M. C. (2013). Altered Nigrostriatal and Nigrocortical Functional Connectivity in Rapid Eye Movement Sleep Behavior Disorder. Sleep, 36(12), 1885–1892.
11. Fantini, M. L., Postuma, R. B., Montplaisir, J., & Ferini-strambi, L. (2006). Olfactory deficit in idiopathic rapid eye movements sleep behavior disorder. Brain Research Bulletin, 70, 386–390. doi:10.1016/j.brainresbull.2006.07.008 12. Hanyu, H., Inoue, Y., Sakurai, H., Kanetaka, H., Nakamura, M., Miyamoto, T., …
Iwamoto, T. (2012). Parkinsonism and Related Disorders Voxel-based magnetic resonance imaging study of structural brain changes in patients with idiopathic REM sleep behavior disorder. Parkinsonism and Related Disorders, 18(2), 136– 139. doi:10.1016/j.parkreldis.2011.08.023
14. Iranzo, A., Santamaria, J., & Tolosa, E. (2009). The clinical and pathophysiological relevance of REM sleep behavior disorder in neurodegenerative diseases. Sleep Medicine Reviews, 13(6), 385–401. doi:10.1016/j.smrv.2008.11.003
15. Jenkinson, M., Bannister, P., Brady, M., & Smith, S. (2002). Improved
Optimization for the Robust and Accurate Linear Registration and Motion Correction of Brain Images. NeuroImage, 17, 825–841.
doi:10.1006/nimg.2002.1132
16. Long, D., Wang, J., Xuan, M., Gu, Q., Xu, X., Kong, D., & Zhang, M. (2012). Automatic Classification of Early Parkinson’s Disease with Multi-Modal MR Imaging. PloS One, 7(11), 1–9. doi:10.1371/journal.pone.0047714
17. Luk, K. C., Kehm, V., Carroll, J., Zhang, B., Brien, P. O., Trojanowski, J. Q., & Lee, V. M.-Y. (2013). Pathological α-Synuclein Transmission Initiates Parkinson-like Neurodegeneration in Non-transgenic Mice. Science, 338(6109), 949–953. doi:10.1126/science.1227157.Pathological
18. Lynall, M., Bassett, D. S., Kerwin, R., Mckenna, P. J., Kitzbichler, M., Muller, U., & Bullmore, E. (2010). Functional Connectivity and Brain Networks in
Schizophrenia. The Journal of Neuroscience, 30(28), 9477–9487. doi:10.1523/JNEUROSCI.0333-10.2010
19. Massano, J., & Bhatia, K. P. (2012). Clinical approach to Parkinson’s disease: features, diagnosis, and principles of management. Cold Spring Harbor Perspectives in Medicine, 2(6), 1–15. doi:10.1101/cshperspect.a008870
20. Morales, D. A., Vives-Gilabert, Y., Gomez-Ansond, B., Bengoetxea, E., Larranaga, P., Bielza, C., … Delfino, M. (2012). Predicting dementia development in
Parkinson’s disease using Bayesian network classifiers. Psychiatry Research: Neuroimaging, 1–7. doi:10.1016/j.pscychresns.2012.06.001
21. Poewe, W., Rascol, O., Sampaio, C., Stebbins, G. T., & Goetz, C. G. (2003). The Unified Parkinson’s Disease Rating Scale (UPDRS): Status and
Recommendations. Movement Disorders, 18(7), 738–750. Retrieved from http://www.ncbi.nlm.nih.gov/books/NBK27754/
22. Postuma, R. B., Aarsland, D., Barone, P., Burn, D., Hawkes, C., Oertel, W., & Ziemssen, T. (2012). Identifying Prodromal Parkinson’s Disease: Pre-Motor Disorders in Parkinson’s Disease. Movement Disorders, 27(5), 617–626. doi:10.1002/mds.24996
23. Postuma, R. B., Gagnon, J., & Montplaisir, J. Y. (2012). REM sleep behavior disorder: From dreams to neurodegeneration. Neurobiology of Disease, 46(3), 553–558. doi:10.1016/j.nbd.2011.10.003
24. Prodoehl, J., Li, H., Planetta, P. J., Goetz, C. G., Shannon, K. M., Tangonan, R., … Vaillancourt, D. E. (2013). Diffusion Tensor Imaging of Parkinson’s Disease, Atypical Parkinsonism, and Essential Tremor. Movement Disorders, 28(13), 1816–1822. doi:10.1002/mds.25491
25. Samii, A., Nutt, J. G., & Ransom, B. R. (2004). Parkinson’s disease. The Lancet, 363, 1783–1793.
previously reported series. SLEEP MEDICINE, 1–5. doi:10.1016/j.sleep.2012.10.009
27. Shannon, C. E. (1948). A Mathematical Theory of Communication. Bell System Technical Journal, 27(3), 379–423.
28. Sharman, M., Valabregue, R., Perlbarg, V., Marrakchi-Kacem, L., Vidailhet, M., Benali, H., … Lehericy, S. (2012). Parkinson’s Disease Patients Show Reduced Cortical-Subcortical Sensorimotor Connectivity. Movement Disorders, 28(4), 447–454. doi:10.1002/mds.25255
29. Smith, S. M. (2012). The future of FMRI connectivity. NeuroImage, 62(2), 1257– 66. doi:10.1016/j.neuroimage.2012.01.022
30. Unger, M. M., Belke, M., Menzler, K., Heverhagen, J. T., Keil, B., Stiasny-kolster, K., & Rosenow, F. (2010). Diffusion Tensor Imaging in Idiopathic REM Sleep Behavior Disorder Reveals Microstructural Changes in the Brainstem ,
Substantia Nigra , Olfactory Region , and Other Brain Regions. Sleep, 33(6), 767– 773.
31. Vaillancourt, D. E., Spraker, M. B., Prodoehl, J., Abraham, I., Corcos, D. M., Zhou, X. J., & Al., E. (2009). High-resolution diffusion tensor imaging in the substantia nigra of de novo Parkinson disease. Neurology., 72((16)), 1378–84.
32. Van Eimeren, T., Monchi, O., Ballanger, B., & Strafella, A. P. (2009). Dysfunction of the Default Mode Network in Parkinson Disease : Archives of Neurology, 66(7), 877–883. doi:10.1001/archneurol.2009.97.Dysfunction
33. Williams, D., Tijssen, M., Bruggen, G. Van, Bosch, A., Insola, A., Lazzaro, V. Di, … Brown, P. (2002). Dopamine-dependent changes in the functional connectivity between basal ganglia and cerebral cortex in humans. Brain, 125, 1558–1569. Retrieved from http://brain.oxfordjournals.org/content/125/7/1558.short 34. Wisner, K., Atluri, G., Lim, K., & MacDonald III, A. (2013). Neurometrics of
intrinsic connectivity networks at rest using fMRI: Retest reliability and cross-validation using a meta-level method. NeuroImage, 76, 236–51. Retrieved from http://www.sciencedirect.com/science/article/pii/S1053811913002218 35. Wu, T., Long, X., Wang, L., Hallett, M., Zang, Y., Li, K., & Chan, P. (2011). Functional
Connectivity of Cortical Motor Areas in the Resting State in Parkinson’s Disease. Human Brain Mapping, 32, 1443–1457. doi:10.1002/hbm.21118
36. Yu, R., Liu, B., Wang, L., Chen, J., & Liu, X. (2013). Enhanced Functional
Figure Captions
Figure 1. 3D overlays of spatial maps from intrinsic connectivity networks (ICNs)
generated from the independent component analysis of fMRI data from the
Parkinson’s disease (PD), rapid eye movement sleep behavior disorder (RBD) and
control groups. Global spatial maps were derived and thresholded (z = 6) and
rendered in either axial or coronal orientations.
Figure 2. Box plot showing group differences in the intrinsic connectivity networks’
(ICN) timeseries entropy between the three groups. Entropy here is defined as the
Shannon entropy (see methods).
Figure 3. Box plot showing group differences in connectivity strength between the
three groups. Significance thresholds were established using one-tailed t-tests and
corrected for multiple comparisons (p < 0.017).
Figure 4. Box plot showing group differences in connectivity diversity between the
three groups. Significance thresholds were established using one-tailed t-tests and
corrected for multiple comparisons (p < 0.017).
Figure 5. Box plot showing group differences in the Pearson correlations of
connectivity strength and intrinsic connectivity network (ICN) timeseries entropy
between the three groups. Significance thresholds were established using one-tailed
Figure 6. Box plot showing group differences in the Pearson correlations of
connectivity diversity and intrinsic connectivity network (ICN) timeseries entropy
between the three groups. Significance thresholds were established using one-tailed
t-tests and corrected for multiple comparisons (p < 0.017).
Figure 7. 3D rendering of intrinsic connectivity networks (ICNs) exhibiting
significant interconnectivity within the three groups. The set of 17 ICNs shown in
the figure all showed significant interconnectivity in the control group, as depicted
by the yellow bars. A subset, comprised of 14 of these ICNs, had significant
interconnectivity in the RBD group and is labeled using the green bars. A smaller
subset (10 ICNs) also exhibited significant interconnectivity in the PD group, as
shown by the orange bars.
Figure 8. Bar graph depiction of the results from a random forests prediction of
Parkinson’s disease cases based on connectivity phenotypes from RBD. Decision
trees were trained to identify RBD and control cases using their respective
connectivity strength and diversity profiles and then tested for their ability to
distinguish a separate set of controls from PD patients. The number of predicted
cases is plotted on the y-axis and the groups (control = “0”, PD = “1”) are on the
Figures
Figure 1. ICA-derived ICNs used in graph theory analyses
Figure 3. Bivariate Strength
Figure 5. Pearson’s Correlation between Strength and Entropy