Clinical Epidemiology 2018:10 1195–1201
Clinical Epidemiology
Dove
press
submit your manuscript | www.dovepress.com 1195
S H O RT R E P O RT
open access to scientific and medical research
Open Access Full Text Article
Underrecording of osteoarthritis in United
Kingdom primary care electronic health
record data
Dahai Yu Kelvin P Jordan George Peat
Arthritis Research UK Primary Care Centre, Research Institute for Primary Care & Health Sciences, Keele University, Keele, Newcastle, UK
Purpose: Primary care electronic health records are increasingly used to estimate the occurrence of osteoarthritis (OA). We aimed to estimate the extent and trend over time of underrecording of severe OA patients in UK primary care electronic health records using first primary total hip and knee replacements (THR/TKR) – >90% of which are performed for OA – as the reference population.
Patients and methods: We identified patients with a first primary THR or TKR recorded in the UK Clinical Practice Research Datalink between 2000 and 2015. We then searched for a diagnostic/problem code for OA up to 10 years prior to THR/TKR using 3 definitions: “diag-nosed OA (joint-specific),” “diag“diag-nosed OA (any joint),” “clinical OA” (diag“diag-nosed OA or relevant peripheral joint pain symptom code).
Results: Among 34,299 THR patients identified, 28.1%, 53.4%, and 74.4% had a prior record of diagnosed OA (hip), diagnosed OA (any), and clinical OA, respectively. Among 47,588 TKR patients, the corresponding figures were, 25.5% (diagnosed OA [knee]), 43.7%, and 74.8%. In the UK Clinical Practice Research Datalink, the proportion of patients with prior recorded OA decreased between 2000 and 2015.
Conclusion: An increasing trend of underrecording of OA or joint pain among patients with THR or TKR (severe OA patients) between 2000 and 2015 was identified. An underestimate health care demand could be derived based on consultation incidence and prevalence of OA from electronic health record data that relies on osteoarthritis diagnostic codes. Further studies are warranted to investigate the validity of OA or joint pain recorded in primary care settings, which might be used to correct the consultation incidence and prevalence of OA.
Keywords: joint pain, total knee replacement, total hip replacement, sensitivity
Introduction
Primary care electronic health records (EHR) provide an efficient and continuous source of data with which to estimate disease incidence and prevalence and trends in these across time.1 However, the interpretation of such estimates relies either on the verification, sensitivity analysis, or assumption of the completeness and validity of recording used for patient definitions. Blanket assertions on the validity of recording in whole databases are not uncommon, but in truth the validity of coding varies across different aspects of the EHR (eg, by disease depending on the existence of objective criteria for diagnosis, availability of disease-specific prescriptions to augment diag-nostic/problem codes, and incentives for completeness of recording)2 and across time (eg, changing diagnostic criteria and coding behavior).
Correspondence: Dahai Yu Arthritis Research UK Primary Care Center, Research Institute for Primary Care & Health Sciences, Keele University, Keele, Staffordshire, ST5 5BG, UK Tel +44 1782 734 891
Fax +44 1782 734 719 Email d.yu@keele.ac.uk
Journal name: Clinical Epidemiology Article Designation: SHORT REPORT Year: 2018
Volume: 10
Running head verso: Yu et al
Running head recto: Underrecorded osteoarthritis in UK primary care DOI: http://dx.doi.org/10.2147/CLEP.S160059
Clinical Epidemiology downloaded from https://www.dovepress.com/ by 118.70.13.36 on 20-Aug-2020
For personal use only.
Dovepress
Yu et al
Osteoarthritis (OA) presents just such a challenge. Diag-nosis is made on clinical grounds without requiring confir-mation by imaging,3 although the value of disease diagnosis has been debated.4 There are no pharmacological treatments specific to OA, meaning that identification of patients in the EHR records relies on diagnostic/problem coding. In the UK, it is not one of the long-term conditions whose management has been specifically incentivized within the General Medi-cal Services contract introduced in 2004.5 Previous studies examining the validity of OA patient definitions within administrative and clinical EHR databases have typically found specificity ≥89% (ie, few false-positives) against the reference standards of medical chart abstraction or patient-reported doctor-diagnosed OA, particularly when using restrictive algorithms (eg, requiring 2 or more OA diagnostic codes within a period of time).6 These studies have gener-ally reported lower sensitivity (higher false-negative rate), ranging from 29%7 to 83%.8 An acknowledged limitation in these existing studies is the potential for misclassification in the reference standard.6
In the current study, we focus on estimating the sensitivity of different definitions for OA based on diagnostic/problem codes in the primary care EHR using the reference standard of primary total hip or knee replacement (THR/TKR). Accord-ing to the National Joint Registry (NJR), 90% of primary THR and 98% of primary TKR are performed for hip OA and knee OA: a proportion that has changed little since NJR data collection began in 2003.9 These proportions provide a benchmark and an upper limit against which to compare the sensitivity of diagnostic/problem coding of OA in UK primary care records. In addition, we sought to investigate changes in sensitivity over time.
Patients and methods
We undertook a descriptive study using routinely collected longitudinal data from the UK Clinical Practice Research Datalink (CPRD), which was established in 1987 and contains computerized primary care records from general practices covering around 7% of the UK population.10 CPRD includes anonymized patient demographics, consultations, diagnoses, prescriptions, and tests from primary care, and also includes those referrals to specialists, hospital admis-sions, and diagnoses made in secondary care, reported back to the general practitioners and recorded by them within their computerized records. CPRD has reported high validity for a range of diagnoses (but not including OA).11 The study was approved by the Independent Scientific Advisory Committee for CPRD research (protocol reference: 14_09010_193R and
15_211). No further ethical permissions were required for the analyses of these anonymized patient-level data.
Patients aged 40 years and with recorded incident primary THR or TKR between 2000 and 2015 were included in this study. Each eligible incident THR patient had to have at least 10 years of continuous registration prior to THR during which there was no evidence of a previous THR or TKR. Each eligible incident TKR patient had to have at least 10 years of continuous registration prior to TKR during which there was no evidence of a previous THR or TKR. Primary THR and TKR were identified within CPRD using the Read code list developed and applied in CPRD by Culliford et al,12 and validated by Hawley et al.13
We defined OA patients in 3 ways based on established Read codes14 (available from www.keele.ac.uk/mrr): first, patients of OA were defined restrictively as having at least 1 consultation with a recorded diagnosis of hip OA or knee OA (diagnosed OA [joint-specific]); second, patients of “OA” were defined as having at least 1 consultation with a recorded diagnosis of OA, including where the involved joint was not specified (diagnosed OA [any joint]); finally to maximize sensitivity and capture the greatest number of new consulting patients of OA, patients were defined as having either at least 1 consultation with a recorded diagnosis of OA or, in adults aged over 45 years, at least 1 consultation with a recorded peripheral joint pain symptom code affecting the knee, hip, and hand/wrists (the joints most commonly affected by osteoarthritis) likely to reflect OA (clinical OA).
Look-back periods from 1 to 10 years were applied both for patients with incident primary THR and patients with incident primary TKR. In each look-back period, the proportion of patients with 1 or more OA diagnostic/problem code (sensitiv-ity) was calculated. To observe the period effect on the recorded OA diagnosis, the analyses were repeated stratified by year of THR/TKR between 2000 and 2015. We present the findings for 3- and 10-year look-back periods in the main results, as we have shown previously that the 3-year is the minimum period needed to pick up recorded OA in CPRD15 and 10-year is the reasonable maximum period to capture existing diagnosis of OA as shown in previous studies.2,15,16 The full set of findings is provided in the Supplementary materials.
We conducted additional analyses aimed at exploring possible reasons for underrecording of OA in the primary care EHR. We chose 2 calendar years, 2006 and 2015, and stratified our analyses by patient age (<65/≥65 years) and sex with our hypothesis being that underrecording would be greatest in older adults and in women reflecting greater levels of comorbid illness in these subpopulations.
Clinical Epidemiology downloaded from https://www.dovepress.com/ by 118.70.13.36 on 20-Aug-2020
Dovepress Underrecorded osteoarthritis in UK primary care
Poisson regression was used to model the trend over time in the proportion of THR/TKR patients receiving an OA diagnosis with the first calendar year (2000) as the refer-ence, and results expressed as crude and age-sex-adjusted rate ratios with 95% CIs.
Data management and analysis were performed using Stata MP Software V14.1 (StataCorp, College Station, TX, USA).
Results
A total of 34,299 incident primary THR patients and 47,588 incident primary TKR patients between 2000 and 2015 were recorded in CPRD. In the 3 years prior to THR, 69.9%, 44.7%, and 24.5% of THR patients had recorded clinical OA (diagnosed OA or peripheral joint pain symptom code), diagnosed OA (any joint), and diagnosed OA (hip), respec-tively. In the 3 years prior to TKR, 71.6%, 36.7%, and 23.4% of TKR patients had recorded clinical OA, diagnosed OA (any joint), and diagnosed OA (knee), respectively. In the 10 years prior to joint replacement, the figures were 74.7%, 53.4%, and 28.1% for THR, and 74.8%, 43.7%, and 25.5% for TKR patients.
Between 2000 and 2015, the sensitivity of each type of OA diagnosis appeared to reduce over time, regardless of whether a 3- or 10-year look-back period was used, (Figure 1; Tables S1–S6).
When stratified by age and sex, the pattern of under-recording differed between knee OA and hip OA (Table S7 and S8). For knee OA, sensitivity was lower among younger patients (aged <65 years at TKR) than older patients, particu-larly for diagnosed OA (any joint) and diagnosed OA (knee), and this same pattern was seen in 2006 and in 2015. There was little difference by sex. By contrast, for hip OA, sensitivity was higher in the younger patients and slightly higher among male patients. Sensitivity for diagnosed OA (any joint) and diagnosed OA (hip) among the younger patients showed the least decline between 2006 and 2015.
Between 2000 and 2015, both unadjusted and adjusted rate ratios reduced for each type of OA diagnosis, regard-less of whether a 3- or 10-year look-back period was used, (Tables 1 and 2). In comparison with patients who under-went THR in 2000, for patients receiving THR in 2015, the adjusted rate ratios for having clinical OA, diagnosed OA (any joint) and diagnosed OA (hip) were 0.748 (95% CI: 0.673–0.832), 0.552 (0.486–0.627), and 0.611 (0.516–0.724), respectively. Similarly, compared with patients receiving TKR in 2000, for patients receiving TKR in 2015, in the 3 years prior to TKR, the adjusted rate ratios for having clinical
OA, diagnosed OA (any joint), and diagnosed OA (knee) was 0.834 (0.758–0.918), 0.478 (0.420–0.543), and 0.545 (0.458–0.648), respectively. In the 10 years prior to joint replacement, the rate ratios were 0.804 (0.726–0.891), 0.627 (0.557–0.705), and 0.570 (0.488–0.665) for THR, and 0.857 (0.780–0.940), 0.583 (0.519–0.656), and 0.576 (0.494–0.672) for TKR patients.
Discussion
We found evidence of substantial underrecording of OA diagnosis/problem codes in UK primary care electronic record datasets using patients with total joint replacement as the reference population. Using the broadest definition of clinical OA, 25% patients underwent THR without evidence of a joint pain Read code recorded in the prior 10 years.
Given the very high proportion performed for OA, we have argued that receipt of primary total hip and knee replace-ment is a reasonable choice of reference standard. According to the figure of NJR in 2017, >90% THR and >95% TKR were performed for patients with OA. However, it is important to note that the record of THR and TKR in CPRD is subject to some misclassification. A previous study found that among all diagnosed hip OA and knee OA patients recorded in CPRD, using THR and TKR recorded in Hospital Episode Statistics as the reference standard within 60-day interval, the sensitivity and positive predictive value were 86.6% and 72.8% for THR recorded in CPRD and 88.0% and 74.6 for TKR recorded in CPRD, respectively.13 This is insufficient to explain the extent of underrecording of OA diagnoses. Furthermore, we might expect lower sensitivity when con-sidering not simply those receiving joint replacement but the entire spectrum of OA severity since less severe patients are known to be less likely to have a recorded OA diagnosis.20
Unlike diseases managed both in primary and secondary care for which sensitivity of diagnosis could be improved by linking the primary and secondary care data,21 OA is largely managed in primary care, with secondary care being accessed via primary care. Together with our use of a 10-year look-back period, justified by findings from previous studies,2,15,16 we think it unlikely that linkage to secondary care in this instance would substantially increase the number of patients with an OA diagnosis.
In this descriptive study, reasons for the underrecording of OA diagnosis and the worsening of this over time are necessarily speculative. A gradual shift in coding behavior from OA diagnosis to nonspecific symptom coding may contribute, although the decline in sensitivity of diagnosed OA did not appear to be compensated by an increase in
Clinical Epidemiology downloaded from https://www.dovepress.com/ by 118.70.13.36 on 20-Aug-2020
Dovepress
Yu et al
sensitivity for “clinical OA.” The exclusion from the General Medical Services contract may also play a role although the lack of any clear break in trend at the time of its introduction in 2004 would argue against this being a major explanation.
Patients and/or clinicians giving OA lower priority in the context of multimorbidity may also contribute but stratifying our findings for age and sex did not provide clear evidence in support for this explanation. Recording of clinical and
Figure 1 Proportion with OAs diagnosis among patients with an incident primary total hip and knee replacement between 2000 and 2015.
Notes: Square, diamond, and circle line represents proportion of clinical OA, diagnosed OA (any joint) and diagnosed OA (joint-specific), respectively. Black and gray lines
indicate the proportion with diagnosis in the 10 years and 3 years prior to index joint replacement, respectively.
Abbreviation: OA, osteoarthritis.
2000 2001 2002 2003 2004 2005 2006 2007 2008 2009 2010 2011 2012 2013 2014 2015
01
02
03
04
05
06
07
08
09
0
100
Proportion,
%
Calendar year Primary total hip replacement
2000 2001 2002 2003 2004 2005 2006 2007 2008 2009 2010 2011 2012 2013 2014 2015
01
02
03
04
05
06
07
08
09
0
100
Proportion,
%
Calendar year
Primary total knee replacement
Clinical Epidemiology downloaded from https://www.dovepress.com/ by 118.70.13.36 on 20-Aug-2020
Dovepress Underrecorded osteoarthritis in UK primary care
diagnosed OA was lower among older patients undergoing THR compared with younger patients. This may reflect the effect of competing comorbidity but also other indications for THR in the older age group, notably for fracture of the neck of femur. Based on NJR data, only 2.8% of elective THR are performed for this indication, insufficient to fully explain our findings, although the primary care EHR may capture emergency as well as elective THR. It was not pos-sible to distinguish between elective and nonelective joint replacements in our study, and hence to determine whether nonelective replacements have increased over time. Among younger THR patients, the proportion with a prior OA diag-nosis was comparatively high and did not decline as much
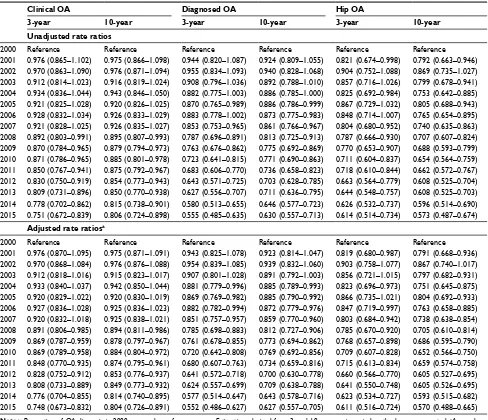
over time. The age-related pattern was reversed for knee OA, with older TKR patients more likely than younger patients to have a recorded diagnosis of OA. One speculative reason for this might be the use of specific non-OA codes in the younger age group (eg, degenerative meniscal lesions) which we did not include in our “clinical OA” codelist. Irrespective of these differences, it should be noted that each group and sex saw a decline in sensitivity of recording for each patient defini-tion of OA, suggesting that broader systems-wide factors are likely to be responsible for the observed decline in recording of OA. We are not aware of any significant change in coding systems over the period of observation that would contribute to such a pattern of results. Irrespective of the underlying Table 1 Rate ratios for OA diagnosis among patients with an incident primary total hip replacement between 2000 and 2015
Clinical OA Diagnosed OA Hip OA
3-year 10-year 3-year 10-year 3-year 10-year
Unadjusted rate ratios
2000 Reference Reference Reference Reference Reference Reference
2001 0.976 (0.865–1.102) 0.975 (0.866–1.098) 0.944 (0.820–1.087) 0.924 (0.809–1.055) 0.821 (0.674–0.998) 0.792 (0.663–0.946) 2002 0.970 (0.863–1.090) 0.976 (0.871–1.094) 0.955 (0.834–1.093) 0.940 (0.828–1.068) 0.904 (0.752–1.088) 0.869 (0.735–1.027) 2003 0.912 (0.814–1.023) 0.916 (0.819–1.024) 0.908 (0.796–1.036) 0.892 (0.788–1.010) 0.857 (0.716–1.026) 0.799 (0.678–0.941) 2004 0.934 (0.836–1.044) 0.943 (0.846–1.050) 0.882 (0.775–1.003) 0.886 (0.785–1.000) 0.825 (0.692–0.984) 0.753 (0.642–0.885) 2005 0.921 (0.825–1.028) 0.920 (0.826–1.025) 0.870 (0.765–0.989) 0.886 (0.786–0.999) 0.867 (0.729–1.032) 0.805 (0.688–0.943) 2006 0.928 (0.832–1.034) 0.926 (0.833–1.029) 0.883 (0.778–1.002) 0.873 (0.775–0.983) 0.848 (0.714–1.007) 0.765 (0.654–0.895) 2007 0.921 (0.828–1.025) 0.926 (0.835–1.027) 0.853 (0.753–0.965) 0.861 (0.766–0.967) 0.804 (0.680–0.952) 0.740 (0.635–0.863) 2008 0.892 (0.803–0.991) 0.895 (0.807–0.993) 0.787 (0.696–0.891) 0.813 (0.725–0.913) 0.787 (0.666–0.930) 0.707 (0.607–0.824) 2009 0.870 (0.784–0.965) 0.879 (0.794–0.973) 0.763 (0.676–0.862) 0.775 (0.692–0.869) 0.770 (0.653–0.907) 0.688 (0.593–0.799) 2010 0.871 (0.786–0.965) 0.885 (0.801–0.978) 0.723 (0.641–0.815) 0.771 (0.690–0.863) 0.711 (0.604–0.837) 0.654 (0.564–0.759) 2011 0.850 (0.767–0.941) 0.875 (0.792–0.967) 0.683 (0.606–0.770) 0.736 (0.658–0.823) 0.718 (0.610–0.844) 0.662 (0.572–0.767) 2012 0.830 (0.750–0.919) 0.854 (0.773–0.943) 0.643 (0.571–0.725) 0.703 (0.628–0.785) 0.663 (0.564–0.779) 0.608 (0.525–0.704) 2013 0.809 (0.731–0.896) 0.850 (0.770–0.938) 0.627 (0.556–0.707) 0.711 (0.636–0.795) 0.644 (0.548–0.757) 0.608 (0.525–0.703) 2014 0.778 (0.702–0.862) 0.815 (0.738–0.901) 0.580 (0.513–0.655) 0.646 (0.577–0.723) 0.626 (0.532–0.737) 0.596 (0.514–0.690) 2015 0.751 (0.672–0.839) 0.806 (0.724–0.898) 0.555 (0.485–0.635) 0.630 (0.557–0.713) 0.614 (0.514–0.734) 0.573 (0.487–0.674)
Adjusted rate ratiosa
2000 Reference Reference Reference Reference Reference Reference
2001 0.976 (0.870–1.095) 0.975 (0.871–1.091) 0.943 (0.825–1.078) 0.923 (0.814–1.047) 0.819 (0.680–0.987) 0.791 (0.668–0.936) 2002 0.970 (0.868–1.084) 0.976 (0.876–1.088) 0.954 (0.839–1.085) 0.939 (0.832–1.060) 0.903 (0.758–1.077) 0.867 (0.740–1.017) 2003 0.912 (0.818–1.016) 0.915 (0.823–1.017) 0.907 (0.801–1.028) 0.891 (0.792–1.003) 0.856 (0.721–1.015) 0.797 (0.682–0.931) 2004 0.933 (0.840–1.037) 0.942 (0.850–1.044) 0.881 (0.779–0.996) 0.885 (0.789–0.993) 0.823 (0.696–0.973) 0.751 (0.645–0.875) 2005 0.920 (0.829–1.022) 0.920 (0.830–1.019) 0.869 (0.769–0.982) 0.885 (0.790–0.992) 0.866 (0.735–1.021) 0.804 (0.692–0.933) 2006 0.927 (0.836–1.028) 0.925 (0.836–1.023) 0.882 (0.782–0.994) 0.872 (0.779–0.976) 0.847 (0.719–0.997) 0.763 (0.658–0.885) 2007 0.920 (0.832–1.018) 0.925 (0.838–1.021) 0.851 (0.757–0.957) 0.859 (0.770–0.960) 0.803 (0.684–0.942) 0.738 (0.638–0.854) 2008 0.891 (0.806–0.985) 0.894 (0.811–0.986) 0.785 (0.698–0.883) 0.812 (0.727–0.906) 0.785 (0.670–0.920) 0.705 (0.610–0.814) 2009 0.869 (0.787–0.959) 0.878 (0.797–0.967) 0.761 (0.678–0.855) 0.773 (0.694–0.862) 0.768 (0.657–0.898) 0.686 (0.595–0.790) 2010 0.869 (0.789–0.958) 0.884 (0.804–0.972) 0.720 (0.642–0.808) 0.769 (0.692–0.856) 0.709 (0.607–0.828) 0.652 (0.566–0.750) 2011 0.848 (0.770–0.935) 0.874 (0.795–0.961) 0.680 (0.607–0.763) 0.734 (0.659–0.816) 0.715 (0.613–0.834) 0.659 (0.574–0.758) 2012 0.828 (0.752–0.912) 0.853 (0.776–0.937) 0.641 (0.572–0.718) 0.700 (0.630–0.778) 0.660 (0.566–0.770) 0.605 (0.527–0.695) 2013 0.808 (0.733–0.889) 0.849 (0.773–0.932) 0.624 (0.557–0.699) 0.709 (0.638–0.788) 0.641 (0.550–0.748) 0.605 (0.526–0.695) 2014 0.776 (0.704–0.855) 0.814 (0.740–0.895) 0.577 (0.514–0.647) 0.643 (0.578–0.716) 0.623 (0.534–0.727) 0.593 (0.515–0.682) 2015 0.748 (0.673–0.832) 0.804 (0.726–0.891) 0.552 (0.486–0.627) 0.627 (0.557–0.705) 0.611 (0.516–0.724) 0.570 (0.488–0.665)
Notes: Proportion of OA diagnosis in 2000 was used as reference group. Estimations derived from 3- and 10-year run-in period methods were presented. aAge and sex were adjusted.
Abbreviation: OA, osteoarthritis.
Clinical Epidemiology downloaded from https://www.dovepress.com/ by 118.70.13.36 on 20-Aug-2020
Dovepress
Yu et al
reasons, the effect is most likely a substantial underestimate of the consultation incidence and prevalence of osteoarthritis in UK primary care when relying on diagnostic codes alone to identify patients. Future studies addressing the validity of OA diagnosis made in primary care settings will be planned, which could be used to correct the consultation incidence and prevalence estimates.
Conclusion
Our findings suggest a worsening trend in the underrecording of osteoarthritis in UK primary care. While our study does not provide clear evidence on the cause of this nor on a solution, researchers, practitioners, and policymakers should expect that estimates of the consultation incidence and prevalence of
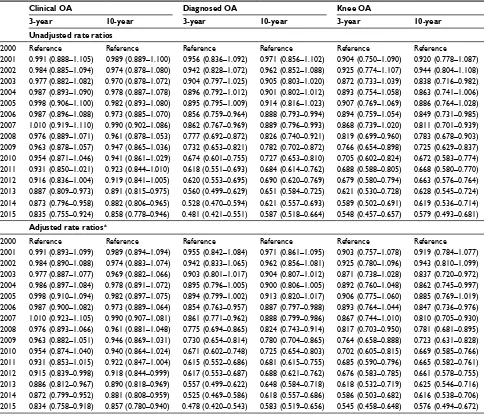
Table 2 Rate ratios for OA diagnosis among patients with an incident primary total knee replacement between 2000 and 2015
Clinical OA Diagnosed OA Knee OA
3-year 10-year 3-year 10-year 3-year 10-year
Unadjusted rate ratios
2000 Reference Reference Reference Reference Reference Reference
2001 0.991 (0.888–1.105) 0.989 (0.889–1.100) 0.956 (0.836–1.092) 0.971 (0.856–1.102) 0.904 (0.750–1.090) 0.920 (0.778–1.087) 2002 0.984 (0.885–1.094) 0.974 (0.878–1.080) 0.942 (0.828–1.072) 0.962 (0.852–1.088) 0.925 (0.774–1.107) 0.944 (0.804–1.108) 2003 0.977 (0.882–1.082) 0.970 (0.878–1.072) 0.904 (0.797–1.025) 0.905 (0.803–1.020) 0.872 (0.733–1.039) 0.838 (0.716–0.982) 2004 0.987 (0.893–1.090) 0.978 (0.887–1.078) 0.896 (0.792–1.012) 0.901 (0.802–1.012) 0.893 (0.754–1.058) 0.863 (0.741–1.006) 2005 0.998 (0.906–1.100) 0.982 (0.893–1.080) 0.895 (0.795–1.009) 0.914 (0.816–1.023) 0.907 (0.769–1.069) 0.886 (0.764–1.028) 2006 0.987 (0.896–1.088) 0.973 (0.885–1.070) 0.856 (0.759–0.964) 0.888 (0.793–0.994) 0.894 (0.759–1.054) 0.849 (0.731–0.985) 2007 1.010 (0.919–1.110) 0.990 (0.902–1.086) 0.862 (0.767–0.969) 0.889 (0.796–0.993) 0.868 (0.739–1.020) 0.811 (0.701–0.939) 2008 0.976 (0.889–1.071) 0.961 (0.878–1.053) 0.777 (0.692–0.872) 0.826 (0.740–0.921) 0.819 (0.699–0.960) 0.783 (0.678–0.903) 2009 0.963 (0.878–1.057) 0.947 (0.865–1.036) 0.732 (0.653–0.821) 0.782 (0.702–0.872) 0.766 (0.654–0.898) 0.725 (0.629–0.837) 2010 0.954 (0.871–1.046) 0.941 (0.861–1.029) 0.674 (0.601–0.755) 0.727 (0.653–0.810) 0.705 (0.602–0.824) 0.672 (0.583–0.774) 2011 0.931 (0.850–1.021) 0.923 (0.844–1.010) 0.618 (0.551–0.693) 0.684 (0.614–0.762) 0.688 (0.588–0.805) 0.668 (0.580–0.770) 2012 0.916 (0.836–1.004) 0.919 (0.841–1.005) 0.620 (0.553–0.695) 0.690 (0.620–0.769) 0.679 (0.580–0.794) 0.663 (0.576–0.764) 2013 0.887 (0.809–0.973) 0.891 (0.815–0.975) 0.560 (0.499–0.629) 0.651 (0.584–0.725) 0.621 (0.530–0.728) 0.628 (0.545–0.724) 2014 0.873 (0.796–0.958) 0.882 (0.806–0.965) 0.528 (0.470–0.594) 0.621 (0.557–0.693) 0.589 (0.502–0.691) 0.619 (0.536–0.714) 2015 0.835 (0.755–0.924) 0.858 (0.778–0.946) 0.481 (0.421–0.551) 0.587 (0.518–0.664) 0.548 (0.457–0.657) 0.579 (0.493–0.681)
Adjusted rate ratiosa
2000 Reference Reference Reference Reference Reference Reference
2001 0.991 (0.893–1.099) 0.989 (0.894–1.094) 0.955 (0.842–1.084) 0.971 (0.861–1.095) 0.903 (0.757–1.078) 0.919 (0.784–1.077) 2002 0.984 (0.890–1.088) 0.974 (0.883–1.074) 0.942 (0.833–1.065) 0.962 (0.856–1.081) 0.925 (0.780–1.096) 0.943 (0.810–1.099) 2003 0.977 (0.887–1.077) 0.969 (0.882–1.066) 0.903 (0.801–1.017) 0.904 (0.807–1.012) 0.871 (0.738–1.028) 0.837 (0.720–0.972) 2004 0.986 (0.897–1.084) 0.978 (0.891–1.072) 0.895 (0.796–1.005) 0.900 (0.806–1.005) 0.892 (0.760–1.048) 0.862 (0.745–0.997) 2005 0.998 (0.910–1.094) 0.982 (0.897–1.075) 0.894 (0.799–1.002) 0.913 (0.820–1.017) 0.906 (0.775–1.060) 0.885 (0.769–1.019) 2006 0.987 (0.900–1.082) 0.973 (0.889–1.064) 0.854 (0.763–0.957) 0.887 (0.797–0.988) 0.893 (0.764–1.044) 0.847 (0.736–0.976) 2007 1.010 (0.923–1.105) 0.990 (0.907–1.081) 0.861 (0.771–0.962) 0.888 (0.799–0.986) 0.867 (0.744–1.010) 0.810 (0.705–0.930) 2008 0.976 (0.893–1.066) 0.961 (0.881–1.048) 0.775 (0.694–0.865) 0.824 (0.743–0.914) 0.817 (0.703–0.950) 0.781 (0.681–0.895) 2009 0.963 (0.882–1.051) 0.946 (0.869–1.031) 0.730 (0.654–0.814) 0.780 (0.704–0.865) 0.764 (0.658–0.888) 0.723 (0.631–0.828) 2010 0.954 (0.874–1.040) 0.940 (0.864–1.024) 0.671 (0.602–0.748) 0.725 (0.654–0.803) 0.702 (0.605–0.815) 0.669 (0.585–0.766) 2011 0.931 (0.853–1.015) 0.922 (0.847–1.004) 0.615 (0.552–0.686) 0.681 (0.615–0.755) 0.685 (0.590–0.796) 0.665 (0.582–0.761) 2012 0.915 (0.839–0.998) 0.918 (0.844–0.999) 0.617 (0.553–0.687) 0.688 (0.621–0.762) 0.676 (0.583–0.785) 0.661 (0.578–0.755) 2013 0.886 (0.812–0.967) 0.890 (0.818–0.969) 0.557 (0.499–0.622) 0.648 (0.584–0.718) 0.618 (0.532–0.719) 0.625 (0.546–0.716) 2014 0.872 (0.799–0.952) 0.881 (0.808–0.959) 0.525 (0.469–0.586) 0.618 (0.557–0.686) 0.586 (0.503–0.682) 0.616 (0.538–0.706) 2015 0.834 (0.758–0.918) 0.857 (0.780–0.940) 0.478 (0.420–0.543) 0.583 (0.519–0.656) 0.545 (0.458–0.648) 0.576 (0.494–0.672)
Notes: Proportion of OA diagnosis in 2000 was used as reference group. Estimations derived from 3- and 10-year run-in period methods were presented. aAge and sex were adjusted.
Abbreviation: OA, osteoarthritis.
OA from these data that rely on OA diagnostic codes are likely to seriously underestimate the scale of health care demand.
Author contributions
All authors made substantial contributions to conception and design, acquisition of data, or analysis and interpretation of data; took part in drafting the article or revising it critically for important intellectual content; gave final approval of the version to be published; and agree to be accountable for all aspects of the work.
Acknowledgments
GP and KPJ would like to thank Public Health England for their Honorary Academic Consultant Contracts. This research
Clinical Epidemiology downloaded from https://www.dovepress.com/ by 118.70.13.36 on 20-Aug-2020
Dovepress
Clinical Epidemiology
Publish your work in this journal
Submit your manuscript here: https://www.dovepress.com/clinical-epidemiology-journal
Clinical Epidemiology is an international, peer-reviewed, open access, online journal focusing on disease and drug epidemiology, identifica-tion of risk factors and screening procedures to develop optimal pre-ventative initiatives and programs. Specific topics include: diagnosis, prognosis, treatment, screening, prevention, risk factor modification,
systematic reviews, risk and safety of medical interventions, epidemiol-ogy and biostatistical methods, and evaluation of guidelines, translational medicine, health policies and economic evaluations. The manuscript management system is completely online and includes a very quick and fair peer-review system, which is all easy to use.
Dove
press
Underrecorded osteoarthritis in UK primary care
was funded by infrastructure support funds from North Staf-fordshire Primary Care Research Consortium and Keele University Research Institute for Primary Care and Health Sciences. This study is based in part on data from the Clinical Practice Research Datalink obtained under license from the UK Medicines and Healthcare Products Regulatory Agency. The interpretation and conclusions contained in this study are those of the authors alone.
Disclosure
The authors report no conflicts of interest in this work.
References
1. Coorevits P, Sundgren M, Klein GO, et al. Electronic health records: new opportunities for clinical research. J Intern Med. 2013;274(6):547–560. 2. Kopec JA, Rahman MM, Sayre EC, et al. Trends in physician-diag-nosed osteoarthritis incidence in an administrative database in British Columbia, Canada, 1996–1997 through 2003–2004. Arthritis Rheum. 2008;59(7):929–934.
3. National Clinical Guideline Centre (UK). Osteoarthritis: Care and
Man-agement in Adults. London: National Clinical Guideline Centre; 2014.
4. Bedson J, McCarney R, Croft P. Labelling chronic illness in primary care: a good or a bad thing? Br J Gen Pract. 2004;54(509):932–938. 5. Gabriel SE, Crowson CS, O’Fallon WM. A mathematical model that
improves the validity of osteoarthritis diagnoses obtained from a com-puterized diagnostic database. J Clin Epidemiol. 1996;49(9):1025–1029. 6. Shrestha S, Dave AJ, Losina E, Katz JN. Diagnostic accuracy of admin-istrative data algorithms in the diagnosis of osteoarthritis: a systematic review. BMC Med Inform Decis Mak. 2016;16:82.
7. Rahman MM, Kopec JA, Goldsmith CH, Anis AH, Cibere J. Validation of administrative osteoarthritis diagnosis using a clinical and radio-logical population-based cohort. Int J Rheumatol. 2016;2016:6475318. 8. Harrold LR, Yood RA, Straus W, et al. Challenges of estimating health service utilization for osteoarthritis patients on a population level.
J Rheumatol. 2002;29(9):1931–1936.
9. National Joint Registry. National Joint Registry for England and Wales:
14th Annual Report. Hemel Hempstead: National Joint Registry; 2017.
10. Herrett E, Gallagher AM, Bhaskaran K, et al. Data resource pro-file: Clinical Practice Research Datalink (CPRD). Int J Epidemiol. 2015;44(3):827–836.
11. Herrett E, Thomas SL, Schoonen WM, Smeeth L, Hall AJ. Validation and validity of diagnoses in the General Practice Research Database: a systematic review. Br J Clin Pharmacol. 2010;69(1):4–14.
12. Culliford D, Maskell J, Judge A, et al. Future projections of total hip and knee arthroplasty in the UK: results from the UK Clinical Practice Research Datalink. Osteoarthritis Cartilage. 2015;23(4):594–600. 13. Hawley S, Delmestri A, Judge A, et al. Total hip and knee replacement
among incident osteoarthritis and rheumatoid arthritis patients within the UK Clinical Practice Research Datalink (CPRD) compared to Hos-pital Episode Statistics (HES): a validation study. Pharmacoepidemiol
Drug Safety. 2016;25(Suppl 3):251.
14. Brilleman SL, Salisbury C. Comparing measures of multimorbidity to predict outcomes in primary care: a cross sectional study. Fam Pract. 2013;30(2):172–178.
15. Yu D, Jordan KP, Bedson J, et al. Population trends in the incidence and initial management of osteoarthritis: age-period-cohort analysis of the Clinical Practice Research Datalink, 1992–2013. Rheumatology
(Oxford). 2017;56(11):1902–1917.
16. Marshall DA, Vanderby S, Barnabe C, et al. Estimating the burden of osteoarthritis to plan for the future. Arthritis Care Res (Hoboken). 2015;67(10):1379–1386.
17. Hollowell J. The General Practice Research Database: quality of mor-bidity data. Popul Trends. 1997;87:36–40.
18. Lawson DH, Sherman V, Hollowel J. The General Practice Research Data-base. Scientific and Ethical Advisory Group. QJM. 1998;91(6):445–452. 19. Porcheret M, Hughes R, Evans D, et al. Data quality of general practice electronic health records: the impact of a program of assessments, feedback, and training. J Am Med Inform Assoc. 2004;11(1):78–86. 20. Jordan KP, Tan V, Edwards JJ, et al. Influences on the decision to use
an osteoarthritis diagnosis in primary care: a cohort study with linked survey and electronic health record data. Osteoarthritis Cartilage. 2016;24(5):786–793.
21. Millett ER, Quint JK, De Stavola BL, Smeeth L, Thomas SL. Improved incidence estimates from linked vs stand-alone electronic health records.
J Clin Epidemiol. 2016;75:66–69.
Clinical Epidemiology downloaded from https://www.dovepress.com/ by 118.70.13.36 on 20-Aug-2020