Western University Western University
Scholarship@Western
Scholarship@Western
Electronic Thesis and Dissertation Repository
5-14-2018 10:00 AM
Analysis and Tectonic Synthesis of the Multiscale Structures
Analysis and Tectonic Synthesis of the Multiscale Structures
along the Shangdan Tectonic Zone in the Qinling Orogenic Belt,
along the Shangdan Tectonic Zone in the Qinling Orogenic Belt,
China
China
Mengmeng Qu
The University of Western Ontario Supervisor
Jiang, Dazhi
The University of Western Ontario Graduate Program in Geology
A thesis submitted in partial fulfillment of the requirements for the degree in Doctor of Philosophy
© Mengmeng Qu 2018
Follow this and additional works at: https://ir.lib.uwo.ca/etd Part of the Tectonics and Structure Commons
Recommended Citation Recommended Citation
Qu, Mengmeng, "Analysis and Tectonic Synthesis of the Multiscale Structures along the Shangdan Tectonic Zone in the Qinling Orogenic Belt, China" (2018). Electronic Thesis and Dissertation Repository. 5383.
https://ir.lib.uwo.ca/etd/5383
This Dissertation/Thesis is brought to you for free and open access by Scholarship@Western. It has been accepted for inclusion in Electronic Thesis and Dissertation Repository by an authorized administrator of
i
Abstract
Geological structures occur on a vast range of scales in Earth’s lithosphere.
Because Earth’s lithosphere is rheologically heterogeneous, a multiscale approach is
necessary to relate these structures to the tectonic history of orogens. One such
approach, called the multi-order power-law approach (MOPLA), has been developed
recently. In this study, MOPLA is applied to the Shangdan tectonic zone (SDTZ) in
the Qinling orogenic belt (QOB). The kinematics of the SDTZ and its relation to the
country rock deformation are crucial questions for Qinling tectonics, having both been
the subject of debate for decades. Detailed work is conducted along the SDTZ to
address these two fundamental questions.
MOPLA treats a heterogeneous material as a continuum of rheologically
distinct elements. The rheological properties of the material and the mechanical fields
of the constituent elements are computed by solving the partitioning and
homogenization equations self-consistently. The computation is based heavily on the
numerical evaluation of Eshelby tensors. This thesis develops an optimal scheme for
evaluating Eshelby tensors and implements the scheme in MATLAB to improve the
computational efficiency of MOPLA.
Multiscale structural analysis is performed along the SDTZ. Three deformation
events are identified in the SDTZ and its adjacent areas. D1 deformation is a NE-SW
shortening deformation and occurred between ca.385-355Ma. D1 deformation is only
observed to the north of the SDTZ in western Qinling. D2 deformation is a strike-slip
ii
deformation is a dextral strike-slip along the SDTZ. In eastern Qinling, D2 deformation
is a sinistral strike-slip along the SDTZ and N-S shortening deformation in the Liuling
Group that is south of the SDTZ. D3 deformation is an along-orogen extension and
occurred between ca.140-135Ma. D3 deformation is only observed in the Liuling
Group in eastern Qinling. D2 deformation, the opposite shearing along the SDTZ and
the N-S shortening deformation in the Liuling Group, was a response to the oblique
convergence between the South China Block and the North China Block. The
convergence angle is constrained to 20°~40° using MOPLA. The tectonic evolution
of the QOB from the late Paleozoic to early Mesozoic is illustrated.
Keywords
Multiscale modeling, Flow partitioning, Structural analysis, Tectonic evolution,
iii
Co-Authorship Statement
An earlier version of Chapter 2 in this thesis was published as a co-authored paper with my supervisor, Dr. Dazhi Jiang, and Lucy X. Lu (PhD student supervised by Dr. Dazhi Jiang).
Qu, M., Jiang, D., Lu, L.X. 2016. An optimal scheme for numerical evaluation of Eshelby tensors and its implementation in a MATLAB package for simulating the motion of viscous ellipsoids in slow flows. Computers & Geosciences 96 (2016): 98-108.
iv
Dedication
v
Acknowledgements
While working on the graduate program in Western University, I have
benefited greatly from a large group of people.
First and foremost, I thank my supervisor, Dr. Dazhi Jiang, for the continuous
support of my PhD research, for his immense knowledge on structural geology and
tectonics, the never-ending enthusiasm and motivation in different research fields,
caring and encouragement during my study at Western and my life in Canada. The
accomplishment of this thesis would not be possible without his help.
Besides my supervisor, I thank the rest of my thesis committee: Dr. Richard
Secco and Dr. Desmond Moser, for their encouragement, insightful suggestions,
comments and questions during the comprehensive exam and the committee meeting.
I also thank Dr. Desmond Moser for the extra help on the geochronological studies,
and I thank Dr. Richard Secco for the suggestions and comments on the preliminary
version of this thesis.
In addition, I thank Dr. Robert Shcherbakov and Dr. Colin Denniston for the two excellent courses that I have taken. One is ‘Computer Modelling of Natural Processes’ given by Dr. Robert Shcherbakov. During this course, I was surprised by
the powerfulness of MATLAB, and thus motivated to move most of my programming work from MathCad to MATLAB. The other course is ‘Scientific Computing’ given
by Dr. Colin Denniston in Applied Mathematics department. In this course, I have
learned how efficient the computation could be in a parallel computing program.
Although I do not have time to apply the parallel computing in my current research, I
will definitely apply it into my future work.
My sincere thanks also go to my field assistants. In the order of their
participation, they are Wenhang Liu, Yuanzhen Yang, Weiyin Chen, Lujun Lin, Teng
Wang, Bo Zhang, Rui Yang in summers 2013-2016. I would like to thank Dr. Wei Li
and Dr. Wentian Liang in Northwest University for the field guidance in east Qinling
and west Qinling, respectively. Without their help, I would not have smoothly and
vi
Finally, great thanks give to my family and friends for their love and supports
in various aspects. Especially, I thank my colleague Rui Yang for performing the
U-Pb dating of samples from the Shetang and Xinyang areas using a laser ablation
inductively coupled plasma mass spectrometry at Northwest University. I thank Jiao
Zhao for suggestions on processing U-Pb data. I thank Dr. Shuo Sun for the companion
during the dark days. I thank my roommate and colleague Lucy Lu for the delicious
food, great tea, encouraging words, good discussions and help on writing and
debugging. I thank my parents for always trusting me, for giving me all their love and
vii
Table of Contents
Abstract ... i
Co-Authorship Statement... iii
Dedication ... iv
Acknowledgements ... v
List of Tables ... xiii
List of Figures ... xiv
List of Appendices ... xix
Nomenclature ... xx
Chapter 1: Introduction ... 1
1.1. The multiscale problem in structural geology studies ... 1
1.2. MOPLA... 3
1.2.1 The aim of MOPLA ... 4
1.2.2 The backbone theory of MOPLA ... 8
1.2.3 Homogenization systems in MOPLA ... 9
1.3. Application to the Shangdan tectonic zone in the Qinling orogenic belt ... 11
viii
1.3.2 The framework of the QOB ... 15
1.4. Objectives and methodology... 16
1.5. Thesis outline ... 17
1.6. References ... 18
Chapter 2: An Optimal Scheme for Numerical Evaluation of Eshelby Tensors and Its Implementation in a MATLAB Package for Simulating the Motion of Viscous Ellipsoids in Slow Flows ... 25
2.1 Introduction ... 25
2.2 Numerical evaluation of Eshelby tensors ... 30
2.2.1 The Eshelby inclusion solutions and Eshelby tensors ... 30
2.2.2 Numerical evaluation of
T
ijkl ... 332.3 An optimal scheme ... 37
2.4 A MATLAB package for simulating the motion of rigid and deformable inclusions ... 42
2.4.1 A brief summary of important equations for rigid and deformable ellipsoids ... 43
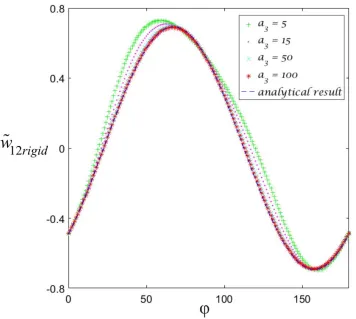
2.4.2 Verification and examples ... 44
2.4.3 Structure of the package... 53
2.5 Summary and discussion... 54
ix
Chapter 3: Deformation of the Shangdan Tectonic Zone in the Eastern Qinling
Orogenic Belt ... 63
3.1 Introduction ... 63
3.2 The Shangdan tectonic zone ... 69
3.2.1 Geological setting ... 69
3.2.2 Structural geometry ... 71
3.2.2.1The Heihe area ... 71
3.2.2.2The Danfeng area ... 79
3.3 Theoretical modeling ... 84
3.3.1 Numerical model setup ... 85
3.3.2 Modeling results... 88
3.3.3 Comparison of the simulation results with the field data ... 96
3.4 Deformation time of the SDTZ ... 97
3.4.1 The dominant strike-slip deformation along the SDTZ and D1 deformation in the Liuling Group ... 97
3.4.2 D2 deformation in the Liuling Group ... 99
3.5 Summary ... 100
3.6 References ... 101
x
4.1 Introduction ... 106
4.2 Field data ... 109
4.2.1 Geological setting ... 109
4.2.2 Structural geometric features ... 111
4.2.2.1The Yuanlong area ... 111
4.2.2.2The Shetang area ... 114
4.2.2.3The Xinyang area ... 118
4.2.2.4The Wushan area... 129
4.3 Geochronology data ... 130
4.3.1 Sample descriptions ... 130
4.3.1.1Samples from the Yuanlong area ... 130
4.3.1.2Samples from the Shetang area ... 130
4.3.1.3Samples from the Xinyang area ... 133
4.3.2 Analytical procedures ... 133
4.3.3 Geochronological results ... 135
4.4 Interpretations and summary... 138
4.4.1 Xenocrystic ages from the samples... 138
4.4.1.1The Archean and Proterozoic age group (2623.6~646.3Ma, 213/377 analyses)... 139
4.4.1.2The Paleozoic age group (524.3~343.6Ma, 159/377 analyses)
xi
4.4.1.3The Mesozoic age group (234.5~121.7Ma, 5/377 analyses) 142
4.4.2 Deformation time and kinematic interpretations of the
Xinyang-Yuanlong shear zone ... 143
4.4.2.1Deformation time in the Yuanlong area... 143
4.4.2.2Deformation time in the Xinyang area... 144
(1) District 1, the Xiweizi valley ... 144
(2) District 2, the Moshi valley ... 144
(3) District 3, northeast of the Xiweizi and Moshi valleys ... 145
4.4.2.3Deformation in the Shetang area ... 145
4.4.2.4Deformation in the Wushan area ... 146
4.4.2.5The kinematics of the Xinyang-Yuanlong shear zone ... 147
4.5 The deformation along the SDTZ in western Qinling ... 153
4.6 Tectonic implications ... 154
4.6.1 The importance of the strike-slip deformation in the QOB ... 154
4.6.2 The tectonic configuration of the QOB before the Triassic ... 156
4.6.3 Tectonic model of the QOB during Triassic ... 161
4.6.4 The Cretaceous E-W extension recorded in the Liuling Group ... 164
4.7 References ... 166
xii
5.1 Contribution of this work ... 177
5.2 Future work ... 179
5.3 References ... 181
Appendices ... 183
xiii
List of Tables
Table E1 LA-ICP-MS U-Pb zircon dating results of the samples from the Yuanlong
area ... 197
Table E2 LA-ICP-MS U-Pb zircon dating results of the samples from the Shetang area ... 200
Table E3 LA-ICP-MS U-Pb zircon dating results of the samples from the Xinyang area ... 206
Table E4. REE contents (ppm) of the samples from the Yuanlong area ... 209
Table E5. REE contents (ppm) of the samples from the Shetang area ... 212
xiv
List of Figures
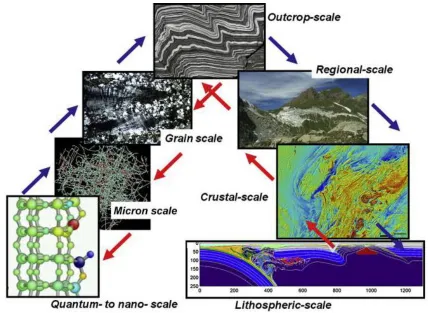
Figure 1.1 Spatial scales associated with the deformation of Earth’s lithosphere ... 2
Figure 1.2 Heterogenous deformation throughout Earth’s lithosphere ... 3
Figure 1.3 A multiscale approach to study natural deformation ... 7
Figure 1.4 An Eshelby inclusion in an infinite linear elastic medium ... 9
Figure 1.5 A conceptual diagram to show the two types of homogenization schemes in MOPLA ... 10
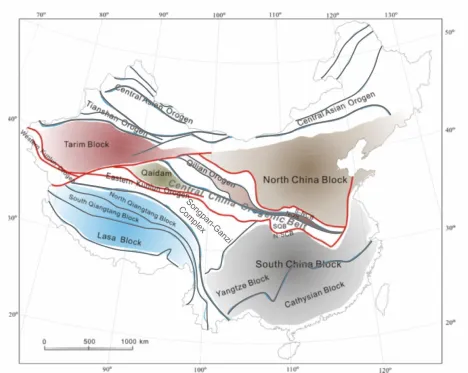
Figure 1.6 A simplified tectonic map of China showing the major tectonic units and central China orogenic belt ... 12
Figure 1.7 A geological map of Qinling orogenic belt and its adjacent areas ... 14
Figure 1.8 A satellite map to show the field work areas ... 16
Figure 2.1 A conceptual diagram to illustrate three different scenarios of a clast-matrix system ... 28
Figure 2.2 Ellipsoid shape quantified by two parameters (R and Φ) in the Flinn space ... 38
Figure 2.3 The contour plot of computation time (s) with respect to R and Φ ... 40
Figure 2.4 Optimal quadrature and associated node numbers for different shapes of the inclusion according to the iterative tests ... 42
Figure 2.5 An execution of SGLRGD ... 45
Figure 2.6 An isotropic ellipsoid embedded in a matrix with planar anisotropy ... 47
xv
Figure 2.8 Comparison of the strain rates differences ... 51
Figure 2.9 An example of using SGLRGD ... 51
Figure 2.10 An example of using SGLDEF... 53
Figure 3.1 Geological maps to show the Qinling orogenic belt and the eastern Qinling
orogenic belt... 67
Figure 3.2 Geological map showing the geological units in the Heihe area... 70
Figure 3.3 Photos showing the deformed conglomerate at the Shaliangzi township 72
Figure 3.4 A diagram showing the concept of a fabric ellipsoid ... 73
Figure 3.5 Fabric data from the deformed conglomerate ... 76
Figure 3.6 Photos showing shear-sense indicators in the Maanqiao shear zone ... 77
Figure 3.7 A conceptual block diagram summarizing the fabrics in the Heihe area . 78
Figure 3.8 Geological map showing the geological units in the Danfeng area ... 79
Figure 3.9 Photos and fabric data from the high-strain zones ... 81
Figure 3.10 Two-generation structures observed in the high-strain zones ... 82
Figure 3.11 Lower-hemisphere equal-area projection of stretching lineations and
transposition foliations in the Liuling Group ... 82
Figure 3.12 Photos showing D2 deformation in the Liuling Group ... 83
Figure 3.13 A conceptual block diagram (not to scale) to illustrate the following idea
... 84
xvi
Figure 3.15 Simulation results of lineations for different convergence angles (α) and
dip angles (β) ... 93
Figure 3.16 Simulation results of poles to foliations for different convergence angles (α) and dip angles (β) ... 95
Figure 3.17 Field lineations and transposition foliations rotated to the model coordinate system... 96
Figure 4.1 Maps showing the field work area ... 108
Figure 4.2 Photos and fabric data from the Yuanlong area ... 113
Figure 4.3 Geological map, photos and fabric data from the Shetang area ... 116
Figure 4.4 Geological map, photos and fabric data from the Xinyang area ... 117
Figure 4.5 Detailed mapping and photos from the Moshi valley ... 121
Figure 4.6 Detailed mapping and photos from unit 12 ... 124
Figure 4.7 Detailed mapping and photos from unit 14 ... 126
Figure 4.8 Detailed mapping and photos from unit 20 ... 128
Figure 4.9 Photos and fabric data from the Huluhe Group ... 128
Figure 4.10 Photos and fabric data from the Wushan area ... 129
Figure 4.11 Field photos of granitic pegmatitic dykes from the Yuanlong area ... 131
Figure 4.12 Field photos of granitic pegmatitic dykes from the Shetang area ... 132
Figure 4.13 Field photos to show dykes from the Xinyang area ... 134
xvii
Figure 4.15 Paleozoic age spectra from this study and Paleozoic granitoids in the north
Qinling belt ... 142
Figure 4.16 Distribution of granitoids with emphasis on Mesozoic granitoids in the Qinling orogenic belt ... 143
Figure 4.17 A conceptual diagram to show the interpretation of the fabric data from the Xinyang-Yuanlong shear zone ... 150
Figure 4.18 Transpression model in Jiang (2014) ... 151
Figure 4.19 Model predicted ‘stretching lineations’ patterns produced by different boundary conditions in Jiang (2014)... 153
Figure 4.20 Forward modeling in van Staal et al. (1998) ... 155
Figure 4.21 The comparison of the tectonic evolution models from Dong and Santosh (2016, left) and Liu et al. (2016, right) of the QOB during 600~400Ma ... 160
Figure 4.22 Schematic cartoons showing the tectonic evolution of the Qinling orogenic belt during the Triassic... 163
Figure 4.23 Geological map showing Neoproterozoic, Early Paleozoic, Late Triassic and Cretaceous magmatic intrusions in the Qinling orogenic belt ... 165
Figure E1 CL images and the REE pattern of TS1406 ... 225
Figure E2 CL images and the REE pattern of TS1408-1... 229
Figure E3 CL images and the REE pattern of TS1408-2... 233
Figure E4 CL images and the REE pattern of ST1502 ... 236
Figure E5 CL images and the REE pattern of ST1510-1... 239
xviii
Figure E7 CL images and the REE pattern of ST1511 ... 245
Figure E8 CL images and the REE pattern of ST1515 ... 249
Figure E9 CL images and the REE pattern of ST1512 ... 251
Figure E10 CL images and the REE pattern of ST1513 ... 255
Figure E11 Concordia diagrams and weighted mean ages of TS1512 and TS1513, respectively ... 256
Figure E12 CL images and the REE patterns of XY1605 ... 259
Figure E13 CL images and the REE patterns of XY1601A. ... 262
Figure E14 CL images and the REE patterns of XY1601B... 264
xix
List of Appendices
Appendix A: Empirical functions for the domain boundaries in Fig.2.4... 183
Appendix B: The MATLAB package instruction in Chapter 2 ... 184
Appendix C: Download link for the MATLAB package in Chapter 2. ... 185
Appendix D: The
R
f−
data from the deformed conglomerate in Chapter 3. ... 186xx
Nomenclature
Symbol quantities
1
a , a2, a3, ai the semi-axes of an ellipsoid (first, second, third,
general)
A strain-rate partitioning tensor (fourth order) for linear
materials or strain partitioning tensor for elastic
materials
boundary convergence angle of a transpression zone
B stress partitioning tensor (fourth order) for linear
materials
dip angle of a transpression zone or a high-strain zone
C elastic moduli or viscous stiffness tensor (fourth order)
C linearized viscous stiffness tensor
C HEM viscous stiffness tensor
microscale characteristic length
ij
Kronecker delta
t
time step for numerical computation
d mesoscale characteristic length
D macroscale characteristic length
D characteristic length of the whole deformation body
xxi
E elastic strain or viscous strain-rate tensor in the
far-field matrix or HEM (symmetric part of
L
in viscouscase)
ε, ε viscous strain-rate tensor (general or in the ellipsoid),
strain-rate difference between the ellipsoid and the
far-field matrix
F position gradient tensor (second order)
D J , A
J 4th order deviatoric and anti-symmetric identity tensors
L
velocity gradient tensor of matrix flow (second order)
fluctuation length of boundary loading or velocityconditions
m the strength of the anisotropy
Q transformation matrix defined by the orientation of an
ellipsoid
Θ angular velocity tensor of an ellipsoid
n power law stress exponent
n
, s foliation-normal viscosity, foliation-parallel viscosity
r
,reff , r0viscosity ratio between ellipsoid and matrix medium
(Newtonian, effective where one or both the ellipsoid
and the matrix medium are power law, effective at the
matrix medium strain-rate state)
σ ,σ, σ0
Cauchy stress tensor (general or in the ellipsoid), stress
xxii
matrix, pre-stress term in a linearized constitutive
relation
Σ, Σ0
Cauchy stress tensor in the far-field matrix or HEM,
pre-stress term in a linearized rheological relation for
the far-field matrix or HEM
S
symmetric Eshelby tensor for incompressible viscous
materials
Π
anti-symmetric Eshelby tensor for incompressible
viscous materials
T
Green interaction tensor for incompressible viscous
materials
w, w
vorticity, vorticity difference between the ellipsoid and
the far-field matrix medium
W
vorticity of the far-field matrix or HEM, anti-symmetric
part of
L
ω elastic rotation tensor
Super- or sub-script labelling
E ellipsoid
xxiii
K the k-th element
M matrix
tan tangent
sec secant
Acronyms
BXDS Bikou-Xiaomoling-Douling subduction zone
CCOB Central China orogenic belt
HEM Homogeneous effective medium
KPS Kuanping suture
LLWF Lingbao-Lushan-Wuyang fault
MBXF Mianlue-Bashan-Xiangguang fault
MHS Micangshan-Huangling subduction zone
MLS Mianlue suture
MOPLA Multi-order power-law approach
NCB North China block
xxiv
N-SCB Northern South China block
QOB Qinling orogenic belt
RDP Rheologically Distinct Phase
RVE Representative Volume Element
SCB South China Block
SDS Shangdan suture
SDTZ Shangdan tectonic zone
SFF Shangyang-Fengzhen fault
S-NCB Southern North China block
SQB South Qinling block
VPSC self-consistent viscoplastic formulation
1
Chapter 1: Introduction
1.1.
The multiscale problem in structural geology studies
Classical continuum models have been well studied and applied to structural analysis to
interpret the relationship between fabrics and flow fields in homogeneous rock units (e.g., Ramsay,
1967; Ramsay and Graham, 1970; Ramberg, 1975; Passchier and Trouw, 1996). To identify the
structural geometries and kinematics of a deformation zone, one conducts detailed structural
analysis and geochronological studies in key areas and then in most cases, attempts to deduce the
tectonic evolution of the zone. Field studies generally begin with observations of features at
outcrop scale (i.e., a scale of a few millimeters to several meters). Studies then may proceed
‘downscale’ to observations made at the microscopic or even electron-microscopic level of
microns, or ‘upscale’ to regional observations on a scale of hundreds to thousands of kilometers
(Fig.1.1, Bruce and Ord, 2015). However, when one must analyze structures for a wide range of
characteristic lengths in a single problem, the rheological heterogeneities of the lithosphere cause
flow partitioning (Lister and Williams, 1983; Jiang, 2014). Structural geology studies on relatively
small-scale features (‘minor structures’ in Jiang, 2013) are disconnected from large-scale tectonic
synthesis. This scale problem has been recognized for many decades in structural geology studies
(e.g., Lister and Williams, 1979, 1983; Jiang, 1994a,b; Jiang and White, 1995; Jiang and Williams,
1999). During the deformation of the lithosphere, the ‘bulk’ or ‘regional’ flow is partitioned into
different small-scale rheologically distinct domains, and the final structures and fabrics are
produced directly by the partitioned flow fields in ‘local’ domains (Fig.1.2). ‘Partitioning’ is
2
predictions of simple models, or, at other times, critique simple-minded extrapolations from
small-scale observations to large-small-scale processes. The use of small structures to infer tectonic processes
is impeded if ‘partitioning’ is not considered quantitatively. Classical single-scale models cannot
effectively address the heterogeneous deformation (Jiang, 2014). Therefore, a multiscale approach
is necessary to link small-scale geological observations to large-scale tectonic synthesis.
Figure 1.1 Spatial scales associated with the deformation of Earth’s lithosphere. The blue
arrows show the ‘upscale’ processes, the red arrows show the ‘downscale’ processes (Bruce
and Ord, 2015).
Recently, Jiang and Bentley (2012) and Jiang (2013, 2014) have developed a multiscale
3
quantitatively deal with ‘partitioning’ and bridge the scale gap between small-scale structures and
large-scale tectonic synthesis.
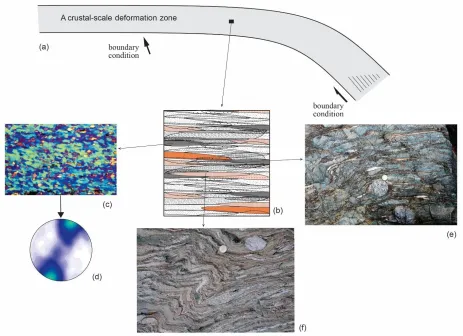
Figure 1.2 Heterogenous deformation throughout Earth’s lithosphere (modified after Jiang,
2014). (a) illustrates a crustal-scale deformation zone. (b) is a small region in the deformation
zone and composed of transposed deformation domains. (e) and (f) are variable structures
that are observed on outcrops. (c) and (d) are the microstructures observed under
microscopes. (c)-(f) are directly produced by the ‘local’ flow fields in each domain in (b).
1.2.
MOPLA
MOPLA stands for the multi-order power-law approach. MOPLA was built up to
4
lithosphere. MultiOrder means that with the idea of ‘elements within elements’, one can investigate
rheological elements with multiple characteristic lengths, from relatively large (lower-order)
elements (e.g., a deformed geological unit) to small (high-order) elements (e.g., fabric-defining
elements inside the deformed geological unit) using MOPLA. Power-Law indicates that MOPLA
considers deformed rocks as power-law viscous materials that reflect the rheological behavior of
rocks for ductile deformation (Tullis et al., 1991; Kohlstedt et al., 1995). The theoretical
formulations of MOPLA have been fully developed in Jiang (2014, 2016), and the algorithms are
implemented in MathCad and MATLAB.
1.2.1 The aim of MOPLA
The aim of MOPLA is to effectively investigate the heterogeneous deformation that is
mainly caused by the rheological heterogeneities in Earth’s lithosphere and to bridge the scale gap
between the small-scale observations to large-scale tectonic synthesis.
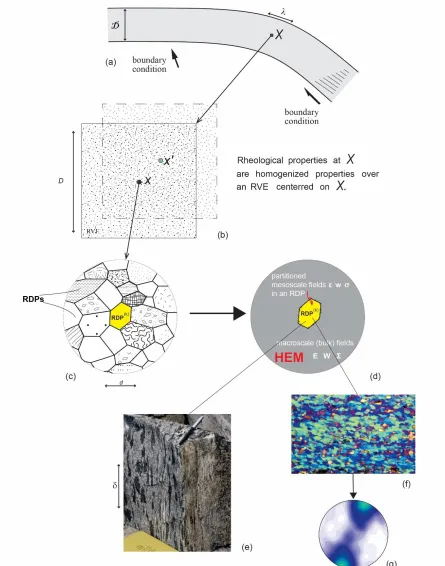
The idea of MOPLA is illustrated in Fig.1.3. Fig.1.3 considers three different scales, and
they are, from large to small, the macroscale, the mesoscale and the microscale. According to the
nature of a problem, one can consider more scales if necessary. There are many orders of
magnitude differences among the characteristic lengths of the three scales, and the absolute lengths
depend on exact problems. In Fig.1.3, the deformation in a crustal-scale zone is regarded as the
macroscale deformation (Fig.1.3a) with a characteristic length of D. The statistically homogenous
macroscale fields (‘regional’ stress, strain-rate and vorticity fields) are defined in terms of a
Representative Volume Element (RVE) at every location (X) with a characteristic length of D
(Fig.1.3b). If a neighbor location (X’ in Fig.1.3b) is considered, the RVE is slightly shifted but
most parts overlap with the previous RVE. The RVE is a large enough volume element containing
5
length of d (Fig.1.3c). D, the size of the RVE, represents the macroscale characteristic length. D
must be sufficiently smaller than the characteristic dimensions D of the whole deformation zone,
and smaller than the fluctuation length
of the boundary loading. Namely, D D and D
.The mesoscale fields (‘local’ stress, strain-rate and vorticity fields) are regarded as the field
quantities in individual rheological heterogeneities. Rheological heterogeneities may vary in size,
but one can always divide larger rheological heterogeneities into smaller units, so that in a single
problem, all RDPs have similar sizes with a characteristic length, d, in a macroscale RVE, and
d D. We assume d is small enough that the deformation fields inside each RDP are uniform.
The shape of an RDP is approximated by an ellipsoid (Fig.1.3d). An RDP interacts with a
Homogeneous Effective Medium (HEM) that is the homogenized medium on the RVE (Fig.1.3d).
The microscale features with a characteristic length of
can be considered as thestructures and fabric elements within mesoscale RDPs. They can be structures that are directly
observed on outcrops (Fig.1.3e), or they can be the microstructural shape and lattice fabrics under
microscope (Fig.1.3f, g) if the deformation in an RDP is homogeneous down to the microscopic
scale. The condition, d, is assumed so that the microscale elements do not break the
assumption that the mesoscale deformation inside each RDP is uniform.
In summary, the scale gaps among the microscale, the mesoscale and the macroscale can
be expressed as
d
D
D,
D
. This scale separation condition is the basis to regardmesoscale RDPs as Eshelby inhomogeneities in a macroscale deforming RVE and microscale
fabrics as inclusions in partitioned fields in RDPs. The characteristic length scale description is
not rigorous. The same method is used at different length scales if the material at the smallest scale
6
a discrete particle system made of atoms or molecules, and molecular dynamics (MD) and quantum
mechanics are used to study the behavior of the material (e.g., Ollila et al., 2013).
As we assume that the deformation fields within mesoscale RDPs are uniform, microscale
and mesoscale field quantities are the same for each RDP. The macroscale field quantities can be
related to microscale field quantities by definition (Hill, 1963; 1967; Jiang, 2014):
( )
( )
( )
( )
1
= (1.1 )
1
( ) (1.1 )
1
( ) (1.1 )
V V V dV a V dV b V dV c V = = = = =
Σ X σ x σ
Ε X ε x ε
W X w x w
where Σ, Ε and W are respectively macroscale stress, strain-rate, and vorticity; σ, ε and w are
respectively microscale stress, strain-rate and vorticity; X and x represent the macroscale and
microscale locations respectively; V is the volume of the RVE, and the operator indicates the
volume average value over the RVE.
The inverse relations of the Eqs.1.1 are to obtain the partitioned mesoscale flow fields
within RDPs from imposed macroscale fields and can quantitively solve the flow partitioning
problem caused by the rheological heterogeneities of the lithosphere (Lister and Williams, 1983).
The extended Eshelby theory is used to solve the partitioned fields in MOPLA and will be
7
Figure 1.3 A multiscale approach to study natural deformation (modified after Jiang, 2014).
8
1.2.2 The backbone theory of MOPLA
The backbone theory of MOPLA is the extended Eshelby formalism for power-law viscous
materials (Jiang and Bentley, 2012; Jiang, 2013, 2014). The classical Eshelby inclusion problem
deals with an elastic ellipsoidal inclusion embedded in an infinite uniform elastic medium. Eshelby
(1957, 1959) gave the expressions of the mechanical fields inside the inclusion (the interior fields)
and around the inclusion (the exterior fields) in terms of the far-field mechanical fields. Eshelby
(1957) solved the problem by proceeding a thought experiment on the possible mechanical fields
in a linear elastic medium containing an inclusion. He considered the situation where the inclusion
has undergone a transformation and correspondingly needed to change shape and size to
accommodate the transformation, but the change is restricted due to the surrounding material
(Fig.1.4). Eshelby (1957) used a ‘sequence of imaginary cutting, straining and welding operations’
and found that the resulting elastic field can be obtained.
Mura (1987) summarized Eshelby’s work of an inhomogeneity inclusion inside a matrix.
The general solution of an elastic inhomogeneity problem is expressed by the following set of
equations (Jiang 2014, his Eqs.9):
:
e = A E ,
(
)
1 -1
:
:
−
=
s+
−
S
M E
A
J
S C
C
J
(1.2a)ωE =ωM+Π S: −1:
(
e E−)
(1.2b) σ B Σ= : ,B
=
C
E:
A C
:
-1M (1.2c)where e, ωE, and σ are strain, rotation and stress fields inside inhomogeneity, respectively; E, ωM
and
Σ
are corresponding macroscale fields in infinite matrix; CE and CMrepresent the elasticstiffness inside inhomogeneity and matrix, respectively; A and B are respectively strain
9
Figure 1.4 An Eshelby inclusion in an infinite linear elastic medium. The stiffness tensor of
the medium is C0, and the stiffness tensor of the inclusion is Ci. A transformation strain
changes the shape and orientation of the inclusion. The matrix is with the characteristic
length of D that is much larger than the size of the inclusion.
The above solutions have been extended to isotropic Newtonian viscous materials (Bilby
et al., 1975; Bilby and Kolbuszewski, 1977) and to nonlinear viscous power-law materials through
the linearization approach (e.g., Hutchinson, 1976; Molinari et al., 1987; Lebensohn and Tomé,
1993; Masson et al., 2000; Lebensohn et al., 2003, 2004; Jiang 2013, 2014).
1.2.3 Homogenization systems in MOPLA
The above extended Eshelby theory for power-law viscous materials is for an isolated
Eshelby inhomogeneity embedded in an infinite homogeneous matrix. In MOPLA, every
mesoscale RDP is treated as an Eshleby inhomogeneity embedded in an effective Homogeneous
Effective Medium (HEM, Figs. 1.3d, 1.5), and the calculation of the mesoscale field quantities of
RDPs from the macroscale field quantities is the partitioning process. The rheological properties
10
the rheological properties of HEM from the overall properties of the RVE is called homogenization.
The homogenization process is based on the extended Eshleby theory as well (Jiang, 2014).
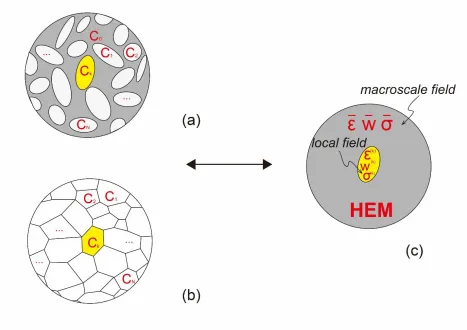
Figure 1.5 A conceptual diagram to show the two types of homogenization schemes in
MOPLA (modified after Qu et al., 2016). (a) The Mori-Tanaka homogenization scheme is
used for a composite material with crowed inclusions embedded in a connected matrix
representing. (b) The self-consistent homogenization scheme is used for a continuum of
poly-elements without a matrix phase. (c) The rheological properties of the homogeneous effective
medium (HEM) are the ‘average’ from all the constituent elements in (a) or (b).
An RVE can be considered as a composite material, and there are two ways to proceed
homogenization in MOPLA. One is the self-consistent system (Fig.1.5b) (Jiang, 2014), and the
another is the Mori-Tanaka system (Fig.1.5a) (Mori and Tanaka, 1973). For composite materials
11
homogenization scheme is used. For a composite material with inclusions embedded in a
connected matrix, especially the concentration of the matrix phase should be around 25%-30%,
the Mori-Tanaka homogenization method (Mori and Tanaka, 1973; Mercier and Molinari, 2009)
is adopted.
In both systems, the partitioning and homogenization processes run in a self-consistent
fashion. The initial rheological properties of RDPs are known, but, as the power-law viscous
materials are considered, the actual viscous compliances (or stiffnesses) in RDPs are unknown
until the mesoscale stress or strain-rate fields in RDPs obtained. Simultaneously, to calculate the
partitioned mesoscale field quantities in RDPs, the rheological properties of HEM that are from
the instantaneous viscous compliance (or stiffness) are required (Fig.1.5). The detailed equations
are in Jiang (2014).
1.3.
Application to the Shangdan tectonic zone in the Qinling orogenic
belt
So far, MOPLA has only been applied to the Cascade Lake shear zone in the eastern Sierra
Nevada region of California (Jiang and Bentley, 2012; Jiang, 2014), and more work is needed to
explore possible fabric patterns for different sets of boundary conditions and model parameters. In
this thesis, MOPLA is applied to the data-rich Shangdan tectonic zone (SDTZ) in the Qinling
orogenic belt (QOB) to investigate the tectonic evolution of the QOB.
1.3.1 The problem in the QOB studies
The QOB separates China into the North China Block (NCB) and the South China Block
12
Kunlun, Qilian, Qinling and Dabie orogens together are called the Central China Orogenic Belt
(Fig.1.6, Dong et al., 2015).
Figure 1.6 A simplified tectonic map of China showing the major tectonic units and central
China orogenic belt (the red-line area) (modified after Dong et al., 2015).
The main morphology of the QOB resulted from the final Triassic collision between the
NCB and SCB, and the Cenozoic extension across China, but the QOB is a long-lived orogen and
has experienced accretional and collisional processes since the Precambrian (Dong and Santosh,
2016 and references therein). The QOB is divided into two major belts, the North Qinling Belt
(NQB) and the South Qinling Belt (SQB), by the Shangdan suture (Fig1.7). The Shangdan suture
13
and carbonates (Zhang et al., 2001; Dong et al., 2011a,b; Dong and Santosh, 2016). The Shangdan
suture and its adjacent areas are referred to as the Shangdan tectonic zone (SDTZ) in this work.
Because the western and eastern parts of the QOB show distinctive features (Zhang et al., 2001),
the QOB is roughly divided into the western Qinling belt and the eastern Qinling belt by ~108°E
(Fig1.7, Zhang et al., 2001).
In eastern Qinling, sub-vertical foliations and sub-horizontal stretching lineations with
sinistral shear-sense indicators have been observed in mylonites along the SDTZ (Mattauer et al.,
1985; Xu et al., 1986; Zhang et al., 1989; Reischmann et al., 1990; Wang et al., 2005), and the
fabrics indicate a sinistral strike-slip deformation. However, the age of this deformation and how
it is related to the tectonic evolution of the QOB are still unclear. The detailed field work is
conducted along the SDTZ in eastern Qinling in order to investigate the above questions.
In western Qinling, the NQB and Shangdan suture are not well established, and the
structural features are unclear due to the cover of the Quaternary. With the guidance of Dr.Wentian
Liang at Northwest University, we were able to find a shear zone, called the Xinyang-Yuanlong
shear zone, in western Qinling. This shear zone was recognized in 2004 during a 1:250,000
regional geological mapping project and mapped as the boundary between the QOB and the Qilian
orogen. It is also suggested as the western extension of the SDTZ by some researchers. The
Xinyang-Yuanlong shear zone is studied in detail to address the following questions: what the
geometric structures and kinematics of the zone and the corresponding deformation time are; how
this shear zone relates to the deformation in eastern Qinling; whether this shear zone is the SDTZ
14
Figure 1.7 A geological map of Qinling orogenic belt and its adjacent areas. KPS: the Neoproterozoic Kuanping suture; SDS:
the Paleozoic Shangdan suture; MLS: the Triassic Mianlue suture; BXDS: the Neoproterozoic Bikou-Xiaomoling-Douling
subduction zone; MHS: the Neoproterozoic Micangshan-Huangling subduction zone; LLWF: the Lingbao-Lushan-Wuyang
fault; MBXF: the Mianlue-Bashan-Xiangguang fault; XYSZ: the Xinyang-Yuanlong shear zone. The grey part in the
15
Overall, in this thesis, the detailed field work and geochronological studies are
conducted along the SDTZ in the western and eastern QOB, and the outcrop-scale
fabrics are used to extrapolate the tectonic-scale boundary conditions by applying
MOPLA to the field work areas.
1.3.2 The framework of the QOB
The first recorded study in the Qinling Mountain was a field investigation from
Baoji to Hanzhong by F. Von Richthofen, a German, in the year of 1866 (Zhang et al.,
2001). Since then, a lot of route surveys and preliminary geological inquiries were
carried out in the Qinling Mountain (Zhao and Huang, 1931 as cited in Zhang et al.,
2001). Since the 1950s, regional geological surveys were started in the Qinling
Mountain. In the early 1980s, the first geological map of the Qinling Mountains on a
scale of 1:200000 was completed, and several geochemical and geophysical studies
were carried out (Zhang et al., 2001).
Over the past three decades, many studies have shown that the QOB was
produced by the collisions among the micro-continents between the NCB and the SCB
and the terminal collision of the NCB and the SCB (e.g., Mattatuer et al., 1985; Zhang
et al., 1989; Enkin et al., 1992; Ames et al., 1996; Hacker et al., 1998; Meng and Zhang,
1999, 2000; Faure et al., 2001; Zhang et al., 2001; Ratschbacher et al., 2003, 2006;
Dong et al., 2011a,b,c, 2012; Bader et al., 2013a,b; Dong and Santosh, 2016). At
present, the Qinling orogen is bounded by the Lingbao-Lushan-Wuyang fault (LLWF)
in the north and the Mianlue-Bashan-Xiangguang fault (MBXF) in the south (Fig1.7).
16
Mountains in the east and Qilian and Kunlun Mountains in the west. The QOB is
generally divided into four tectonic belts that are the Southern North China Block
(S-NCB), the North Qinling Belt (NQB), the South Qinling Belt (SQB) and the Northern
South China Block (N-SCB) by 3 major sutures (i.e., the Neoproterozoic Kuanping
suture, the Paleozoic Shangdan suture and the Triassic Mianlue suture) from north to
south (Meng and Zhang, 2000; Zhang, et al., 2001; Dong et al., 2011a).
1.4.
Objectives and methodology
The main objective of this thesis is to investigate the tectonic evolution of the
SDTZ and to refine existing tectonic models for the QOB. Considering the distinctive
features of western Qinling and eastern Qinling, the field study of the SDTZ in this
thesis is correspondingly divided into the eastern part and the western part
(Figs1.7,1.8).
Figure 1.8 A satellite map to show the field work areas. Red and yellow dots are
the traces along the SDTZ in eastern Qinling, and the blue dots are the footprints
17
The detailed structural mapping is conducted to reveal the spatial changes of
fabrics using a Trimble Yuma differential Global Position System (GPS) with
1-to-2-meter accuracy. To relate the deformation with the tectonic evolution of the QOB, the
deformation time is constrained by regional structural correlation and geochronology
studies. U-Pb Laser Ablation Inductively Coupled Plasma Mass Spectrometry
(LA-ICP-MS) Zircon dating of the deformation-related dykes is used for the
geochronological studies in this thesis. MOPLA is applied to research areas and used
to simulate fabrics produced by partitioned flow fields, in order to infer the
tectonic-scale boundary conditions.
1.5.
Thesis outline
This thesis investigates the deformation of the SDTZ in eastern Qinling and
the Xinyang-Yuanlong shear zone in western Qinling using MOPLA. There are six
chapters. Chapter 1 provides a general introduction to this thesis. Chapter 2 develops
an optimal scheme to efficiently evaluate the Eshleby tensors and implements the
scheme into a MATLAB package to improve the computational efficiency of MOPLA.
Chapter 3 studies the deformation of the SDTZ in eastern Qinling. Chapter 4 studies
the deformation of the Xinyang-Yuanlong shear zone in western Qinling and
integrates the previous results in eastern Qinling (i.e., Chapter 3) and discusses the
tectonic synthesis of the deformation along the SDTZ in the QOB. Chapter 5
18
1.6.
References
Ames, L., Gaozhi, Z. and Baocheng, X., 1996. Geochronology and isotopic character of ultrahigh‐pressure metamorphism with implications for collision of the Sino‐
Korean and Yangtze cratons, central China. Tectonics, 15(2), pp.472-489.
Bader, T., Ratschbacher, L., Franz, L., Yang, Z., Hofmann, M., Linnemann, U. and
Yuan, H., 2013a. The heart of China revisited, I. Proterozoic tectonics of the Qin
mountains in the core of supercontinent Rodinia. Tectonics, 32(3), pp.661-687.
Bader, T., Franz, L., Ratschbacher, L., Capitani, C., Webb, A.A.G., Yang, Z., Pfänder,
J.A., Hofmann, M. and Linnemann, U., 2013b. The Heart of China revisited: II Early Paleozoic (ultra) high‐pressure and (ultra) high‐temperature metamorphic Qinling
orogenic collage. Tectonics, 32(4), pp.922-947.
Bilby, B.A., Eshelby, J.D. and Kundu, A.K., 1975. The change of shape of a viscous
ellipsoidal region embedded in a slowly deforming matrix having a different viscosity.
Tectonophysics, 28(4), pp.265-274.
Bilby, B.A. and Kolbuszewsk, M.L., 1977. The finite deformation of an
inhomogeneity in two-dimensional slow viscous incompressible flow. In Proc. R. Soc.
Lond. A, 355(1682), pp.335-353.
Dong, Y. and Santosh, M., 2016. Tectonic architecture and multiple orogeny of the
Qinling Orogenic Belt, Central China. Gondwana Research, 29(1), pp.1-40.
Dong, Y., Zhang, G., Neubauer, F., Liu, X., Genser, J. and Hauzenberger, C., 2011a.
Tectonic evolution of the Qinling orogen, China: review and synthesis. Journal of
Asian Earth Sciences, 41(3), pp.213-237.
Dong, Y., Zhang, G., Hauzenberger, C., Neubauer, F., Yang, Z. and Liu, X., 2011b.
Palaeozoic tectonics and evolutionary history of the Qinling orogen: evidence from
geochemistry and geochronology of ophiolite and related volcanic rocks. Lithos,
19
Dong, Y., Genser, J., Neubauer, F., Zhang, G., Liu, X., Yang, Z. and Heberer, B.,
2011c. U-Pb and 40Ar/39Ar geochronological constraints on the exhumation history
of the North Qinling terrane, China. Gondwana Research, 19(4), pp.881-893.
Dong, Y., Liu, X., Zhang, G., Chen, Q., Zhang, X., Li, W. and Yang, C., 2012. Triassic
diorites and granitoids in the Foping area: Constraints on the conversion from
subduction to collision in the Qinling orogen, China. Journal of Asian Earth Sciences,
47, pp.123-142.
Dong, Y., Zhang, X., Liu, X., Li, W., Chen, Q., Zhang, G., Zhang, H., Yang, Z., Sun,
S. and Zhang, F., 2015. Propagation tectonics and multiple accretionary processes of
the Qinling Orogen. Journal of Asian Earth Sciences, 104, pp.84-98.
Enkin, R.J., Yang, Z., Chen, Y. and Courtillot, V., 1992. Paleomagnetic constraints on
the geodynamic history of the major blocks of China from the Permian to the present.
Journal of Geophysical Research: Solid Earth, 97(B10), pp.13953-13989.
Eshelby, J.D., 1957. The determination of the elastic field of an ellipsoidal inclusion,
and related problems. In Proc. R. Soc. Lond. A, 241(1226), pp.376-396.
Eshelby, J.D., 1959. The elastic field outside an ellipsoidal inclusion. In Proc. R. Soc.
Lond. A, 252(1271), pp.561-569.
Eshelby, J.D., 1961. Elastic inclusions and inhomogeneities. Progress in Solid
Mechanics, 2(1), pp.89-140.
Faure, M., Lin, W. and Le Breton, N., 2001. Where is the North China–South China
block boundary in eastern China?. Geology, 29(2), pp.119-122.
Hacker, B.R., Ratschbacher, L., Webb, L., Ireland, T., Walker, D. and Shuwen, D.,
1998. U/Pb zircon ages constrain the architecture of the ultrahigh-pressure Qinling–
Dabie Orogen, China. Earth and Planetary Science Letters, 161(1-4), pp.215-230.
Hill, R., 1963. Elastic properties of reinforced solids: some theoretical principles.
20
Hill, R., 1967. The essential structure of constitutive laws for metal composites and
polycrystals. Journal of the Mechanics and Physics of Solids, 15(2), pp.79-95.
Hobbs, B.E. and Ord, A., 2015. Structural geology: the mechanics of deforming
metamorphic rocks. Elsevier.
Hutchinson, J.W., 1976. Bounds and Self-Consistent Estimates for Creep of
Polycrystalline Materials. Proceedings of the Royal Society of London. A.
Mathematical and Physical Sciences, 348(1652): 101-127.
Jiang, D., 1994a. Flow variation in layered rocks subjected to bulk flow of various
kinematic vorticities: theory and geological implications. Journal of Structural
Geology, 16(8), pp.1159-1172.
Jiang, D., 1994b. Vorticity determination, distribution, partitioning and the
heterogeneity and non-steadiness of natural deformations. Journal of Structural
Geology, 16(1), pp.121-130.
Jiang, D., 2013. The motion of deformable ellipsoids in power-law viscous materials:
Formulation and numerical implementation of a micromechanical approach applicable to flow partitioning and heterogeneous deformation in Earth’s lithosphere. Journal of
Structural Geology, 50, pp.22-34.
Jiang, D., 2014. Structural geology meets micromechanics: A self-consistent model
for the multiscale deformation and fabric development in Earth's ductile lithosphere.
Journal of Structural Geology, 68, pp.247-272.
Jiang, D. and Bentley, C., 2012. A micromechanical approach for simulating multiscale fabrics in large‐scale high‐strain zones: Theory and application. Journal of
Geophysical Research: Solid Earth, 117(B12).
Jiang, D. and White, J.C., 1995. Kinematics of rock flow and the interpretation of
geological structures, with particular reference to shear zones. Journal of Structural
21
Jiang, D. and Williams, P.F., 1999. A fundamental problem with the kinematic
interpretation of geological structures. Journal of Structural Geology, 21(8-9),
pp.933-937.
Kohlstedt, D.L., Evans, B. and Mackwell, S.J., 1995. Strength of the lithosphere:
Constraints imposed by laboratory experiments. Journal of Geophysical Research:
Solid Earth, 100(B9), pp.17587-17602.
Lebensohn, R.A. and Tomé, C.N., 1993. A self-consistent anisotropic approach for the
simulation of plastic deformation and texture development of polycrystals: application
to zirconium alloys. Acta Metallurgica et Materialia, 41(9), pp.2611-2624.
Lebensohn, R. A., Dawson, P. R., Kern, H. M., and Wenk, H. R., 2003. Heterogeneous
deformation and texture development in halite polycrystals: comparison of different
modeling approaches and experimental data. Tectonophysics, 370(1), 287-311.
Lebensohn, R. A., Tomé, C. N., and Maudlin, P. J., 2004. A selfconsistent formulation
for the prediction of the anisotropic behavior of viscoplastic polycrystals with voids.
Journal of the Mechanics and Physics of Solids, 52(2), 249-278.
Lister, G.S. and Williams, P.F., 1979. Fabric development in shear zones: theoretical
controls and observed phenomena. Journal of Structural Geology, 1(4), pp.283-297.
Lister, G.S. and Williams, P.F., 1983. The partitioning of deformation in flowing rock
masses. Tectonophysics, 92(1-3), pp.1-33.
Masson, R., Bornert, M., Suquet, P., and Zaoui, A., 2000. An affine formulation for
the prediction of the effective properties of nonlinear composites and polycrystals.
Journal of the Mechanics and Physics of Solids, 48(6), 1203-1227.
Mattauer, M., Matte, P., Malavieille, J., Tapponnier, P., Maluski, H., Qin, X.Z., Lun,
L.Y. and Qin, T.Y., 1985. Tectonics of the Qinling belt: build-up and evolution of
22
Meng, Q.R. and Zhang, G.W., 1999. Timing of collision of the North and South China
blocks: controversy and reconciliation. Geology, 27(2), pp.123-126.
Meng, Q.R. and Zhang, G.W., 2000. Geologic framework and tectonic evolution of
the Qinling orogen, central China. Tectonophysics, 323(3-4), pp.183-196.
Mercier, S., and Molinari, A., 2009. Homogenization of elastic–viscoplastic
heterogeneous materials: Self-consistent and Mori-Tanaka schemes. International
Journal of Plasticity, 25(6), 1024-1048.
Molinari, A., Canova, G.R. and Ahzi, S., 1987. A self consistent approach of the large
deformation polycrystal viscoplasticity. Acta Metallurgica, 35(12), pp.2983-2994.
Mori, T., and Tanaka, K., 1973. Average stress in matrix and average elastic energy
of materials with misfitting inclusions. Acta Metallurgica, 21(5), 571-574.
Mura, T., 1987. Micromechanics of defects in solids. Martinus Nijhoff Publishers,
Dordrecht/Boston/Lancaster, 587 pp.
Ollila, S.T., Smith, C.J., Ala-Nissila, T. and Denniston, C., 2013. The Hydrodynamic
Radius of Particles in the Hybrid Lattice Boltzmann--Molecular Dynamics
Method. Multiscale Modeling & Simulation, 11(1), pp.213-243.
Passchier, C.W. and Trouw, R.A.J., 1996. Microtectonics. Springer.
Qu, J. and Cherkaoui, M., 2006. Fundamentals of micromechanics of solids (pp.
226-240). Hoboken: Wiley.
Ramberg, H., 1975. Particle paths, displacement and progressive strain applicable to
rocks. Tectonophysics, 28(1-2), pp.1-37.
Ramsay, J., 1967. Folding and fracturing of rocks. McGraw-Hill, New York.
Ramsay, J.G. and Graham, R.H., 1970. Strain variation in shear belts. Canadian
23
Ratschbacher, L., Hacker, B.R., Calvert, A., Webb, L.E., Grimmer, J.C., McWilliams,
M.O., Ireland, T., Dong, S. and Hu, J., 2003. Tectonics of the Qinling (Central China):
tectonostratigraphy, geochronology, and deformation history. Tectonophysics,
366(1-2), pp.1-53.
Ratschbacher, L., Franz, L., Enkelmann, E., Jonckheere, R., Porschke, A., Hacker,
B.R., Dong, S. and Zhang, Y., 2006. The Sino-Korean-Yangtze suture, the Huwan
detachment, and the Paleozoic-Tertiary exhumation of (ultra) high-pressure rocks
along the Tongbai-Xinxian-Dabie Mountains. Special Papers-Geological Society of
America, 403, p.45.
Reischmann, T., Altenberger, U., Kröner, A., Zhang, G., Sun, Y. and Yu, Z., 1990.
Mechanism and time of deformation and metamorphism of mylonitic orthogneisses
from the Shagou shear zone, Qinling Belt, China. Tectonophysics, 185(1-2),
pp.91-109.
Tullis, J., 2002. Deformation of granitic rocks: experimental studies and natural
examples. Reviews in Mineralogy and Geochemistry, 51(1), pp.51-95.
Wang, T., Pei, X.Z., Wang, X.X., Hu, N.G., Li, W.P. and Zhang, G.W., 2005.
Orogen-parallel westward oblique uplift of the Qinling basement complex in the core of the
Qinling orogen (China): an example of oblique extrusion of deep-seated metamorphic
rocks in a collisional orogen. The Journal of Geology, 113(2), pp.181-200.
Xu, Z.Q., Lun, L.Y., Tang, Y.Q., Mattauer, M., Matte, P., Malavieille, J., Tapponnier,
P. and Maluski, H., 1986. Deformation and tectonic evolution of the eastern Qinling
orogenic belt. Acta Geologica Sinica, 60(3), pp.237-247 (in Chinese).
Zhang, G.W., Yu, Z.P., Sun, Y., Cheng, S.Y., L., T.H., Xue, F. and Zhang, C.L., 1989.
The major suture zone of the Qinling orogenic belt. Journal of Southeast Asian Earth
24
Zhang, G.W., Zhang, B.R., Yuan, X.C., Xiao, Q.H., 2001. Qinling Orogenic Belt and
Continental Dynamics. Science Press, Beijing, pp. 1–855 (in Chinese with English
25
Chapter 2: An Optimal Scheme for Numerical Evaluation of
Eshelby Tensors and Its Implementation in a MATLAB
Package for Simulating the Motion of Viscous Ellipsoids in
Slow Flows
2.1
Introduction
The motion of a heterogeneous inclusion dispersed in a continuous matrix has
been the subject of research for over a century (e.g., Einstein, 1896, 1911, as cited by
Jeffery 1922; Jeffery, 1922; Eshelby, 1957; Goldsmith and Mason, 1967; Mura, 1987;
Jiang 2013, 2014). The theories and their various modified versions have been widely
applied to natural rock deformation and fabric development in the geological literature
(e.g., Flinn, 1956; Ramsay, 1967; Gay, 1968; Dunnet, 1969; Bilby et al., 1975;
Ferguson, 1979; Fry, 1979; Lisle, 1985; Freeman, 1985; Ježek et al., 1996; Jiang,
2007a,b; Meng et al., 2012; Xiang and Jiang; 2013; Chen et al., 2014). A brief history
of this theoretical development is summarized below. Jeffery (1922) first derived
equations for the angular velocity of a rigid ellipsoid embedded in an infinite isotropic
Newtonian material undergoing far-field homogeneous flow. As many natural rocks
resemble the system of a matrix containing rigid or nearly rigid inclusions, Jeffery's
theory has been found many applications in geology (e.g., Passchier and Simpson,
1986; Simpson and De Paor, 1993; Vigneresse and Tikoff, 1999; Mancktelow et al.,
2002; Johnson et al., 2009; Griera et al., 2013). For the more general case involving
deformable inclusions, Bilby et al. (1975) and Bilby and Kolbuszewski (1977)
26
in an infinite isotropic elastic solid undergoing far-field homogeneous deformation to
isotropic Newtonian viscous materials. However, the general equations of Jeffery
(1922), Bilby et al. (1975), and Bilby and Kolbuszewski (1977) do not have analytical
solutions. For the Jeffery equations, analytical solutions have been found so far only
for spheroids in monoclinic flows (e.g., Jeffery, 1922; Ježek et al., 1996; Jiang, 2007a).
For viscous deformable inclusions, closed-form solutions have only been found for
some simple and two-dimensional flows (e.g., Eshelby 1957; Bilby and Kolbuszewski,
1977). In general, Jeffery’s and Eshelby’s equations must be solved numerically.
Freeman (1985) first numerically investigated the possible rotational behaviors of a
rigid ellipsoid using Jeffery’s theory for a variety of flow fields. He (Freeman, 1987)
was also the first to use the equations of Bilby and Kolbuszewski (1977) to numerically
analyze the motion of deformable ellipsoids in pure and simple shearing. Ježek (1994)
developed FORTRAN programs to calculate the rotational path of individual rigid
ellipsoids in any given flow field as well as the rotation and preferred orientation
development for a system of multiple, but non-interacting, rigid ellipsoids. Jiang
(2007a,b) developed algorithms and MathCad worksheets to numerically calculate the
rotational path of individual rigid and deformable ellipsoids and the fabric evolution
in a system of multiple non-interacting rigid or deformable ellipsoids. In his algorithms,
a set of spherical angles (similar to plunge direction and plunge angle of a line in
geology) was used to define the orientation of the ellipsoid instead of the Euler angles
used in previous studies. Jiang (2012) further simplified the algorithms by using a
single differential equation for rotation: dQ dt = −ΘQ (where Θ is the angular
27
using a set of three coupled differential equations for Euler angles in previous works
(e.g., Ježek 1994). The use of a single differential equation greatly improves the
computational efficiency. For dilute inclusions dispersed in a uniform matrix
(Figs.2.1a, b) where the non-interaction assumption is valid, the numerical approach
28
Figure 2.1 A conceptual diagram to illustrate three different scenarios of a
clast-matrix system. (a) An infinite medium subjected to a remote motion with strain
rate E, vorticity W, and stress ∑. The macroscale deformation is defined, at every
point, in terms of a Representative Volume Element (RVE) with strain rate ε ,
vorticity w , and stress σ . (b), (c) and (d) are the magnified illustrations of an
RVE to show three different scenarios. (b) In the scenario, the inclusions are
dispersed far apart from each other in a matrix; this is the dilute inclusion
scenario in which the macroscale fields are similar to the infinite fields. (c) A
composite material with more crowded inclusions embedded in a connected
matrix: the matrix phase (C0) is adopted as a reference medium to solve for the
partitioned fields (ε( )k ,w( )k ,σ( )k ) in each clast (Ck) (i.e., Mori-Tanaka scheme).
The rheological properties of C0 are the same as the Homogeneous Effective
Medium (HEM) in (e). (d) An inclusion is in a polyelement continuum system
without a matrix phase: HEM in (e) is adopted as a reference medium which has
the macroscopic response of the material (ε , w , σ ) and its rheological properties
are the homogenized result of all the constituent elements in an RVE.
Eshelby’s inclusion theory has also been extended to nonlinear viscous
power-law materials through the so-called ‘linearization approach’ (e.g., Hutchinson, 1976;
Molinari et al., 1987; Lebensohn and Tomé, 1993; Masson et al., 2000; Lebensohn et
al., 2003, 2004; Jiang 2013, 2014). This extension forms the basis of the viscoplastic
self-consistent (VPSC) theory (Molinari et al., 1987; Lebensohn and Tomé, 1993;
Tomé and Lebensohn, 2008; Lebensohn et al., 2011) for simulating lattice preferred
orientation fabrics in polycrystalline materials. Recently, the extended Eshelby theory
has also been used in a self-consistent MultiOrder Power-Law Approach (MOPLA,
Jiang and Bentley 2012; Jiang 2014) to address the multiscale heterogeneous
29
field variable at every point is represented by the average of the variable over a
Representative Volume Element (RVE) (Fig.2.1a), which contains many rheologically
distinct power-law viscous elements (Fig.2.1d). The mechanical fields in a constituent
element (treated as an Eshelby inhomogeneity) are related to the macroscale fields by
the extended Eshelby theory and the mechanical fields in constituent elements are used
to model the development of small-scale fabrics within the elements (Jiang, 2014). To
apply the extended Eshelby theory, the macroscale polyelement continuum is
represented rheologically by a Homogeneous Effective Medium (HEM, Fig.2.1e),
which is used as a reference medium for homogenization – the procedure to obtain the
effective rheological properties of HEM. Self-consistent homogenizations (e.g.,
Molinari 2002) make use of the consistency conditions (macroscale compatibility and
equilibrium) which require that the average of the local fields (within elements) over
the representative volume of the polyelement be equal to those imposed at the
macroscale (ε,w,σ in Fig.2.1e). The one-site self-consistent approach (or the
mean-field theory, Lebensohn and Tomé, 1993; Lebensohn et al., 1998) assumes that HEM
is rheologically uniform. Local fields are partitioned fields of the macroscale field.
The partitioned fields then dictate the fabric development in individual elements, and
this constitutes the multiscale simulation of Jiang (2014). In the case where there is a
clearly identified matrix phase (Fig.2.1c), the matrix can be considered a reference
medium instead of HEM and the Mori-Tanaka (Mori and Tanaka, 1973) approach can
be used for the homogenization (e.g., Mercier and Molinari, 2009).
One can appreciate that a self-consistent approach, such as MOPLA, is
30
from the macroscale field) and the homogenization calculation (to obtain HEM
rheological properties from instantaneous local fields and constituent rheological
properties) (Fig.2.1) must be performed self-consistently and this requires large
numbers of iterative calculations, each involving a large number (for all constitutive
elements) of evaluations of the Eshelby tensors. As deformation proceeds, the
constituent elements become more elongated and/or flattened, and the HEM also
becomes rheologically more anisotropic, both rendering the accurate evaluation of the
Eshelby tensors for these elements ever more time-consuming. Therefore, an efficient
scheme to evaluate Eshelby tensors is critical for self-consistent modeling. The main
purpose of this paper is to develop an efficient scheme for evaluating Eshelby tensors.
We also apply the efficient scheme to develop a MATLAB package for simulating the
motion of single and multiple ellipsoids, upgrading the MathCad package of Jiang
(2007a,b, 2012).
2.2
Numerical evaluation of Eshelby tensors
In this section, we first summarize the Eshelby inclusion solutions in order to
introduce the Eshelby tensors. We then discuss numerical methods to evaluate the
Eshelby tensors.
2.2.1 The Eshelby inclusion solutions and Eshelby tensors
The general Eshelby formalism for a viscous ellipsoidal inclusion (Molinari et
al., 1987; Lebensohn et al., 1998) relates the local uniform fields inside a linear viscous
ellipsoid (strain rate ε, vorticity w, and deviatoric stress σ, all second-order tensors)