Scholarship@Western
Scholarship@Western
Electronic Thesis and Dissertation Repository
8-27-2018 2:30 PM
Automatic Recall of Lessons Learned for Software Project
Automatic Recall of Lessons Learned for Software Project
Managers
Managers
Tamer Mohamed Abdellatif Mohamed
The University of Western Ontario
Supervisor Capretz, Luiz F.
The University of Western Ontario Co-Supervisor Ho, Danny
The University of Western Ontario
Graduate Program in Electrical and Computer Engineering
A thesis submitted in partial fulfillment of the requirements for the degree in Doctor of Philosophy
© Tamer Mohamed Abdellatif Mohamed 2018
Follow this and additional works at: https://ir.lib.uwo.ca/etd
Part of the Electrical and Computer Engineering Commons
Recommended Citation Recommended Citation
Mohamed, Tamer Mohamed Abdellatif, "Automatic Recall of Lessons Learned for Software Project Managers" (2018). Electronic Thesis and Dissertation Repository. 5615.
https://ir.lib.uwo.ca/etd/5615
This Dissertation/Thesis is brought to you for free and open access by Scholarship@Western. It has been accepted for inclusion in Electronic Thesis and Dissertation Repository by an authorized administrator of
i
Lessons learned (LL) records constitute a software organization’s memory of successes and failures. LL are recorded within the organization repository for future reference to optimize planning, gain experience, and elevate market competitiveness. However, manually searching this repository is a daunting task, so it is often overlooked. This can lead to the repetition of previous mistakes and missing potential opportunities, which, in turn, can negatively affect the organization’s profitability and competitiveness. In this thesis, we present a novel solution that provides an automatic process to recall relevant LL and to push them to project managers. This substantially reduces the amount of time and effort required to manually search the unstructured LL repositories, and therefore, it encourages the utilization of LL. In this study, we exploit existing project artifacts to build the LL search queries on-the-fly, in order to bypass the tedious manual search process. While most of the current LL recall studies rely on case-based reasoning, they have some limitations including the need to reformat the LL repository, which is impractical, and the need for tight user involvement. This makes us the first to employ information retrieval (IR) to address the LL recall. An empirical study has been conducted to build the automatic LL recall solution and evaluate its effectiveness. In our study, we employ three of the most popular IR models to construct a solution that considers multiple classifier configurations. In addition, we have extended this study by examining the impact of the hybridization of LL classifiers on the classifiers’ performance. Furthermore, a real-world dataset of 212 LL records from 30 different software projects has been used for validation. Top-k and MAP, well-known accuracy metrics, have been used as well. The study results confirm the effectiveness of the automatic LL recall solution by a discerning accuracy of about 70%, which was increased to 74% in the case of hybridization. This eliminates the effort needed to manually search the LL repository, which positively encourages project managers to reuse the available LL knowledge – which in turn avoids old pitfalls and unleash hidden business opportunities.
Keywords
ii
Acknowledgments
I am cordially thankful to my supervisors, Luiz Fernando Capretz and Danny Ho, for their advices, encouragement and time. I appreciate their constructive feedback and support through my PhD studies. They motivated me to refine my research and publish my work in top ranked conferences and reputable journals.
I dedicate this thesis to my wife Dina Kandil for her inspiration, patience and unlimited support.
In addition, I want to thank my family and my children Dorra and Youssef for their emotional support that helped me to keep up my passion throughout my research.
iii
Table of Contents
Abstract ... i
Acknowledgments... ii
Table of Contents ... iii
List of Tables ... vii
List of Figures ... ix
List of Appendices ... xi
List of Terms and Acronyms ... xii
Chapter 1 ... 1
1 Introduction ... 1
1.1 Motivation ... 3
1.2 Problem Statement and Research Questions... 4
1.3 Research Contributions ... 6
1.4 Thesis Structure ... 8
Chapter 2 ... 9
2 Software Analytics Systematic Literature Review ... 9
2.1 Software Analytics ... 9
2.2 Systematic Literature Review ... 10
2.2.1 Systematic Literature Review Protocol ... 10
2.2.2 Systematic Literature Review Results ... 19
2.2.3 Systematic Literature Review Limitations... 31
2.3 Systematic Literature Review Addendum ... 31
2.4 Summary ... 32
Chapter 3 ... 34
iv
3.1 Lessons Learned in Software Engineering ... 34
3.2 Lessons Learned Recall State-of-the-Art ... 36
3.3 Information Retrieval Models Applied to Recall Lessons Learned... 38
3.3.1 Text Preprocessing Steps ... 39
3.3.2 Vector Space Model ... 39
3.3.3 Latent Semantic Indexing ... 41
3.3.4 Latent Dirichlet Allocation ... 41
3.4 Summary ... 42
Chapter 4 ... 43
4 The Design of the Lessons Learned Recall Solution ... 43
4.1 Problem Statement ... 43
4.2 Research Questions and Goals ... 44
4.3 Proposed Solution and Case Study Methodology ... 46
4.3.1 Lessons Learned Classifiers Construction ... 46
4.3.2 Dynamic Query Construction ... 50
4.4 Evaluation Process ... 50
4.4.1 Performance Metrics ... 51
4.4.2 IR Configuration Impact ... 53
4.5 Summary ... 54
Chapter 5 ... 56
5 Can Lessons Learned Be Recalled Automatically: An Empirical Study ... 56
5.1 Data Collection ... 56
5.1.1 Dataset Description ... 57
5.1.2 Gold Set Construction ... 58
5.2 LL Classifiers Construction ... 59
v
5.2.2 LDA Classifiers Construction Tool ... 60
5.2.3 VSM Classifiers Construction Tool ... 62
5.2.4 LSI Classifiers Construction Tool ... 63
5.3 Results ... 64
5.3.1 Top-K Results ... 64
5.3.2 MAP Results ... 70
5.4 Results Discussion ... 77
5.5 Threats to Validity ... 82
5.6 Case Study Challenges ... 84
5.7 Scalability of the Automatic LL Recall Solution ... 85
5.8 Summary ... 86
Chapter 6 ... 88
6 Can Hybridization Improve the Accuracy of Lessons Learned Recall: An Empirical Study Extension ... 88
6.1 Classifiers Hybridization ... 89
6.2 Hybridization Techniques ... 91
6.2.1 Borda ... 91
6.2.2 Score Addition ... 91
6.3 Hybrid Classifiers Selection ... 92
6.4 Results ... 93
6.4.1 Top-K Results ... 95
6.4.2 MAP Results ... 97
6.5 Summary ... 98
Chapter 7 ... 99
7 Summary and Future Work ... 99
vi
References ... 105
Appendices ... 111
vii
List of Tables
Table 1-1 Research Questions to Research Contributions Mapping ... 7
Table 2-1 Primary Studies Selected ... 20
Table 2-2 Primary Studies Quality Scores ... 21
Table 2-3 Quality Assessment Levels Statistics ... 23
Table 2-4 Q1 Extracted Data ... 23
Table 2-5 Q2 Extracted Data ... 26
Table 2-6 Q3 Extracted Data ... 30
Table 3-1 Lesson Learned Example 1 ... 35
Table 3-2 Lesson Learned Example 2 ... 36
Table 4-1 Parameter Configurations ... 49
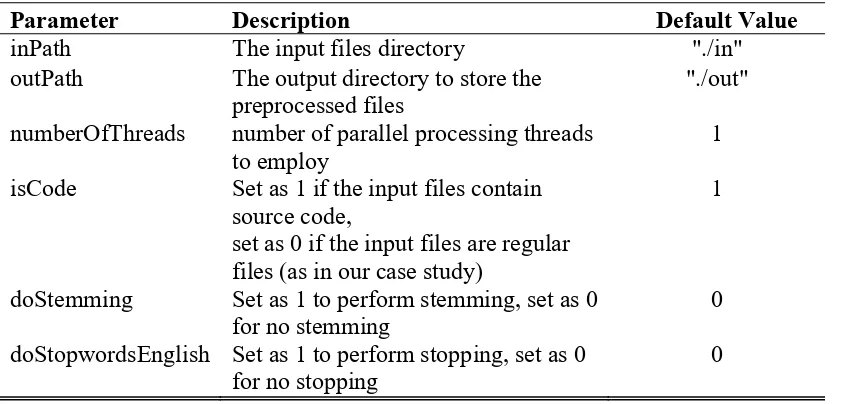
Table 5-1 lscp Tool Parameters ... 59
Table 5-2 MALLET Tool Parameters... 61
Table 5-3 lucene-lda Tool Parameters (LDA mode) ... 62
Table 5-4 lucene-lda Tool Parameters (VSM mode) ... 63
Table 5-5 simserver Tool Parameters ... 64
Table 5-6 Lessons Learned Classifiers Top-K Performance Results (Best Four and Worst Four Classifiers) ... 65
Table 5-7 Top-K Descriptive Statistics... 66
viii
Table 5-9 Lessons Learned Classifiers MAP Performance Results (Best Four and Worst Four
Classifiers) ... 72
Table 5-10 MAP Descriptive Statistics... 73
Table 5-11 Tukey’s HSD Statistical Test Results (MAP) (95% Confidence Level) ... 73
Table 6-1 Hybrid Classifiers ... 94
Table 6-2 Top-20 Hybrid Classifiers Results ... 96
ix
List of Figures
Figure 2-1 Quality Assessment Scoring Process ... 16
Figure 2-2 The Data Extraction Card... 17
Figure 2-3 A Summary of the SLR Process... 18
Figure 2-4 Filtration Process ... 19
Figure 2-5 Distribution of Selected Studies per Year ... 22
Figure 2-6 Distribution of Selected Studies per Practitioner ... 24
Figure 2-7 Distribution of Selected Studies per Domain ... 25
Figure 2-8 Number of Analyzed Artifacts Versus Number of Studies ... 30
Figure 4-1 Construction of the Lessons Learned Classifiers ... 49
Figure 4-2 Lessons Learned Classifier Evaluation Process and Performance Results Calculation ... 51
Figure 5-1 Gold Set Construction Process ... 58
Figure 5-2 lscp Preprocessing Example ... 60
Figure 5-3 Top-20 Statistical Test Results for VSM (Similarity Methods)... 68
Figure 5-4 Top-20 Statistical Test Results for VSM (Term Weighting Methods) ... 69
Figure 5-5 Top-20 Statistical Test Results for LSI (Term Weighting Methods) ... 70
Figure 5-6 Top-20 Statistical Test Results for LSI (Number of Topics) ... 71
Figure 5-7 Top-20 Statistical Test Results for LDA (Number of Topics) ... 74
x
Figure 5-9 Top-20 Statistical Test Results for LSI (Preprocessing Method) ... 75
Figure 5-10 Top-20 Statistical Test Results for LDA (Preprocessing Method) ... 76
Figure 5-11 MAP Statistical Test Results for VSM (Similarity Method) ... 77
Figure 5-12 MAP Statistical Test Results for VSM (Term Weighting Method) ... 78
Figure 5-13 MAP Statistical Test Results for LSI (Term Weighting Method) ... 79
Figure 5-14 MAP Statistical Test Results for LSI (Number of Topics) ... 80
Figure 5-15 MAP Statistical Test Results for LDA (Number of Topics) ... 81
Figure 5-16 MAP Statistical Test Results for VSM (Preprocessing Method) ... 82
Figure 5-17 MAP Statistical Test Results for LSI (Preprocessing Method) ... 83
Figure 5-18 MAP Statistical Test Results for LDA (Preprocessing Method) ... 84
xi
List of Appendices
Appendix A: Examples of Lessons Learned, Issues and Risks ... 111
Appendix B: Top-20 88 Classifiers Results... 113
Appendix C: MAP 88 Classifiers Results ... 116
xii
List of Terms and Acronyms
SA Software Analytics: represents a branch of big data analytics. The term was initially coined by Zhang et al. in 2011 and it is concerned with the analysis of all software artifacts
SLR Systematic Literature Review: type of literature review where a systematic method is followed to search, collect, extract and synthesize data to answer a set of defined review questions.
LL Lessons Learned: the organization’s memory of what went wrong (mistakes) or what went right (opportunities) in certain situations or events.
IR Information Retrieval: refers to the process of finding a relevant document or information of interest within a collection of documents or artifacts.
VSM Vector Space Model: is an algebraic information retrieval model. It represents the documents’ corpus in a matrix format of terms versus documents
SVD Singular Value Decomposition: a matrix decomposition method from linear algebra where a matrix is decomposed into three new matrices.
LSI Latent Semantic Indexing: is an extension of the VSM model. It takes the context or topic into consideration instead of only matching the terms which can have different meanings.
LDA Latent Dirichlet Allocation: is a generative probabilistic IR model. It considers the context of terms by eliciting the topics within the documents’ corpus.
xiii
statistically significant difference between the groups’ mean.
Top-K An accuracy metric calculates the percentage of queries, which are executed by the IR model, in whose top k result records there is at least one relevant record.
MAP Mean Average Precision: a popular accuracy metric from the IR literature. It is calculated as the average of the aggregated average precision of each individual query.
Borda Count A rank-based hybridization technique. The total hybrid score of each retrieved item is calculated as the summation of the item ranks from each individual classifier retrieval list.
Score Addition
A hybridization technique relies on the item’s weight. The total hybrid score of each retrieved item is calculated as the summation of the individual score of this item from each of the combined classifiers.
Chapter 1
1 Introduction
Everyday situations teach us lessons and provide us with analogs. We rely on these lessons learned (LL) and analogs in dealing with similar problems and identifying opportunities. Accordingly, the decision making literature [1] tells us about the power of analogs. Analogs are experiences or knowledge from domains similar to that of the subject at hand and can work for different domains such as management, decision making, and entrepreneurship. They can support decision making by providing recommendations, improving contextual awareness, facilitating difficult tasks, clarifying problem definition, and fostering development of reasonable plans. Thus, managers can rely on analogs to facilitate their decision making. Also, entrepreneurs can rely on analogs to build their business models and to test their hypothesis [2].
The software engineering domain is no exception, regarding analogs, as learning from similar projects or previous experiences improves the success and quality of software projects. This was highlighted by Pfleeger [3] when she used an analogy from soccer. In a soccer game, the team does not just play the game and then forget about it. Instead, a good team comes together after the game to discuss and analyze their performance, what happened and what can be improved. They define the LL from their performance and analyze the game scenarios and circumstances. They make use of these LL to overcome mistakes, improve their performance and leverage good plays. It can be the same for software engineering. Project managers (PMs) can make use of their experiences and conduct post-action meetings in order to discuss, analyze and report LL.
After the attack on Pearl Harbor in 1941, the Japanese commander, Mitsue Fuchido, was surprised by its success. He asked, “Had these Americans never heard of Port Arthus?” that event, which was famous in Japan, had preceded the Russo-Japanese war of 1904. The Japanese tactic was to destroy the Russian Pacific fleet at anchor at Port Arthur in a surprise attack.
Wohlstetter 1962 [1]
mistake or a problem. Both positive and negative experiences are valuable since they can either highlight an opportunity for leveraging profit or eliminate an anticipated loss, respectively. That said, reporting and safely storing such historical knowledge, or LL, is encouraged by different standards from reputable management institutions such as the Project Management Body of Knowledge (PMBOK) by the Project Management Institute (PMI) [4] and the Capability Maturity Model Integration (CMMI) [5]. Both standards emphasize the importance of conducting closing reviews and retrospective meetings to record and analyze LL from previous projects for future reference. Because of the high value placed on LL, the National Aeronautics and Space Administration (NASA) has assigned an effort and budget to improve its LL reporting process and launch its LL portal [6].
Overlooking or missing relevant LL records can lead not only to missing available opportunities and business success, but can also cause a catastrophic loss of profit due to the repetition of known previous mistakes which could be easily avoided by just knowing about them. In this thesis, we have worked on the enhancement of the retrieval of relevant LL records to make them available to PMs. Our goal has been to facilitate access to these LL records in the organization’s repository, and therefore minimize or eliminate the problem of overlooking LL. Accordingly, our solution, automatically recalls relevant LL records and provides them to PMs to avoid the intensive effort needed to manually search for them. In order to build this solution, we have employed information retrieval (IR) techniques, for the first time within the LL recall context. In addition, we have manipulated two of the existing project management artifacts in order to construct search queries automatically instead of searching manually by PMs.
1.1
Motivation
system. Beyond this, the LL literature survey has clarified that there is a problem in the dissemination or recall of LL, and that this can be attributed to the intensive task of manually searching the LL repository for relevant LL. Finally, we have noticed that most of the available LL recall studies employed case-based reasoning techniques, which have some practical limitations (See Section 3.2). These observations led us to defining the research gap which we have worked to close in the solution provided in this thesis work. As will be described in detail, we have provided a solution to improve LL recall using IR techniques. The solution serves software PMs, and it can also be generalized to serve PMs in other domains, by providing them with LL records relevant to the projects at hand.
As described, the recall of LL is not currently being optimized due to the challenge of manually searching for relevant LL. This can lead to overlooking this valuable knowledge and losing precious opportunities. As a result, in this thesis, we aim to address this issue in order to facilitate LL recall, which in turn improves the benefit to stakeholders from existing LL knowledge. With our motivation clarified, in the next section, we will describe the problem we have addressed.
1.2
Problem Statement and Research Questions
Every aspect of a software PM's job is about predicting the future and anticipating problems and outcomes. Information technology organizations and project management offices (PMO) usually have LL repository systems. This LL repository can be viewed as the organization’s memory, as it contains a wealth of historical experiences. These LL records can provide valuable analogs for PMs which can facilitate the decision-making process and make decisions more accurate, rational and reasonable.
In this work, we provided a solution to address this problem by improving the recall of LL records. As aforementioned, we employed IR techniques to implement this solution. That said, we defined two main research questions in order to implement and validate the proposed solution as follows (See Section 4.2):
RQ1: Can we automatically, rather than manually, recall and push relevant LL to PMs using IR-based LL classifiers?
RQ2: Can project artifacts be used to construct on-the-fly queries to recall LL records relevant to the software project at hand?
As shown in these two research questions, we sought a solution to the issue of the intensive effort required to manually search the LL repository for relevant records. Our other aim in this solution was to avoid the existing limitations of previous studies, which employed case-based reasoning (See Section 4.3), by employing IR techniques for the first time in the LL recall context as per our knowledge, to construct an LL classifier to retrieve the LL relevant records to the project at hand. In the second research question, we intended to examine whether we could exploit any of the existing project management artifacts to automatically construct queries to search for relevant LL records. By constructing the queries automatically, we avoided the need for the manual involvement of PMs to define the queries, which could lead to overlooking LL records due to time limitations and the effort required. In order to answer the research questions and validate the solution, we conducted an empirical study. In this study, we employed a real dataset from an industrial partner. The dataset considered contained records for both LL and project management artifacts (See Section 5.1). The study results confirmed the validity of the solution in recalling relevant LL efficiently (See Sections 5.3 and 5.4).
RQ3: Do the configurations of LL classifiers have an impact on the performance results?
In order to answer this research question, we conducted a statistical test on the results considering different classifier parameter configurations (See Section 4.4.2).
After recording the LL recall results, we performed one more step by examining the impact of the hybridization of multiple classifiers on the accuracy of the LL retrieved. Therefore, we considered two of the hybridization techniques from the literature (See Section 6.2) and sought an answer to the last research question:
RQ4: Can hybridization improve the LL recall accuracy?
We answered this question by first constructing multiple hybrid classifiers using combinations of the individual classifiers from our empirical study. Second, we compared the hybrid classifiers performance to that of the individual classifiers and calculated the relevant improvement. The results showed improvement in many cases, which encourages the consideration of hybridization for future studies in the LL recall context (See Section 6.4).
1.3
Research Contributions
The contribution of our research includes the comprehensive SLR which we conducted in order to come up with the SA state-of-the-art. The SLR results contribute to the software engineering community by providing valuable insights and defining research gaps. In addition, our research contributes by providing an LL automatic recall solution. Therefore, the main contributions of this thesis can be summarized as follows:
2. It is first to tackle the LL recall problem within the software engineering domain and to provide an LL recall solution.
3. It is the first time, as per our knowledge, that IR models have been used to build an LL recall classifier (See Section 4.3). It bypasses the limitations of existing studies, which require the close involvement of users and reformation of the LL repository. This is impractical (See Section 3.2).
4. It exploits two of the existing software project management artifacts to create the search query on-the-fly. This relieves PMs from the burden of manually searching and facilitates the recall of relevant LL records (See Section 4.3.2). It also examines the impact of the classifier configurations on the LL retrieval accuracy. 5. It extends the main case study by examining the impact of hybridization on the
accuracy of LL recall. The results showed a relative improvement in the hybrid classifier versus the individual classifiers in many cases. This can encourage the consideration of hybridization in future LL recall studies.
Table 1-1 summaries the mapping of the research questions to their corresponding research contributions and the chapters where the RQs are addressed.
Table 1-1 Research Questions to Research Contributions Mapping
Research Question Corresponding Contribution Chapter
SLR questions and results Contributions 1 Chapter 2
RQ1 Contributions 2 and 3 Chapters 3, 4 and 5
RQ2 Contribution 4 Chapters 4 and 5
RQ3 Contribution 4 Chapters 4 and 5
1.4
Thesis Structure
Chapter 2
2 Software Analytics Systematic Literature Review
In this chapter, we will describe the software analytics (SA) concept and we will present the state-of-the-art of the current SA research. Moreover, we will explain the protocol defined to conduct the extensive SA systematic literature review (SLR), and demonstrate
the main findings and insights.1
2.1
Software Analytics
SA represents a branch of big data analytics. The SA term was initially coined by Zhang et al. in 2011 [7]. SA is concerned with the analysis of all software artifacts, not only source code. Its importance comes from the need to extract insights and facts from available software artifacts to support and facilitate decision making. Artifacts are available from all software development life cycle steps, beginning with the proposal and project initiation phases and ending with the project closure and customer satisfaction surveys. The dynamic nature of the software industry is associated with decision-making needs through all software business tiers. These tiers vary from the senior management board, setting the enterprise vision and portfolio management, going through project management planning and implementation by software developers. As emphasized by some experts [8][9][10][11] in the SA domain, all of the stakeholders involved deserve to be supported with decision-making tools in order to facilitate the decision-making process. SA can play the role of tool provider by offering suitable and supportive insights and facts to software industry stakeholders to make their decision making easier, faster, more precise, and more certain. The main difference between SA and direct software analysis is that rather than just providing straightforward insights extraction, SA performs
1 Part of this chapter was published in the IEEE International Conference on Software Engineering Workshop on BIG Data Software Engineering.
additional advanced steps. As clarified by Hassan [8], SA provides both visualization and useful interpretation of insights in order to facilitate decision making.
2.2
Systematic Literature Review
In this section, we describe in detail the protocol employed to conduct the SLR regarding the SA research field. We discuss the results of this SLR, which represent the state-of-the-art of SA within the software engineering literature.
Since SA is currently a promising topic of broad interest, we have conducted an SLR to identify gaps in knowledge and open research areas in SA. Because many researchers are still confused about the true potential of SA, we had to filter out the available research papers to obtain the most SA-relevant work for our review.
In the SLR, we followed Kitchenham’s [12] approach for a software engineering literature review. As a result, we started with the planning phase, in which we developed the review protocol.
In the following subsections, we start by describing the defined protocol of the SLR. Then, we demonstrate the results and findings of our study.
2.2.1
Systematic Literature Review Protocol
We conducted the review in six stages: defining questions, designing the search strategy, selecting the studies to use, assessing the quality, extracting data, and synthesizing data. The following subsections describe in detail each of the six stages considered.
2.2.1.1
Defining Questions for Systematic Review
Q1: Which software practitioners does the available SA research target?
Q1 aims to identify the stakeholders who will benefit from the available SA studies. It also aims to assess whether SA studies target different levels of stakeholders or only focus on the software development team in order to draw the attention of the SA research community to improve the research plan.
Q2: Which domains are covered by SA studies?
Q2 tries to highlight the scope of the available SA studies. The target domains, such as software maintainability and incident management, will be determined. Practitioners can interpret this information from two points of view. The first point of view is to know SA hot topics and consider them for their research plan, while the other view is to analyze any research gap and take the lead to consider it as an original research point.
Q3: Which software artifacts are extracted?
The main difference between SA and direct software analysis is making use of all of the available artifacts in order to come up with insights for strong decision making. Therefore, Q3 aims to verify that this idea is clear for the current research community.
Q4: If different artifacts are used, are they linked together?
Q4 tries to evaluate whether each study satisfies SA’s main focus of linking different software artifacts. This linkage aims to come up with more advanced insights, unlike direct software analysis and metrics where researchers use each artifact separately without linkage to other artifacts.
2.2.1.2
Search Strategy
“Software analytics” OR “Software analytic” OR “Software development analytics” OR “Software development analytic”
2.2.1.2.1
Search Terms Definition
To guarantee that the review would be closely relevant to SA, we tried to limit the search to the most SA relevant search term. So, we started with the term “software analytics”, then we went through the following four steps in order to come up with the final search term that would be considered:
1. Extracting the major distinct terms from the questions.
We ran a small prototype using the original “software analytics” search term. In this prototype, we analyzed about 20 of the search result papers. From this analysis, we noticed the usage of different spellings of the original “software analytics” term.
2. Using different spellings of the terms.
As described in step 1, different spellings of the main keywords from the original search term were noticed. These spellings included the use of both singular and plural forms of the keyword “analytic”. Also, the term “development” was sometimes associated with the original search term.
3. Updating the search term with keywords from relevant papers.
We considered the different keywords we had noticed in updating and considering different parts within the final search term.
4. Using the main alternatives and adding the “OR” operator in order to get the maximum amount of directly relevant literature.
It is worth to mention that we did not consider the popular term of “software analysis” as we noticed that it led to a lot of studies, i.e., papers, which deal with traditional source code analysis studies. Since in our SLR we focused on the most current and the state-of-the-art studies targeting more than one software artifact and stakeholders other than developers, we preferred to exclude this term, i.e., “software analysis,” from the search term. Instead, we analyzed most of the studies which use this term and are referenced by other studies within the primary studies list. We considered any of these studies that satisfied the filtration criteria as described later in this chapter.
2.2.1.2.2
Literature Libraries Resources
In this SLR, we included two of the most popular electronic databases in order to search for the primary review studies, namely IEEE – Xplore and ACM Digital Library. The search term was constructed using the advanced search features provided by each of these two databases. The search covered metadata in the case of IEEE – Xplore, and both metadata and body (content) of literatures in the case of ACM Digital Library.
Our search included the period January 2000 to December 2014. Since the SA concept was initially introduced by Zhang et al. in 2011 [7], we expected that relevant literature would be found from 2011 and forward. However, we made our search timeframe wider in order to guarantee gathering all possible relevant papers.
2.2.1.3
Study Selection
In order to eliminate any irrelevant papers which would not add any significant information, we conducted the following two filtration phases:
• Filtration phase 1: both inclusion and exclusion criteria (as defined in the next subsection) were defined and applied to the unique candidate papers to eliminate any irrelevant papers so that only relevant papers with useful information would result from this phase.
2.2.1.3.1
Inclusion and Exclusion Criteria
As mentioned above, carefully defining the inclusion and exclusion criteria is crucial in leveraging the chance of including only relevant studies from the search results. For this reason, we defined the inclusion and exclusion criteria as follows:
Inclusion Criteria
The studies that satisfied the following four criteria passed the first filtration phase and were considered for the quality assessment step or second filtration phase. The inclusion criteria are defined as follows:
• SA concepts were applied to extract insights from software project artifacts.
This criterion was defined to guarantee the alignment between the considered study and the SA definition.
• Research was relevant to software project lifecycle phases.
Again, this criterion was defined to guarantee the fulfilling of the SA definition.
• Research was directly related to the software industry and stakeholders.
This criterion originated from the SLR prototype, as we noticed the usage of the SA term within studies from domains other than software engineering which just refer to the SA term.
• For duplicate publications of the same study, the newest and most complete one was selected. This is recorded for only one study whose related work appeared in two conferences.
Exclusion Criteria
When any of the following criteria applied to a study, we excluded it from the list of papers to consider. The exclusion criteria defined for this study were as follows:
This occurs due to the misuse of the term “software analytics” for describing traditional data mining, machine learning, or statistical work.
• Studies that were irrelevant to software projects.
This includes studies targeting other domains such as the automotive industry that misuses the term “software analytics” to refer to general “data analytics.”
• Studies that are relevant to generic data analytics and are not directly relevant to SA or software artifacts.
2.2.1.3.2
Review Quality Assessment
This step was important to ensure the accuracy of data extraction from the studies reviewed and in order to be confident about the results and conclusions. Also, as previously mentioned, this step was considered to be the second filtration step in order to come up with the final primary studies to consider while answering the questions. We defined the following quality assessment criteria:
QA1: The study contribution is clearly stated.
QA2: Software artifacts that are used are clearly explained.
QA3: SA characteristics are clear and different from those of direct statistics where advanced insights are provided.
QA4: The results and application(s) are described in detail.
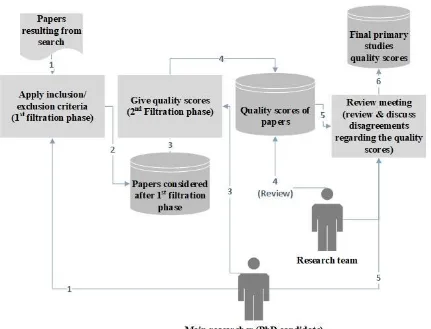
It is worth mentioning that for the scoring process, we adopted the scoring method recommended by Kitchenham [12] in the case of having only one main researcher. So, the main researcher, the PhD candidate in this case, scored the studies based on his judgment and experience. Then, in this case, a review check was performed by the research team, the PhD supervisors and teammates. For this review check, the principle researcher went through the scores of the studies considered. In case of any concern or disagreement, a discussion meeting was scheduled between the researchers where a discussion took place until reaching an agreement regarding all scores of the studies considered. The review check process is a repetitive process and can be repeated until reaching a confident level of agreement among researchers regarding the assigned scores. For this study, the review discussion was finalized in one discussion meeting of about one hour. A summary of the scoring process is shown in Figure 2-1.
2.2.1.4
Data Extraction
The data extraction step is two- pronged. First, it involves defining the extracted pieces of information or the data which should be obtained from each study considered, in order to answer the questions. Second, these defined pieces of information for each of the studies considered need to be extracted and stored to prepare for the analysis and data synthesis stages as described in the next subsection.
We defined the data extraction card as shown in Figure 2-2. It is important to be very careful when defining fields or pieces of information to be included in the data extraction card, since all of the information required to answer all of the questions should be collected and made available for the analysis phase. This is crucial, because discovering missing information at the analysis stage will be very expensive and can lead to an intensive process of going through all of the studies that were considered to extract this missing information. For this reason, the data extraction card was carefully reviewed, and then a pilot study was executed on a small sample of the studies being considered in order to be confident that the questions could be answered using the information from the data extraction cards. Once we were confident of the completeness of the defined data extraction card, we ran the data extraction process on all of the studies considered.
Study id Authors Study title Source
Year of publication
Q1: Beneficiary practitioners Q2: Domain
Q3: Analyzed software artifacts Q4: Different linked artifacts
2.2.1.5
Data Synthesis
In this stage, the extracted data was aggregated in order to answer the questions. For the questions answers representation, we used the narrative synthesis method. Accordingly, we used tables and charts to present the results.
After defining the protocol, the next step was to execute this protocol in order to come up with the primary studies, and then extract and record the needed information. After that, we applied data synthesis on the recorded data to come up with and report our insights and conclusions. Moreover, as a final step, we reported in detail the review limitations and provided our recommendations in the next section.
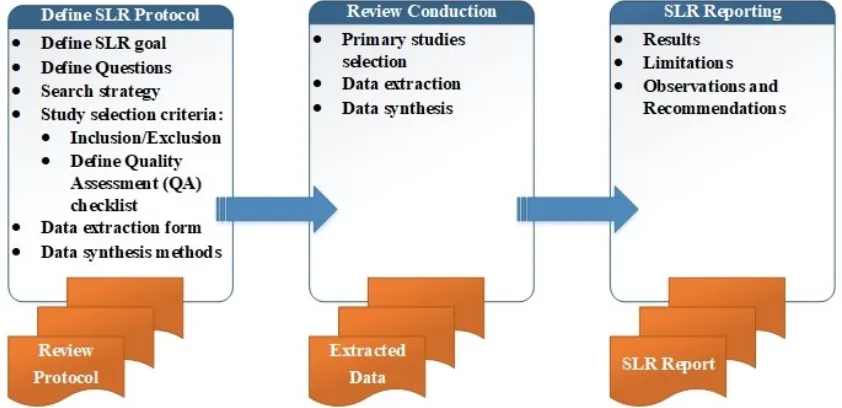
A summary of the protocol definition and the conduction processes for the SLR is shown in Figure 2-3.
2.2.2
Systematic Literature Review Results
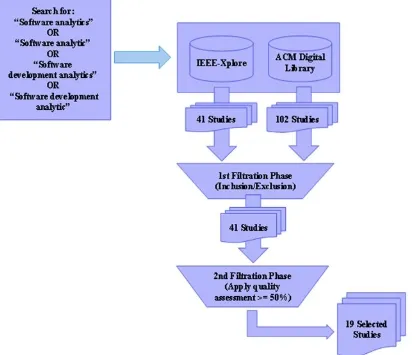
We followed the defined protocol (see Section 2.2.1), in order to execute the SLR. As a result, we started by searching the libraries we had decided on using the defined search terms. The search results contained 135 unique candidate papers (41 papers from IEEE Xplore, 102 from ACM Digital Library). There were 8 duplicate papers, for which we considered only one version.
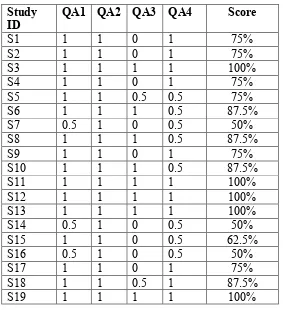
The next step was to apply the two filtration steps. By applying both inclusion and exclusion criteria, the relevant papers totaled 41. After applying phase 2 of the filtration process, represented by the quality assessment stage, the relevant papers were narrowed down to 19; these papers were used for data extraction. The list of selected primary studies is shown in Table 2-1, and their correspondence quality scores are shown in Table 2-2. Also, the filtration process is summarized in Figure 2-4.
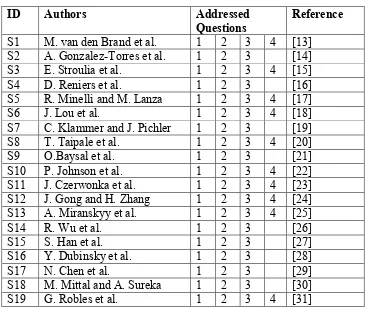
Table 2-1 Primary Studies Selected
ID Authors Addressed
Questions
Reference
S1 M. van den Brand et al. 1 2 3 4 [13] S2 A. Gonzalez-Torres et al. 1 2 3 [14]
S3 E. Stroulia et al. 1 2 3 4 [15]
S4 D. Reniers et al. 1 2 3 [16]
S5 R. Minelli and M. Lanza 1 2 3 4 [17]
S6 J. Lou et al. 1 2 3 4 [18]
S7 C. Klammer and J. Pichler 1 2 3 [19]
S8 T. Taipale et al. 1 2 3 4 [20]
S9 O.Baysal et al. 1 2 3 [21]
S10 P. Johnson et al. 1 2 3 4 [22]
S11 J. Czerwonka et al. 1 2 3 4 [23] S12 J. Gong and H. Zhang 1 2 3 4 [24] S13 A. Miranskyy et al. 1 2 3 4 [25]
S14 R. Wu et al. 1 2 3 [26]
S15 S. Han et al. 1 2 3 [27]
S16 Y. Dubinsky et al. 1 2 3 [28]
S17 N. Chen et al. 1 2 3 [29]
S18 M. Mittal and A. Sureka 1 2 3 [30]
S19 G. Robles et al. 1 2 3 4 [31]
By defining the primary studies to consider, we employed the defined data extraction card to extract the information needed to answer the questions and execute the data synthesis stage.
considered have a quality score ≥ 75% (15 out of 19 papers). Table 2-3 shows the quality score levels of all papers that passed the first filtration phase.
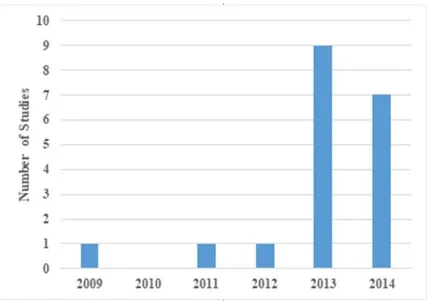
The distribution of the studies selected in each publication year is shown in Figure 2-5, which clearly indicates that SA studies became more active only in the last two years, 2013 and 2014.
In the following subsections, we illustrate the review results for each of the questions, one by one, supported with statistics from the data extraction.
Table 2-2 Primary Studies Quality Scores Study
ID QA1 QA2 QA3 QA4 Score
S1 1 1 0 1 75%
S2 1 1 0 1 75%
S3 1 1 1 1 100%
S4 1 1 0 1 75%
S5 1 1 0.5 0.5 75%
S6 1 1 1 0.5 87.5%
S7 0.5 1 0 0.5 50%
S8 1 1 1 0.5 87.5%
S9 1 1 0 1 75%
S10 1 1 1 0.5 87.5%
S11 1 1 1 1 100%
S12 1 1 1 1 100%
S13 1 1 1 1 100%
S14 0.5 1 0 0.5 50%
S15 1 1 0 0.5 62.5%
S16 0.5 1 0 0.5 50%
S17 1 1 0 1 75%
S18 1 1 0.5 1 87.5%
2.2.2.1
Beneficiary Practitioners (Q1)
The first question of this literature review was defined as follows:
Q1: Which software practitioners does the available SA research target?
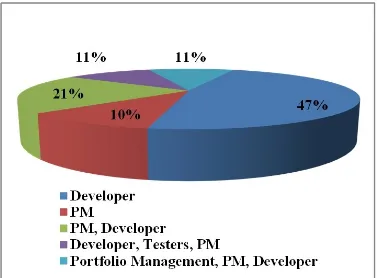
The target of the first question is to figure out the main practitioners who would benefit from the primary SA studies. From the studies selected, we identified that the main practitioners who would be supported by available SA studies are:
Developer
Tester
Project manager (PM)
Portfolio manager and Senior management
These results are shown in Figure 2-6, where 90% of all studies targeted developers (17 out of 19) with about 47% (9) exclusively supporting developers (for details see Table 2-4). This shows that SA needs more research regarding stakeholders other than developers. Even the available research work that supports other stakeholders, like PMs, is still undeveloped and is similar to the direct statistics and dashboard work. For example, Stroulia et al. (S3) proposed a framework called “Collaboratorium Dashboard” in order to visualize insights extracted from collaborative software development tools. These tools included information related to a team that has worked on a certain project, project artifacts, communication between project stakeholders, and the process followed. Also, the authors integrated their framework with IBM Jazz and WikiDev, which already included integration with SVN, Bugzilla, email, and wikis.
Although the proposed dashboard provided useful information for PMs in a visual form, such as the number of emails sent by each team member and the number of files checked
Table 2-4 Q1 Extracted Data Practitioner Supporting Studies
Developer S1, S4, S5, S6, S7, S8, S9, S10, S11, S13, S14, S15, S16, S17, S19 Tester S2, S13
Project
Manager S2, S3, S4, S8, S10, S11, S12, S13, S18, S19
Portfolio
Manager S10, S19
Table 2-3 Quality Assessment Levels Statistics
Quality Levels #
Studies Percentage
Very high (85% ≤ score ≤ 100%) 9 22%
High (75% ≤ score < 85%) 6 15%
Medium (50% ≤ score < 75%) 4 9%
in by each developer, this still formed a straight-forward insight extraction or statistics from software artifacts. More analytics are needed to link more than one artifact and get more supportive and powerful decisions. This can be the link between the source code of a certain feature, the emails related to this feature, or the quality reports, which can be very useful to highlight the need for refactoring a certain part of this code. Such advanced analytics are a major need for any future research in SA.
2.2.2.2
Research Domain (Q2)
The second question of this literature review was defined as follows:
Q2: Which domains are covered by SA studies?
The aim of the data extracted for Q2 was to identify the main active SA research domains in order to support practitioners in deciding both innovative and cutting edge topics and research opportunities.
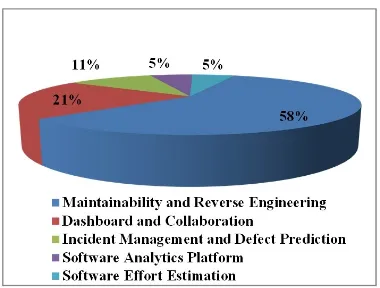
Our review showed that most available SA studies fell into one of the following domains:
Maintainability and Reverse Engineering
Team Collaboration and Dashboard
Incident Management and Defect Prediction
SA Platform
Software Effort Estimation
The distribution of the studies considered per domain can be found in Figure 2-7 (for details see Table 2-5).
In the following subsections, we illustrate our findings for the most significant studies in each domain.
2.2.2.2.1
Software Analytics for Software Maintenance and
Reverse Engineering
Gonzalez-Torres et al. (S2) provided a visualization tool (Maleku) which extracts facts and insights from large legacy software and provides PMs and developers with useful information to support their decisions related to software maintenance. This tool extracts information from software repositories and monitors the repository for any updates in order to redo the analysis.
Although the proposed tool provided visualization features, these features simply represent traditional statistical information, like extracting the metrics related to inheritance and interface implementation.
Another study by Van den Brand et al. (S1), presents SQuAVisiT – a powerful visual SA tool. It has been successfully applied to the maintainability assessment of industry-sized software systems, combining results of metrics analysis (such as quality analysis), and visualization of these analysis results. The tool provides software design metrics such as cyclomatic complexity and inheritance depth. The tool also provides checking of code convention, duplication, and bad practices. Although the visual tool provided is useful, the metrics analysis is traditional and appears in older literature.
Table 2-5 Q2 Extracted Data
Domain Studies
Maintainability and Reverse Engineering
S1, S2, S4, S5, S7, S12, S13, S14, S15, S16, S17
Team Collaboration and Dashboard
S3, S9, S10, S18
Incident Management and Defect
Prediction S6, S8
Minelli and Lanz (S5) are trying to determine whether the traditional maintainability approaches are valid for mobile applications (apps). They rely on the analytics of three artifacts: source code, third party API invocation, and application revision historical data. Minelli and Lanz implemented a visualization SA tool for mobile apps called “SAMOA” (Software Analytics for Mobile Applications). The tool provides visual presentation for multiple software metrics, apps versions, and the size of relative lines of code between core functionality and third party invocation.
Although the visualization tool presented can support project management, the metrics presented are very similar to traditional metrics from literature. It was expected to use more available artifacts such as user comments and ratings from app stores (like iOS Apple store or Google apps store). Also, Minelli and Lanz rely on only one dataset for their study.
Klammer and Pichler (S7) introduced a reverse engineering tool and applied it to electrical engineering software programs. The tool analyzes only the software source code in order to provide some insights related to source code structure and to locate features within source code. Multiple languages are supported such as C++ and Python. This work is similar to traditional work, and it needs to consider other software artifacts in order to apply SA concepts.
2.2.2.2.2
Software Analytics for Team Collaboration and
Dashboard
reviewing the bug history on the issue tracking system. In order to make this work in a more sophisticated way, new features such as team productivity trend charts can be provided.
2.2.2.2.3
Software Analytics for Incident Management and
Defect Prediction
Lou et al. (S6) introduce an SA tool called Service Analysis Studio (SAS). SAS supports engineers in improving incident management by facilitating and automating the extraction of supportive insights. SAS has the ability to use multiple data sources – such as performance counters, operating system logs, and service transaction logs – to provide insights.
What makes this study important is that it applies the SA concept by linking multiple artifacts. Also, it presents a new algorithm to analyze system metrics data and suggests which abnormal metric is suspected of being the root cause of the incident. In addition, it introduces a mining technique to find the suspicious execution patterns—which are the sequence of actions that led to the incident— within the huge number of transaction logs.
2.2.2.2.4
Software Analytics Platform
Czerwonka et al. at Microsoft (S11) provide an SA common platform called CODEMINE. The need for CODEMINE emerged from the observation of the commonality between the input, outputs, and processing needs of multiple analytics team tools. CODEMINE acts as the common analytics framework for multiple client SA applications at Microsoft. The CODEMINE’s ability to provide data from different software artifacts (such as source code, project schedule, milestones, and defect reports) opens new research opportunities at Microsoft. In turn, this will enrich insights by extracting information from cross-products which will boost team collaboration.
2.2.2.2.5
Software Analytics for Software Effort Estimation
development effort. As a result, the authors offer a model that extracts data related to developer activities from the source code management repository, and then guesses the effort roughly based on these activities (like the time between two commits). Then, the model calibrates the rough estimates based on other estimates collected from the developers in a survey. This study is promising, especially in the way it links artifacts to obtain insights that are useful for tackling such a hard-to-track topic as effort estimation of open source software projects.
2.2.2.3
Analyzed Software Artifacts (Q3)
The third question was defined as follows:
Q3: Which software artifacts are extracted?
In order to address Q3, we extracted the analyzed artifacts in each study. This was very important for our study to be able to evaluate the alignment of the studies with the goal of having SA analyze more than one software artifact and provide more advanced insights.
Table 2-6 Q3 Extracted Data
Study ID Analyzed Artifacts
S1, S4, S7, S16 Source code
S2 Code repository
S3 Source code repository, issue tracking system, email, wikis S5 Source code, version control system
S6 Performance counters, operating system logs, service transaction logs
S8 Issue management system, version control system, code
reviewing system, source code, organizational data, testing data
S9 Issue tracker
S10 Process data, product data
S11 Source code, project schedule, milestones, defect reports S12 Source code, bug reports
S13 Source code, version control system, bug reports S14, S15 Call stack
S17 Mobile apps users reviews
S18 Team wiki, version control system, issue tracking system S19 Version control system, developers survey
2.2.2.4
Checking Artifacts Linkage Before Analysis (Q4)
The fourth question was defined as follows:
Q4: If different artifacts are used, are they linked together?
In order to address the last question, Q4, we evaluated the analysis of the artifacts used. The main goal was to make sure that the artifacts were linked together in order to get more complex insights that could support software practitioners in making their decisions. It is worthwhile to highlight that this analysis was valid for only 10 studies when more than one artifact was used. This was achieved by reviewing the study scores for the third quality assessment criteria (QA3). The results show that eight studies scored 100%, which reveals that these studies link multiple artifacts to get insights that can support decision making. Therefore, these studies comply with the SA concept and can be considered as good references for practitioners to understand the SA concept. For more details, see quality scores in Table 2-2.
2.2.3
Systematic Literature Review Limitations
In this review, we considered both journal and conference papers without evaluating their rankings. This can be attributed to the difficulty that we faced when trying to find well established and relevant papers, which was a result of two factors. The first was that the SA field was less than four years old at the time of this review. The second factor had to do with the misuse of the term SA and the confusion of the researchers about its correct indication. This was shown by the number of papers considered after applying the filtration phases, as previously mentioned.
2.3
Systematic Literature Review Addendum
research area, we examined the status of the same gaps. This was achieved by analyzing the new search results list, which confirmed the existence of the same research gaps that had been detected by our previous SLR. Those gaps include the analysis of only one software artifact (in most cases is the source code), and the scarcity of studies that target stakeholders other than developers. However, our search detected a few studies (around 8) that have done some promising effort, which comes aligned with our recommendations from the SLR, such as targeting more stakeholders [32] and exploiting more artifacts [33].
2.4
Summary
In this chapter, the available SA studies were investigated in order to understand the current status of this new research topic. We conducted a literature review searching for the relevant studies available from 2000-2014. Our review considered 19 primary studies that supported us in addressing the four defined questions. The results can be summarized as follows:
Q1: The practitioners who benefit from the current SA studies are developers, testers, PM, portfolio managers, and senior management; about 47% of the considered studies support only developers.
Q2: The studies considered showed that SA research covered the domains of maintainability and reverse engineering, team collaboration and dashboards, incident management and defect prediction, the SA platform, and software effort estimation.
Q3: Most of the studies considered (around 47%) analyze only one artifact for their study.
Chapter 3
3 Lessons Learned Recall Background and Motivation
In this chapter, we will explain the main concepts employed in this research work. This includes the description of the lessons learned (LL) definition and the fundamentals of the information retrieval (IR) models. Moreover, we will present the state-of-the-art and research gaps of the LL recall field will be illustrated.
3.1
Lessons Learned in Software Engineering
The LL could be conceived of as an important part of the organization’s memory and cumulative experience and knowledge. LL could be guidelines, handling scenarios or tips related to what went wrong (mistakes), or what went right (opportunities), in certain situations or events. In addition, LL could be a success that the organization wants to repeat, or a failure that the organization wants to avoid in the future. The need to preserve the organization’s knowledge, which could be lost as a result of several factors, such as expert turnover, calls for the adoption of these LL repositories. The LL concept is evolving, and multiple organizations have their own LL repositories [6] [34].
It is valuable to highlight that LL differ from best practices. In contrast to the best practices that capture only successful scenarios, the LL can capture both success and failure scenarios. Also, best practices are ideas that are recommended on the industrial scale and could be localized to the organization, while LL are organization-oriented and could be globalized to the industrial scale.
It is worth mentioning that although LL records can be related to any software practice, such as project management and development, we focus in this work only on LL records related to project management.
learned represented by three fields, namely context, problem/opportunity, and recommendations. In this example, the development team should be at the customer’s premises, which means that issuing an entry visa for the team could be the cause of a planning issue. For this reason, the recommended action is to plan for this ahead, as shown in the LL recommendation section.
Table 3-1 Lesson Learned Example 1
Attribute Value
Context One of our project constraints is to have the development team onsite (at the customer’s site), and our customer is in X country.
Problem/Opportunity Issuing a visitor’s visa for our team members takes a lot of time, especially during high seasons.
Recommendations Try to keep your staffing plan updated and make sure it covers 1 or 2 months ahead.
Try to start the visa issuing process, for any member, 4-5 weeks ahead of the start date of the planned task at the customer’s site.
Try to seek your customer’s support in getting a long-term visa (example: 6 months) with multiple entries.
Obs: some sensitive information regarding customer’s identity and country was updated or removed due to the non-disclosure agreement
Table 3-2 Lesson Learned Example 2
Attribute Value
Context Project scope includes an implementation of a small-sized mobile application. This mobile application is not reusable, i.e., it will only be used in this project.
Problem/Opportunity If the mobile application is of a small size, then the organizational process and overhead tasks, such as quality assurance and management reporting, will reduce the profit from implementing the mobile application in-house.
Recommendations Outsource the implementation to an external mobile application specialized company.
Contact the purchase team for a trusted partners list.
3.2
Lessons Learned Recall State-of-the-Art
The LL information can only be beneficial if project managers (PMs) refer to it for solving present issues or avoiding expected risks, which is not always the case. Unfortunately, LL are often abandoned due to the lack of knowledge of relevant LL by PMs or due to the need to continuously remind them of the existence of new relevant LL [35]. Although, this can be overcome by PMs manually searching for relevant LL records, this is effort and time costly, especially when searching unstructured information. Also, there could be other reasons for disregarding LL repositories, such as time limitations [35]. This calls for effective and automatic LL recall solutions. By
automatic we mean that there should be no need for manual searching to facilitate and support frequent references to and exploitation of LL. In this section, we present the related work and state-of-the-art regarding the LL automatic recall.
Most of the available LL research focuses on either the LL process or the implementation of a standalone LL repository system [34]. To the best of our knowledge, there is a paucity of software engineering research addressing LL recall solutions [34].
repository navigation. However, this does not eliminate the need for users to manually define the search query string. This is different than our proposed solution, as will be described in Chapter 4, which makes use of the existing project artifacts to search for the relevant LL.
Sary and Mackey [37] have introduced RECALL, which is a case-based reasoning (CBR) system. CBR has been employed to improve relevant LL retrieval by users. RECALL work differs from our proposed research in significant ways. First, the employed CBR technique is different from the proposed IR techniques that are presented in this thesis. Second, the RECALL system relies on describing the LL in a case-based question-answer format. This format is difficult to follow for the existing organizations’ LL repositories.
3.3 Information Retrieval Models Applied to Recall
Lessons Learned
IR refers to the process of finding a relevant document or information of interest within a collection of documents or artifacts. In this thesis, we use the IR term to refer to text IR in mining software repositories. Usually the data within the searched collection, in the case of IR, is in an unstructured format (i.e., natural language text) [40]. The input to the IR classifier is a query, or question, and the result is a list of the documents relevant to this query [41]. The IR idea is similar to that of web search engines, such as Google, where the user provides a query, describing the need or the question, and the search engine tries to answer the user’s question by replying with a list of the most relevant web content.
Regarding the employment of IR techniques in solving software engineering problems, it is worth mentioning that IR models have been used to solve several problems in the software engineering domain, such as bug localization [42][43][44] and concept location [45], but have not been employed to improve the LL recall as per our knowledge [46]. Thus, to the best of our knowledge, we are the first to employ IR techniques to solve the LL recall issue within the software engineering context [46]. We will explain our solution in detail in Chapter 4.
performance has already been studied in software engineering domains other than LL recall, such as bug localization [42] and equivalent requirements [47], plays a role in the motivation to consider the parameter configurations impact in our own study. In addition, an optimization of the IR model configurations based on the dataset at hand is important and is an open research area (for more details, please see Section 7.1).
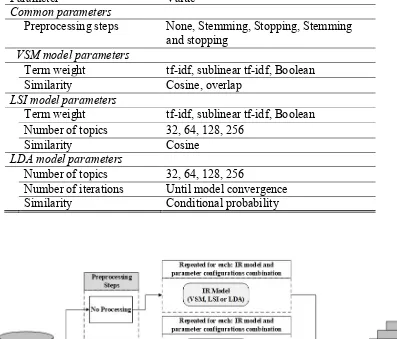
In the following subsections, we will provide some details regarding the preprocessing steps that we applied to the text inputs. Then, we will give an introduction to three of the most popular IR models from the literature that were used in this study. These models are: Vector Space Model (VSM), Latent Semantic Indexing (LSI), and the Latent Dirichlet Allocation (LDA).
3.3.1
Text Preprocessing Steps
Since both the documents’ corpus, LL repository in our case, and the query comprise unstructured information, they are preprocessed before being forwarded to construct or query the LL classifiers. The preprocessing plays a key role in reducing any information noise, which could be a source of confusion to the LL classifiers. It is common practice in IR research to apply one or more preprocessing steps from the NLP literature [41]. The following is a brief description of the two preprocessing steps we applied in this study:
Stopping step: removing the common stop words from the English language, such as “the” and ‘a’. Such words are very common and have high appearance frequency within the document, which can impact the relevance score while not representing a real relevance of the document to the query.
Stemming step: reducing the words to their morphological roots or stems. For example, “stem” is the root for both “stemming” and “stems”.
3.3.2
Vector Space Model
has a term weight value corresponding to each document in the corpus. The row dimension value of the matrix represents the number of the different terms, where each row represents a term. On the other hand, the column dimension value represents the number of the various documents in the corpus. In each term row, the term has a non-zero weight value if the term exists in the corresponding document, and a zero value otherwise. The term can represent a single word and its weight can be calculated as a simple existing Boolean value, where existing Boolean value ‘1’ is “exist” and ‘0’ is “not exist,” in each document. In order to decide if two documents, or a document from the corpus and a query, are relevant, the VSM model compares these two documents’ columns or vectors from the terms versus the documents’ matrix. This comparison is achieved using a configured similarity method which can be, for example, the inner product of the two documents’ vectors. To consider two documents relevant, they should have one or more common terms. The VSM model returns a proportional continuous similarity value according to the number of common terms between the two compared documents.
The VSM model has two main configurable parameters:
Term weight: the term weight in a document. The basic weight method is the Boolean
method whose value is ‘1’ if the term appears in the document, and ‘0’ otherwise. Other popular weighing methods are term frequency (tf), which is the number of times the term appears in a document, and term frequency-inverse document frequency (tf-idf), which is an extended version of the original tf with the consideration of the term popularity in corpus documents [40]. For tf-idf, the term weight for a certain document is high if it appears with high frequency in this document and, at the same time, the term is rare and has a low frequency within the overall document corpus.