Scholarship@Western
Scholarship@Western
Electronic Thesis and Dissertation Repository
8-10-2018 3:00 PM
A bioinformatics analysis of contributors to false discovery for a
A bioinformatics analysis of contributors to false discovery for a
mouse genotyping array
mouse genotyping array
Nisha Patel
The University of Western Ontario
Supervisor Hill, Kathleen A.
The University of Western Ontario Graduate Program in Biology
A thesis submitted in partial fulfillment of the requirements for the degree in Master of Science © Nisha Patel 2018
Follow this and additional works at: https://ir.lib.uwo.ca/etd
Part of the Biology Commons, and the Genetics and Genomics Commons
Recommended Citation Recommended Citation
Patel, Nisha, "A bioinformatics analysis of contributors to false discovery for a mouse genotyping array" (2018). Electronic Thesis and Dissertation Repository. 5647.
https://ir.lib.uwo.ca/etd/5647
This Dissertation/Thesis is brought to you for free and open access by Scholarship@Western. It has been accepted for inclusion in Electronic Thesis and Dissertation Repository by an authorized administrator of
Microarray experiments employing massively-parallel hybridization are valuable for the study of genetic variation, however, errors during hybridization and limitations of single-species design must be considered for use within and across single-species. The Mouse
Diversity Genotyping Array (MDGA) is a low cost, high-resolution microarray with probes that bind to target DNA for variant detection. Errors associated with probe design and incomplete protein removal from target DNA lead to false discovery and thus
necessitate examination of probe suitability and target DNA availability. Bioinformatics methods were used to carry out confirmation of probe annotations, assessment of DNA accessibility for hybridization to probes, and prediction of the theoretical ability of MDGA probes to hybridize cross-species to naked mole-rat genomic DNA. The results are a filtered probe list demonstrated to reduce false discovery, a suggested approach to assess biases arising from protein-bound DNA, and predictions for cross-species application of the MDGA to naked mole-rat samples.
Keywords
ii
Co-authorship statement
Nisha Patel completed the work presented in this thesis under the supervision and financial support from Dr. Kathleen Allen Hill. This thesis is presented in monographic format. Nisha Patel performed the bioinformatics analyses presented in this thesis and contributed to a publication by Locke et al.1. Dr. Kathleen Hill is a senior author on all
publications arising from the research presented due to her role in project design,
iii
Acknowledgements
First and foremost, I would like to thank my supervisor, Dr. Kathleen Hill, for the patient guidance, encouragement, and support she has provided throughout the duration of my time as her student. I am extremely lucky to have a supervisor who cared so much about my progress and stood by me to the end. Her knowledge and patience were essential to the progression and completion of this thesis. I would also like to express gratitude to my committee advisors Dr. Susanne Kohalmi and Dr. Shiva Singh who have continued to support me throughout the duration of my project.
iv
Table of contents
Abstract ... i
Co-authorship statement ... ii
Acknowledgements ... iii
Table of contents ... iv
List of figures ... viviii
List of tables... iviii
List of abbreviations ...x
Chapter 1 Introduction...1
1.1Research motivation ... 1
1.2 Variation exists in genomes both within and across species………..…. 2
1.3 The laboratory mouse is a valuable organism for studies of genetic variation ... 3
1.4 Measuring single nucleotide polymorphism diversity and detecting copy number variation: Current technologies ... 4
1.5 The Mouse Diversity Genotyping Array is a high-throughput tool for the study of genetic variation in the mouse ... 6
1.5.1 Elements of the experimental pipeline can affect false discovery ...8
1.6 Massively-parallel hybridization is successful under ideal conditions ... 12
1.6.1 First source of error: Flawed probe design and inaccurate annotations reduce reliability and accuracy of variant calls ...14
1.6.2 Second source of error: Ineffective removal of proteins from target DNA may result in a bias for deletions in microarray studies ...15
v
1.7.1 SNP arrays can be useful for cross-species applications ...18
1.7.2 The naked mole-rat as a candidate for cross-species hybridization of the Mouse Diversity Genotyping Array ...20
1.7.3 Probes on the array may be suitable for cross-species hybridization ...21
1.8 Central goal and specific objectives... 23
Chapter 2 Materials and Methods...24
2.1 Assessment of probe suitability and annotation accuracy for hybridization to target mouse DNA ... 24
2.2 Mapping copy number variant regions alongside DNase I sensitive regions across the genome ... 26
2.4 Compiling a list of stringent probes suitable for cross-species hybridization ... 32
2.5 Determining sequence-specific biological functions of probe targets complementary to the naked mole-rat genome ... 34
2.6 Analysis of variance was used to determine differences in DNase I accessibility between tissues ... 35
Chapter 3 Results ...36
3.1 A number of probe annotations required computational correction or removal prior to SNP genotyping and CNV calling ... 36
3.2 Copy number deletions did not show a bias for complete overlap with closed DNA and duplications were detected in regions of closed DNA ... 42
3.2.1 DNase I accessibility measures across tissues show similar ratios of open to closed DNA ...42
3.2.2 A disproportionate number of deletions in closed DNA was not observed ...45
vi
3.3 A subset of probes on the Mouse Diversity Genotyping Array are predicted to
cross-hybridize to naked mole-rat DNA ... 55
3.3.1 Stringent probes complementary to the naked mole-rat genomes are associated with genic regions in the mouse...58
Chapter 4 Discussion ...71
4.1 Correction or removal of incorrect probe annotations improves accuracy in variant detection……….. 71
4.2 DNase I accessibility landscapes are predicted to be useful as a measure of target DNA accessibility for hybridization ... 74
4.2.1 Embryonic tissues have relatively more open landscapes of DNase I accessibility ...74
4.2.2 A lack of correlation between deletions across all sample sets with closed DNA suggests effective protein removal from protein-bound DNA ...74
4.3 A subset of Mouse Diversity Genotyping Array probes is predicted to hybridize to naked mole-rat target DNA ... 77
4.3.1 Potential segmental duplications may be revealed by probe sequences aligning to multiple loci in the naked mole-rat genome ...77
4.3.2 Exon conservation between mouse and naked mole-rat genomes is difficult to explore through complementary invariant genomic probes ...79
4.3.3 A very small number of SNP probe sequences aligned to the distantly-related naked mole-rat genomes ...82
4.3.4 A measure of SNP diversity is limited for this study because sample size is too low...83
4.4 Conclusions ... 86
References ...87
vii
List of figures
viii
List of tables
Table 2.1 Copy number variant (CNV) data from a publically available reference sample set of 351 mouse tail samples ...27
Table 2.2 Copy number variant (CNV) data for an in-house sample set derived from three mouse tissues ...29
Table 2.3 Previously published DNase I accessibility data for mouse tissues exist as tracks ...30
Table 2.4 Two naked mole-rat reference genome builds were used to predict hybridization between Mouse Diversity Genotyping Array (MDGA) probes and naked mole-rat samples...33
Table 3.1 Annotations for invariant genomic probes (IGPs) and single nucleotide polymorphism (SNP) probes used for analyses were either corrected or removed based on exclusion criteria ...36
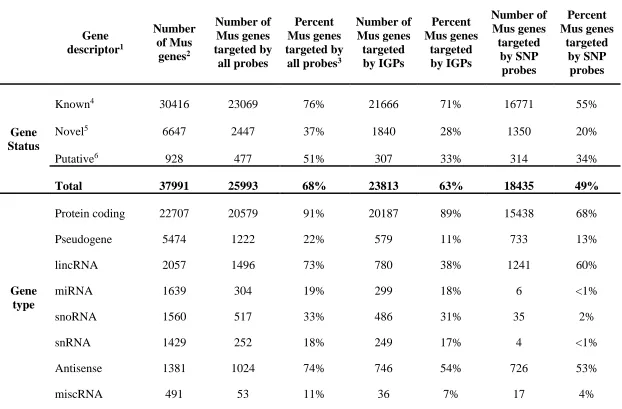
Table 3.2 Proportion of all Mus genes associated with stringent probes on the Mouse Diversity Genotyping Array ...38
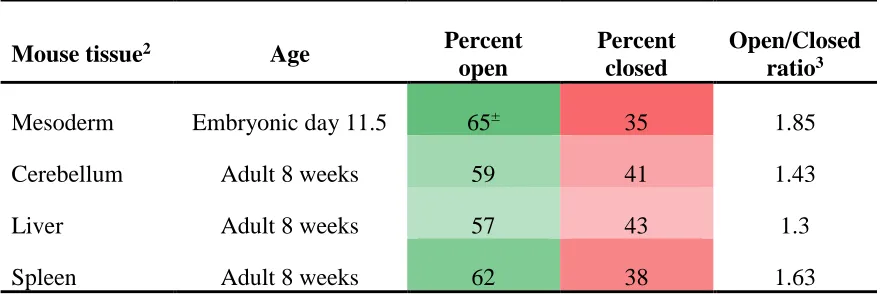
Table 3.3 Percentage of total DNase I accessibility and inaccessibility across the autosomal genome by tissue type ...43
Table 3.4 Distribution of all closed regions as a percentage of all base pairs across the autosomal genome ...44
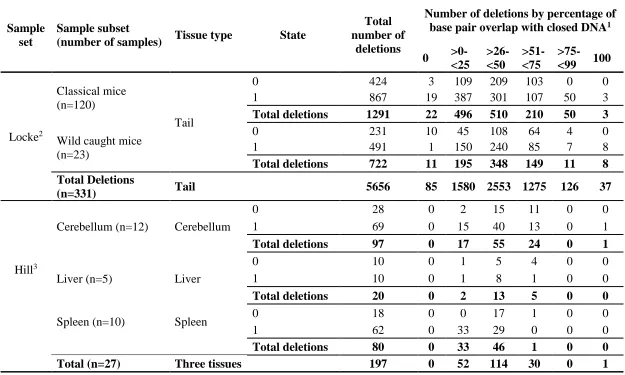
Table 3.5 Extent of overlap between deletions and regions of closed DNA ...46
Table 3.6 Extent of overlap between duplications and regions of closed DNA ...48
Table 3.7 Extent of CNVs found to lie completely in closed DNA (100% base pair overlap) ...51
ix
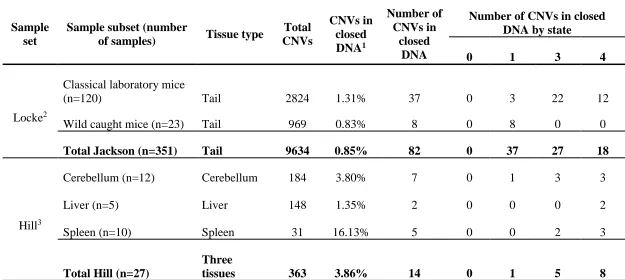
Table 3.9 Extent of overlap between CNVs and tissue-specific closed intervals of DNA ...56
Table 3.10 Approximately 17,000 single copy loci in the naked mole-rat genomes are predicted to bind to stringent probes on the Mouse Diversity Genotyping Array ...57
Table 3.11 A total of 275 full invariant genomic probe (IGP) sets complement both naked mole-rat genome builds ...59
Table 3.12a Counts of all Mus genes covered by stringent IGPs predicted to bind to a naked mole-rat genome ...62
Table 3.12b Proportion of all Mus genes associated with stringent IGPs predicted to bind to a naked mole-rat genome ...64
Table 3.13 Full IGP sets complementing both naked mole-rat genomes are enriched for gene networks involved in basic cellular processes and development...67
Table 3.14 Gene networks for development are associated with the 358 genes targeted by SNP probes complementing the naked mole-rat genomes ...68
x
List of abbreviations
16S rRNA 16S ribosomal RNA
aCGH Array Comparative Genomic Hybridization
ANOVA Analysis of Variance
B6 C57BL/6J
BED Browser extensible data [file extension]
BLAST Basic Local Alignment Search Tool
bp Base pairs
CEL Cell intensity file [file extension]
CGD Center for Genome Dynamics
CGH Comparative genomic hybridization
CNV Copy number variant
DAVID Database for Annotation, Visualization, and Integrated Discovery tools
DHS Deoxyribonuclease I hypersensitive site
DNase I Deoxyribonuclease I
DNA Deoxyribonucleic acid
dsDNA Double-stranded DNA
GO Gene Ontology
ENCODE Encyclopedia of DNA Elements
FASTA FAST-All [file type]
FTP File Transfer Protocol
IGP Invariant genomic probe
xi Mb Megabase
MDGA Mouse Diversity Genotyping Array
MGI Mouse Genome Informatics
MT Mitochondria
NCBI National Center for Biotechnology Information
PCR Polymerase chain reaction
RE Restriction enzyme
SD Segmental duplication
SNP Single nucleotide polymorphism
SV Structural variation
Tm Melting temperature
Chapter 1 Introduction
1.1 Research motivation
The study of genomic variation enables us to understand the genetic makeup of an individual, a population’s genetic structure, and the functional consequences of genetic variants that underlie health, disease, and evolution. The laboratory mouse is a valuable organism for understanding genetic variation across the genome for many reasons including convenience, ease of study (i.e., an abundance of existing mouse resources and tools), and cost-effectiveness. While historically useful, the laboratory mouse does not represent all of the variation found in nature. For that reason, it is also important to study non-model organisms that collectively capture a greater breadth and depth of variation present across species in the natural world.
There are two major challenges in the study of genetic variation in model and non-model organisms: the lack of low cost, high-throughput genotyping technologies and errors associated with massively-parallel hybridization that lead to false discovery of genetic variants. Microarray technologies employ massively-parallel hybridization to detect genetic variants however experiments that rely on the simultaneous hybridization of sample DNA to millions of probes to assess hundreds of thousands of loci are error-prone. The Mouse Diversity Genotyping Array (MDGA), a microarray for the study of genetic variation in Mus species, is no exception. Inaccuracies in microarray data can lead to an inaccurate and poor understanding of true biological variation. A valuable approach in assessing potential sources of error in microarray data is the use of bioinformatics methods.
population genetics studies. Theoretically predicting probe suitability for cross-species study in naked mole-rat genomic DNA can demonstrate the potential applicability of the MDGA for cross-species use and naked mole-rat studies.
1.2 Variation exists in genomes both within and across
species
Genomic variation exists within an organism, between individuals of the same population, between populations, and between species. This diversity in DNA sequences of genomes is created by mutations and the specific DNA sequences that differ across genomes are referred to as genetic variants. Genetic variants can encompass stretches of DNA from as small as one base pair to millions of base pairs. When a single nucleotide at a specific genomic position differs in a number of individuals relative to the population (at least one percent of the population), it is referred to as a single nucleotide polymorphism (SNP). Variants can also exist as large-scale structural variants whereby large segments of the genome are affected. Structural variants that involve the loss or gain of segments of the genome are referred to as copy number variants (CNVs). Characterizing CNVs and SNPs is important in order to determine the extent of variation between individuals, populations, and species and also to study the role of variation in disease and evolution.
The most frequent type of genetic variant is a SNP5. Polymorphism for a single nucleotide refers to the existence of one of two possible alleles at a particular genomic position; determining which alleles exist at specific SNP sites is called SNP genotyping. More than 1.4 million SNPs were identified in the first initial sequencing of the human genome6. Since then, SNPs have been identified in many populations of many organisms and there are databases of known SNPs7,8. SNPs are found to occur on average every 300 nucleotides with about 10 million SNPs in the human genome9. Polymorphic sites in the genome are common, may affect fitness, and are important in evolution10. Determining
Copy number variation involves deletions or duplications of segments of DNA greater than 500 bp in size1. The deletions and duplications alter the diploid state of DNA where diploid refers to two sets of inherited chromosomes (maternal and paternal) and therefore two copies of each genomic locus along a chromosome. Deletions and duplications can create differences in copy number state of certain segments of DNA relative to the reference genome (copy number state of 2 for a diploid genome). CNVs, by virtue of encompassing large segments of the genome, play a major role in genomic variability11,12.
Rates of evolution and evolutionary relationships between populations and species
The variable copy numbers that persist in populations can give insight into rates of evolution as well as evolutionary relationships between populations and species. The rate of adaptive change is directly influenced by the gene duplication rate13. Gene
duplications in particular persist in populations due to their role in generating novel genes that have an evolutionary advantage14. For example, homologs of the AMY1 (Amylase, alpha 1A) locus in the human genome are found across a variety of primates suggesting the AMY1 gene must have arisen in an ancestor of present day humans and primates15. CNVs that persist in populations as duplications are considered to be segmental duplications16. Segmental duplications (SDs) are segments of duplicated DNA (> 1 kb) that are highly homologous with high sequence identity (or 90% or greater sequence identity among duplicates). SDs are associated with a significant proportion of novel CNVs and permit direct assessment of rates of evolution where fewer SDs suggest a slower pace of evolution15,17,18. CNVs lead to adaptive variability and can provide much insight into the evolution of species.
1.3 The laboratory mouse is a valuable organism for studies
of genetic variation
laboratory setting. The use of mice (Mus musculus) in research can be traced back to at least the 1800s and as a result, much is known about the laboratory mouse19. Laboratory mouse strains that are in use today were started in 1921 by the mating of two mice code-named C52 and C57 for over 200 generations20. One of the oldest, most widely used, and best characterized inbred mouse strains arising from this inbreeding is the C57BL/6J (B6). The B6 mouse is the second mammalian species after the human to have its DNA sequenced21.
The laboratory mouse serves as a model organism for the study of human CNV due to genomes of similar size, content, and organization22. Shared evolutionary ancestry is
evident from homologous genes being located in large blocks of syntenic regions as well as analyses showing 40% sequence alignment between mouse and human genomes23.
About 99% of mouse genes have a homologue in the human genome and 80% of mouse genes have an orthologous counterpart in the human genome21. Not only have CNVs been detected in both the mouse and human genomes, but the variants also show a high degree of sequence identity, making mouse CNV research relevant to CNV profiles in humans11,12,24,25.
1.4 Measuring single nucleotide polymorphism diversity and
detecting copy number variation: Current technologies
are far superior to the original Sanger sequencing technique used to first sequence the human genome in the early 2000s for the Human Genome Project6,27. Present day sequencing is carried out using NGS methodologies for both SNP and CNV detection28,29. While NGS technologies are powerful, they are also very expensive and not feasible for many population surveys of genome-wide genetic variation. CNV detection also required development of appropriate bioinformatics approaches which have only recently been refined30–32. Microarray technology is currently an important tool, particularly in studies of model (and non-model) organisms. Microarrays allow for the detection of variants by employing massively-parallel hybridization – the simultaneous binding of millions of probes to complementary target DNA from samples of interest. Microarray technology has been useful for SNP genotyping and more recently, whole-genome CNV discovery across a variety of species33–35.
A microarray, commonly known as an array, is a small chip that has millions of microscopic probes attached to its solid surface (typically a microscopic slide). The physical space on a chip along with the attached probes is referred to as a DNA feature. Probes are synthesized directly onto the surface of the chip using a special printing process called photolithography that involves relies on UV light and chemical synthesis technologies. The probes are single-stranded DNA molecules that are designed to be complementary at one location to a fully sequenced reference genome of the species. Each probe has a particular sequence that under optimal conditions can recognize and specifically bind to sample DNA according to the principle of complementary base pairing – a thermodynamic process called hybridization. Ultimately, it is the hybridization of target sample DNA to probe sequences on the array that allows for the detection of SNPs and CNVs. The probes themselves can range in size from 10 bases to many kilobases. Each probe consists of a unique nucleotide probe sequence associated with a genomic position in the reference genome.
variants (through comparison). Array-based CGH is limited in use because it is not designed for SNP genotyping. For this reason, the SNP array is the most commonly used microarray for SNP and CNV genotyping. The SNP array was initially developed for the simultaneous genotyping of SNP alleles at many known loci of a genome with probes designed to detect one of two alleles at a single locus. Additionally, the SNP array detects CNVs through probes designed specifically for regions of the genome that may exist in copies of a variable number. Copy number gains and losses are determined by comparing the number of copies of specific DNA sequences to the reference genome. The SNP array is a powerful tool for genome-wide SNP genotyping and CNV discovery due to the hybridization of millions of DNA sequences to probes, referred to as massively-parallel hybridization.
The underlying principle of microarray technologies is the successful and efficient hybridization of millions of probes to complementary strands of target sample DNA. The structure of double-stranded DNA (dsDNA) and more specifically, the binding affinity between two strands of DNA, is affected by thermodynamic factors – heat, work, and temperature – in predictable ways36. Hybridization between two complementary strands of DNA involves interactions between the nucleotide bases to result in an energetically preferred single complex, referred to as a duplex. An increase in the number of complementary base pairs of a given double-stranded DNA sequence results in a more stable, hybridized duplex due to more hydrogen bonds and stronger hydrophobic interactions between the base pairs. Thus, the binding affinity between strands of complementary sequences (probe to target) is affected by the degree of mismatching between the two sequences.
1.5 The Mouse Diversity Genotyping Array is a
high-throughput tool for the study of genetic variation in the
mouse
the mouse phylogeny37 and captures genetic variation in laboratory mice including the highly inbred classical and genetically diverse wild-derived mouse strains. Two distinct probe types, SNP probes and invariant genomic probes (IGP), were designed for SNP and CNV detection across the genus Mus. There are about 4.9 million SNP probes that target known SNPs at 623,124 loci across 8 mouse strains and about 1.8 million IGPs that target about 200,000 exons of genes37. A unique genomic position, or locus, is targeted by more than one probe to account for both the sense and antisense DNA strands and potential alleles (for SNPs). In aggregate, probes were designed such that genic sequences of exons for CNV detection and sequences containing SNPs for SNP detection can be targeted. Probes cover the genome across all chromosomes with even distribution.
All probes on the MDGA have 25mer sequences that target sample DNA sequences based on complementary base pairing36,37. The probes are designed such that the probe
and target DNA sequences hybridize with high specificity. High specificity refers to more specific binding i.e., probe sequences hybridize more readily to complementary target sequences when there is no mismatch in base pairs. The ability to call SNP genotypes and CNVs depends on successful hybridization between probe-to-target DNA from samples of interest. DNA with base pair mismatches to the probe sequence are less likely to bind to the probes and remain bound as stable duplexes36. Only duplexes formed between probe-to-target DNA are observable for SNP and CNV analysis.
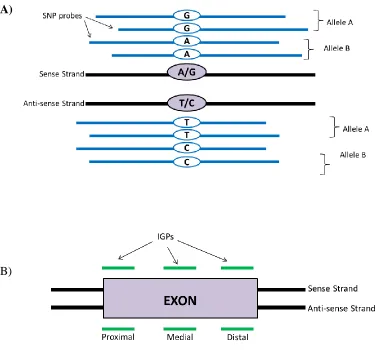
SNP probes exist in sets of eight that target a single SNP locus (Figure 1)37. At each SNP locus, the probes are capable of detecting one of two possible alleles, designated as allele A or allele B. A SNP probe set is comprised of four probes targeting the SNP locus on the sense strand and four probes targeting the SNP locus on the antisense strand. Of the four probes designed for each strand, two probes target the first possible allele (allele A) and two probes target the second possible allele (allele B) at a known position. The four SNP probes on each strand differ in the one base at the SNP location that can be either allele A or B. Despite targeting the same SNP alleles, two of the four SNP probes targeting each SNP allele can be offset by up 10 bp apart. SNP probes are designed to be redundant for more accurate SNP genotyping. Redundancy is achieved by having two identical probe sequences for each strand and for each allele and by having the probes slightly offset. SNP probes are useful not just for identifying SNPs, but also for CNV analysis. The redundancy in the SNP probes gives greater confidence in calls and is used in concert with IGP probes in CNV calling.
The MDGA also contains about 1.8 million IGPs devoid of SNPs that target 916,269 unique exonic regions in the mouse genome with two IGPs per exonic locus (Figure 1)37. IGPs were designed to target 93.4% of over 200,000 exons (Ensembl version 49). Since the mouse genome contains about 200,000 exons, the MDGA provides good coverage of the exons in the mouse40,41. Each exon is covered by three unique IGPs, one at each of the proximal, medial, and distal locations on both the sense and antisense strand of the exon. A total of 6 IGPs comprise an IGP set to target one exon and can be referred to as an IGP set. IGPs. All IGPs on the MDGA have the ability to detect CNVs as either deletions or duplications relative to the reference genome.
1.5.1 Elements of the experimental pipeline can affect false discovery
that can be computationally analyzed. Various algorithms use probe annotations, along with fluorescent intensity data for each probe, to assign genotypes at known SNP loci and call for putative CNVs. Issues with target DNA or probe adversely affect hybridization success
A)
B)
Figure 1 The Mouse Diversity Genotyping Array (MDGA) has two types of probes,
single nucleotide polymorphism (SNP) probes for SNP genotyping and invariant
genomic probes (IGPs) for copy number variation (CNV) calling. (A) SNP probes
each SNP allele can be offset by up to ten base pairs apart. (B) Invariant genomic probes (IGPs) target proximal, medial, and distal regions of the exons of genes along both sense and antisense strands. An IGP set consists of six IGPs that target a Mus exon.
and can lead to false discovery42.
Isolated DNA is hybridized to the MDGA probes
Four general steps are involved prior to hybridization: DNA extraction, restriction enzyme digestion, polymerase chain reaction (PCR), and fluorescent tagging of sample processed DNA. DNA extraction kits with standardized protocols for optimal yields of pure, uncontaminated DNA are commonly used. However, certain tissues may require more DNA purification steps to remove higher levels of tissue-specific contaminants, such as proteins, lipids, and RNA. If protein-removal is ineffective, sample DNA is unable to undergo restriction enzyme digestion – important for complexity reduction of the genome prior to hybridization. Optimally-sized DNA fragments are amplified and fluorescently tagged such that hybridization of the DNA to a probe results in emission of fluorescence. The fluorescence associated with each probe depends on the amount of target DNA in the sample as well as the affinity between target and probe sequences. A scanner is then used to detect the relative fluorescent intensities at each array spot and the information is outputted as raw fluorescent intensity data in a file format called CEL.
SNP genotyping and CNV calling are carried out computationally using algorithms
Since the raw fluorescent intensities do not provide sufficient accuracy in identifying a SNP, a step called SNP genotype calling is performed. SNP genotyping involves applying the BRLMM-P algorithm to read each SNP location in the genome and estimating the SNP allele present (Affymetrix® Power Tools from the Affymetrix Genotyping Console™)43. In a diploid genome, each SNP is composed of two allele calls
group should look similar. If a SNP signal does not meet a high enough probability (normally a percentage of calls of over 90% to 97%) to cluster into one of the three genotype groups, it is discarded as a no call and in doing so, removes any ambiguous results that may arise from low quality DNA, poor hybridization, or poor chip quality32,43,44. A percent call is simply the number of SNP loci that are given a genotype call of AA, AB, or BB divided by the total number of SNP loci on the chip. Any errors associated with SNP probes or SNP probe to target DNA hybridization can affect percent calls and therefore false discovery rates.
1.6 Massively-parallel hybridization is successful under ideal
conditions
Conditions for hybridization directly influence the binding specificity between the target and probe sequences. Ideal conditions for hybridization are determined from the melting temperature (Tm) of a particular sequence where Tm is the melting temperature at which
half of the total number of DNA strands are free (single-stranded) and half are double-stranded (occupied)36. T
m depends on the length of the DNA sequence and its specific
nucleotide composition. The Tm is calculated based on the energy required to separate
hybridized strands of a sequence. High temperatures cause the dsDNA to dissociate and exist as two independent strands (the energy of all molecules is weaker)36. Ideal
conditions for a microarray hybridization are estimated from the Tm for the specific probe
and DNA sequences where hybridization between perfectly complementary sequences occurs favourably to create a significantly more thermodynamically stable duplex (compared to mismatched sequences)46.
Hybridization stringency refers to the extent to which hybridization between mismatched sequences can occur and is directly influenced by how strict hybridization conditions are set. Conditions are set to manipulate binding specificity between probe and target DNA42. High stringency conditions allow for more specific binding (i.e., binding between mismatched sequences is less favourable). However, if stringency conditions are too high, the probe cannot bind to its target readily because conditions are too demanding and if stringency conditions are too low, the probe is more likely to bind to target DNA that isn’t complementary (low specificity). Hybridization stringency is related to the purpose of hybridization. High stringency conditions are typical when highly specific binding between probe and target sequence bases is required such as when targeting particular DNA in the genome. However, low stringency conditions can be used when some sequence mismatch is expected, such as in the case of inter-organismal comparisons47,48.
which results in increased specificity i.e., binding to be more specific42,49. Conversely, low stringency conditions are achieved by decreasing temperature well below the Tm of
the DNA molecules or increasing salt concentrations (with salt referring to a saline solution that contains sodium chloride and sodium citrate).
Probe length is another factor that greatly influences hybridization. Longer probes hybridize to complementary target sequences under more stringent conditions while shorter probes hybridize optimally under less stringent conditions. It is therefore important that probes are designed to be similar in length and have a uniform Tm in order
to have a shared thermodynamic profile under which hybridization can occur42.
Differently sized probes that do not share the uniform Tm bind less specifically under the
given set of conditions. Lastly, the probe sequence itself affects specificity during hybridization. More G and C bases in a duplex result in a higher Tm because of the
increased number of hydrogen bonds between G and C bases relative to A and T bases. It is for this reason that probe design should aim to be homogenous with regards to the ratio of G and C to A and T bases across probes. Sequence features such as GC runs or mononucleotide repeats in some probes in a massively-parallel hybridization experiment will affect hybridization success of probe-to-target sequences.
The challenges of massively-parallel hybridization
by having more probes (probe density and redundancy), and PCR amplifying target sequences36,50.
Two sources of error can contribute to higher false positive and false negative errors in variant calls from microarray studies: 1) inaccurate probe design and probe annotations, and 2) incomplete protein removal during DNA isolation leaving target DNA inaccessible for hybridization to probes. Bioinformatics methods and software tools make it possible to computationally examine and better understand large sets of biological data to decrease false positive and false negative errors. First, probes not meeting design criteria along with incorrect probe annotations directly influence binding affinity between complementary target and probe sequences and lead to inaccurate variant calls. Second, high-quality, intact target DNA is necessary for successful hybridization. Isolation procedures that do not effectively remove proteins from protein-bound DNA may increase the likelihood for deletions because the DNA was unavailable for hybridization to the array. Inadequate DNA isolation can adversely affect hybridization success and reliability in array data. Computationally examining the two sources of error can reduce false positive and false negative rates known to plague variant calls.
1.6.1 First source of error: Flawed probe design and inaccurate annotations reduce
reliability and accuracy of variant calls
accuracy2,3. The results from these studies demonstrate the importance of assessing probe design specifications and associated annotations to increase reliability in variant calls. While MDGA SNP probes have been previously filtered to exclude poorly performing probes from SNP genotyping steps, IGPs on the MDGA have not2,3.
IGPs on the MDGA were designed to meet a specific set of criteria. Meeting probe design specifications and having accurate probe annotations are important for consistent hybridization success and more reliable CNV calls. Successful hybridization between probe sequences and target DNA are calculated based on multiple factors related to probe design. For example, calculation of the optimal temperature for hybridization to the MDGA is based on probe size of 25 nucleotides; inconsistent probe lengths decrease probe specificity and can result in altered hybridization success37. Similarly, reliable
CNV calls are only possible if probe annotations are correct i.e., probes annotated to incorrect genomic locations results in erroneous CNV calls.
Bioinformatics tools allow for probe annotation validation. Automating the process of examining large sets of data is possible through the use of programming languages such as Python to carry out specific tasks. In this case, MDGA probes can be computationally assessed based on specific inclusion and exclusion criteria to ensure suitability for hybridization to experimental target DNA, Probes meeting each inclusion and exclusion criterion are referred to as stringent probes and indicate optimal probe design for hybridization to target DNA.
1.6.2 Second source of error: Ineffective removal of proteins from target DNA may
result in a bias for deletions in microarray studies
adaptor ligation, PCR amplification, and fluorescent tagging) for hybridization to the array. Ultimately, the ability to accurately genotype SNPs and call CNVs is diminished4.
Chromatin state varies differs between cell and tissue types
Protein-bound DNA refers to DNA that exists in the nucleus in a highly compact structure with the help of proteins. Nuclear DNA is packaged into chromosomes that consist of DNA tightly wound around a small group of proteins called histones that support its structure. This compact DNA-protein complex is called chromatin and exhibits high stability due to the attraction between the negatively-charged DNA and positively-charged histones60. The extent to which DNA is associated with histones is
directly related to the state in which genomic DNA is packaged within a cell. There are two possible chromatin states within a cell: closed state (silent heterochromatin) and open state (active euchromatin). Heterochromatin is a very tightly packed form of DNA that is not being actively transcribed (inactive) and serves to protect the integrity of DNA. Heterochromatin is involved in gene regulation by silencing genes. Euchromatin is a lightly packed form of chromatin that is typically enriched in genes and is being actively transcribed (active). In this state, chromatin is unwound and temporarily displaced of histones for the DNA to be accessible to polymerases and other enzymes for cellular processes (i.e., transcription and replication).
Chromatin landscapes of open and closed DNA exists in tissue- and cell-type-specific ways to drive cell-specific genic expression over time55,56,61,62. DNA methylation in particular plays a major role in tightly regulating gene expression across tissues with some of the highest levels of DNA methylation being found in the mammalian brain56–
58,61. Global changes in chromatin accessibility to key players in DNA replication also
Tissue-specific characteristics can pose a challenge for DNA isolation and hybridization
Chromatin status, homogenous cell types (i.e., liver), and replicative status are known to affect hybridization to create tissue-specific biases in array data4. Inaccessible DNA that is highly-protein bound by histones can make it difficult for the complete removal of proteins during DNA purification and can effectively prevent target DNA from hybridizing to the array. A notable example is sperm whereby the majority of sperm chromatin exists in a closed state that can result in higher levels of protein-bound DNA and therefore inaccessible for hybridization63. Similarly, cerebellar tissue DNA is also highly protein-bound relative to the spleen and liver and may require more fine-tuning of the extraction protocol to ensure hybridization is possible4,54,61. Certain cell types or tissues may require more purification steps prior to hybridization. Brain tissue such as the cerebellum is protein- and lipid-rich – tissue-specific characteristics that can contaminate DNA64. The presence of high levels of nuclease that are typical of the spleen also need to be inactivated to ensure that the effects of nucleases in the DNA are reduced. While extraction protocols are meant to take into account the different levels of contamination, chromatin structure and other tissue-specific factors affecting DNA availability is unknown.
DNase I sensitivity assays, commonly used to map out chromatin accessibility across the genome, preferentially cleaves DNA at open, accessible sites called DNase I hypersensitive sites (DHSs). Chromatin structural changes occur at active gene loci and at regulatory elements to result in a more open chromatin structure, one that is involved in active transcription and also sensitive to DNase I59. DHSs in chromatin are used extensively to map out open and closed DNA regions across many organisms including the mouse52. DNase I sensitivity measures can be found as tracks, or downloadable annotation datasets, for various tissues and cell lines in the mouse (curated by the Encyclopedia of DNA Elements (ENCODE) Consortium)66.
Since it is not possible to assess the effectiveness of DNA preparation protocols in externally sourced data arising from past experiments, bioinformatics tools can be used to assess experimental putative CNV calls. CNV calls can be compared to known tissue-specific landscapes of open and closed DNA. While this would be a tedious task if done manually, software programs and writing in-house code can allow a biologist to work with and examine large sets of genome-wide data. A post-hoc assessment of data arising from a microarray experiment can allow for the identification of any potential inconsistencies in data arising from inaccessible DNA.
1.7 Cross-species application of microarrays allows for the
study of genetic variation of non-model organisms
Unsequenced genomes and understudied non-model species are difficult to examine because of a lack of genomic resources (i.e., gene or variant databases) and technologies, and high costs for genome sequencing and annotation. Alternative methods to study non-model genomes are necessary, such as the application of SNP arrays across species for both CNV and SNP study and referred to as cross-species hybridization.
1.7.1 SNP arrays can be useful for cross-species applications
Successful cross-species hybridization for the identification of SNPs is reported in literature, especially for closely-related species (less than 3 million years of divergence)67,68. For example, cross-species application of bovine and ovine SNP arrays
in bighorn and thinhorn sheep, respectively67,69. Cross-species amplification has been demonstrated to be successful when using medium density or higher SNP arrays (50,000+ markers) in closely-related non-model species. Cross-species hybridization for SNP genotyping can also generate a large number of markers with relatively low cost per locus. However, a major limitation of cross-species amplification is the phylogenetic distance between species. The ability to identify SNPs cross-species diminishes greatly with increased phylogenetic distance, where the proportion of polymorphic SNPs exponentially decreases with phylogenetic distance, dropping to around 5% for species that have diverged 3 million years ago (mya)70. This poses a problem for researchers
studying distantly-related species for which technologies are lacking.
Cross-species hybridization to phylogenetically divergent taxa has led to varying levels of success. One study generated different percentages of calls and numbers of polymorphic loci across taxa by applying an equine SNP array to wild relatives of the horse such as zebras, asses, tapirs, and rhinoceros71. High-density bovine arrays have
been successfully applied in more distantly related species such as the antelope (divergence of 24 mya) and deer (divergence of up to 30 million years) to identify about 150 and 1050 polymorphic SNPs of ~54,000 SNP loci present in the bovine genome72,73. Estimation of evolutionary relationships among higher ruminants such as deer and giraffes (up to 29 million years of divergence) was also possible by using a bovine SNP array72,73. One particular study genotyped 678 higher ruminants representing 61 species and demonstrated success in resolving phylogeny for the diverse group of species based on almost 41,000 genome-wide cross-amplifying SNPs74. Furthermore, cross-species hybridization using ancient DNA from an extinct species was also demonstrated74. Lastly, cross-species hybridization of the canine array to 24 Antarctic fur seal individuals (Arctocephalus gazella; 44 million years of divergence) generated 173 SNPs (0.5% of canine SNP loci) that harbor highly conserved genomic regions75.
first studies of CNV in primates and was routinely carried out over the last decade. Specifically, microarrays designed for the human genome were used to identify the first putative sites of CNV in great apes such as the chimpanzee, gorilla, bonobo, orangutan, and rhesus macaque79–83.
1.7.2 The naked mole-rat as a candidate for cross-species hybridization of the Mouse
Diversity Genotyping Array
The naked mole-rat is a valuable non-model organism to study for several unique characteristics in biology, genetics, and population structure. Though the naked mole-rat is similar in size to the mouse (27-30 grams), it is the longest lived rodent with a lifespan of 32 years compared to just three to five years for the mouse84. The naked mole-rat lives five times longer than predicted based on body size, similar to that of a human85. The
naked mole-rat is the first reported mammal that does not undergo typical mammalian aging and susceptibility to disease because good health is maintained for at least 66% of its life (the equivalent of an 80 year old human showing a biological age of 30)86,87. The
naked mole-rat also exhibits resistance to tumors, in stark contrast to the majority of laboratory mice (C57BL/6J) that die of cancer and show lesions and small non-lethal tumors87–89. The subterranean burrowing rodent is native to the eastern horn of Africa and exhibits unique adaptations to its dark, hypoxic environment rich in carbon monoxide and ammonia. The naked mole-rat shows extremely high levels of inbreeding and is also one of only two known eusocial mammals. Eusocial mammals, like bees and other social insects, live in colonies of 75-300 individuals. Each colony consists of a single breeding female and one to three breeding males with the remaining members being sterile workers that carry out communal tasks such as food collection and tunnel excavation. Once the queen dies, a sterile female becomes the queen by losing her sterility90.
one male and one female naked mole-rat. Initial genomic analyses suggest a low mutation rate due to a reduced level of polymorphisms found in the naked mole-rat84,91. Furthermore, 93% of the naked mole-rat genome shows synteny to human, mouse, or rat genomes and thus, allows for this species of interest to be studied alongside classical laboratory mouse and human in a comparative manner84. A recent study suggests that 88% of human genes (about 17,000 genes) have a naked mole-rat ortholog92. The naked mole-rat is predicted to have 22,561 genes – comparable to other mammals such as the human (22,389), mouse (23,317), and rat (22,841) genomes5,21,84.
1.7.3 Probes on the array may be suitable for cross-species hybridization
The cross-species application of arrays necessitates the consideration of whether the array probes themselves are suitable for hybridization to DNA from a species of interest. While cross-species hybridization can be carried out for unsequenced species (i.e., canine array for seals) or for species that are already sequenced (human array for chimpanzees), it is unknown whether the MDGA has practical utility for cross-species hybridization in a previously sequenced distant species – the naked mole-rat. Predicting the potential for probes on the MDGA to interrogate naked mole-rat samples can be carried out by aligning the probe sequences to similar sequences in the naked mole-rat reference genomes. There are currently two fully sequenced reference genomes – one male (build 1) and one female (build 2) – of the naked mole-rat (via whole-genome shotgun assembly). Since sequencing methods cannot read the entire genome at one time, small sequence fragments are read one at a time and then assembled and linked together into a scaffold (with occasional gaps). Not all genomes are created equally; the naked mole-rat assemblies are much lower in quality than the mouse genome which is expected since the scaffolds are yet to be mapped to physical locations in the two genomes. Scaffolds are associated with chromosomes but exact positional information by chromosome has not been determined.
secondly, a lack of appropriate CNV probes make cross-species hybridization difficult70. SNP probes on the MDGA are variable in nature (sites of polymorphism) and are less likely to be conserved cross-species. IGPs on the other hand are expected to be conserved due to the targeting of almost all known invariant exons in the mouse though not for CNV calling.
CNV detection in the naked mole-rat genome is unlikely due to the lack of appropriate IGPs. However, the MDGA by virtue of its IGP design and high number of targeted loci, may be useful cross-species hybridization. The IGPs are designed such that highly conserved exons of genes (invariant genomic regions) can be interrogated and a subset of the IGPs are known to cover ultraconserved regions. The probes are also designed to capture maximum diversity present in mice from the C57BL/6J to wild-caught mice and therefore diverse genomes of the mouse are represented (reduces bias in probe sequences). Furthermore, because the IGPs cover almost all of the exons in the mouse genome (about 20,000 genes) and represent varying levels of evolutionary conservation, the IGPs have unbiased coverage of genes, some of which may exist in phylogenetically distant organisms such as the naked mole-rat.
1.8 Central goal and specific objectives
Central goal: The massively-parallel hybridization of Mouse Diversity Genotyping
Array probes to target DNA is error-prone. Bioinformatics methods will be used to validate whether probes on the array are well designed such that high hybridization success to sample DNA is expected, that sample DNA is accessible for DNA to probe hybridization, and that the Mouse Diversity Genotyping Array is conducive to cross-species hybridization.
Objective 1) To computationally assess Mouse Diversity Genotyping Array probe annotations based on probe design criteria such that only appropriately designed probes with accurate probe annotations are used for reliable SNP genotyping and CNV calling.
Objective 2) To conduct a post-hoc examination of the association between detected CNVs and regions of known closed DNA such that deletions preferentially located within closed regions are predicted to be protein bound and unavailable for hybridization.
Objective 3) To predict the theoretical ability of the Mouse Diversity Genotyping
Chapter 2 Materials and Methods
2.1 Assessment of probe suitability and annotation accuracy
for hybridization to target mouse DNA
Original IGP annotation files were downloaded from the Center for Genome Dynamics website (http://cgd.jax.org/datasets/diversityarray/CELfiles.shtml). A previously filtered list of SNP probe annotations was obtained for further validation2,3. A total of 1,195,516 IGP annotations targeting 597,758 unique exonic loci and 523,322 SNP probe annotations for each unique SNP locus were compiled to Microsoft Excel. Computational assessment of probe annotations based on probe design criteria was carried out using in-house script written in Python (programming language) coupled with a local blasting program called BLAST+ and build 37 of the mouse genome database (UCSC:mm9). BLAST+ allows for the comparison of biological sequences and provides data on regions of similarity between the sequences. Specifically, an algorithm called Basic Local Alignment Search Tool (BLAST) was used to compare a query sequence to the sequences found within a database of sequences (i.e., mouse reference genome). BLAST results identify sequences within the database that share sequence identity with the query sequence above a certain statistical threshold. The BLAST+ executable program was downloaded from the National Centre for Biotechnology Information (NCBI) website (https://blast.ncbi.nlm.nih.gov/Blast.cgi?PAGE_TYPE=BlastDocs&DOC_TYPE=Downl oad). The mouse genome database (build 37) was downloaded in FASTA format, a commonly used text-based format containing sequence data (nucleotides) available at https://hgdownload.cse.ucsc.edu/goldenPath/mm9/chromosomes/.
IGPs were determined to be suitable for subsequent analyses if design specifications detailed by Yang et al. were met37. IGP annotations were assessed based on four of the
criteria were computationally confirmed: 1) the SNP allele being interrogated by each probe must be consistent with the indicated SNP allele, and 2) the SNP allele must also be positioned at the correct base pair location in the probe sequence as indicated in the annotation file by Yang et al.37.
The in-house script was written such that each line of the probe list was sorted if specified criteria were met. Each probe annotation that did not meet the criteria was separated into a separate file. Probe annotations that did meet criteria were then compiled into a secondary list for local BLAST. A second script was written to call for the function “blastn” from the BLAST+ executable program that utilizes the NCBI C++ Toolkit. Local BLAST was performed against downloaded mouse genome database (build 37). A Windows command line function called “makeblastdb” was called to generate a local database of the mouse genome that the “blastn” function could access. The script read the annotated probe list in as input, the “blastn”function carried out alignment of each probe sequence against the mouse genome, and the probe annotations meeting specified criteria were recorded to an excel file as output.
2.2 Mapping copy number variant regions alongside DNase I
sensitive regions across the genome
CNV calls derived from four different tissues across two sets of samples were obtained for analysis: a reference set (Jackson Laboratory) and an in-house experimental set (Hill Laboratory)1,93,94. CNV calls across both the reference and in-house experimental sets were determined based on well performing, stringent probes that meet design specifications as outlined by Yang et al. and target 496,900 SNP loci and 435,167 unique exonic regions1,37,94. CNV data from the mitochondria and chromosome Y were excluded
because of a relatively low number of probes that exist to target sequences on Mus chromosomes Y and MT (mitochondrial DNA). CNV data from chromosome X and Y were not available at the time of study.
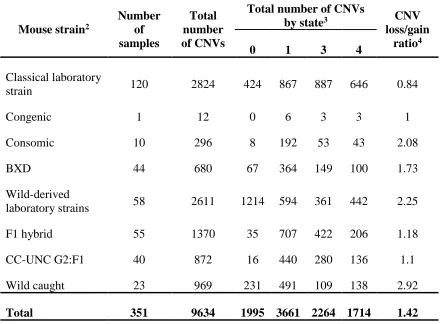
Table 2.1 Copy number variant (CNV) data from a publically available reference
sample set of 351 mouse tail samples1
Mouse strain2
Number of samples
Total number of CNVs
Total number of CNVs
by state3 CNV
loss/gain ratio4
0 1 3 4
Classical laboratory
strain 120 2824 424 867 887 646 0.84
Congenic 1 12 0 6 3 3 1
Consomic 10 296 8 192 53 43 2.08
BXD 44 680 67 364 149 100 1.73
Wild-derived
laboratory strains 58 2611 1214 594 361 442 2.25
F1 hybrid 55 1370 35 707 422 206 1.18
CC-UNC G2:F1 40 872 16 440 280 136 1.1
Wild caught 23 969 231 491 109 138 2.92
Total 351 9634 1995 3661 2264 1714 1.42
1Copy number variant calls were published by Locke et al. and discovered using
publically available Mouse Diversity Genotyping Array data1. Mouse Diversity
Genotyping Array CEL files were downloaded from the Center for Genome Dynamics at the Jackson Laboratory (http://cgd.jax.org/datasets/diversityarray/CELfiles.shtml).
2Mouse strains describe the genetic background of 351 mouse tail samples previously
hybridized by the Jackson Laboratory to the Mouse Diversity Genotyping Array.
3CNVs are classified by state as either deletions (copy number state of 0 or 1) or
duplications (copy number state of 3 or 4).
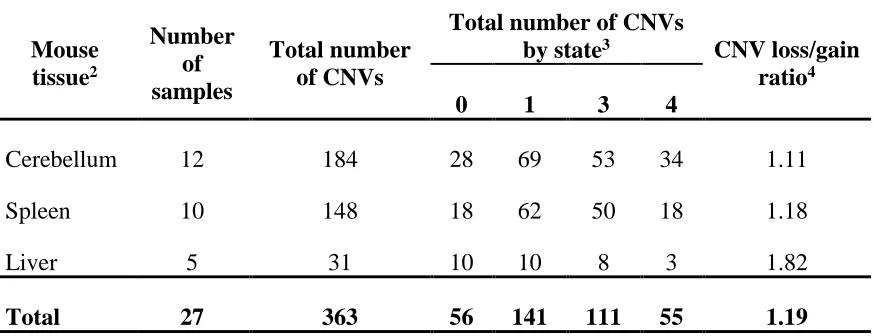
The Hill sample set consists of CNV calls from 12 cerebellum, 5 liver, and 10 spleen tissue samples (Table 2.2)3,94. The samples include replicates of the same tissue from the same mouse, as well as multiple tissue types from the same mouse and were obtained for the study of somatic CNVs. All mouse tissue samples were derived from adult mice ranging in age from 4.4 months to 11.4 months with either CBA/CaJ (8 mice) or C57BL/6J (2 mice) mouse strain background. A total of 363 putative autosomal CNVs were called with a deletion to duplication ratio of 1.19:1. Total number of CNVs by tissue type are as follows: 184 (cerebellum), 31 (liver), 148 (spleen) with loss to gain ratios of 1.11, 1.82, and 1.18 for each tissue respectively.
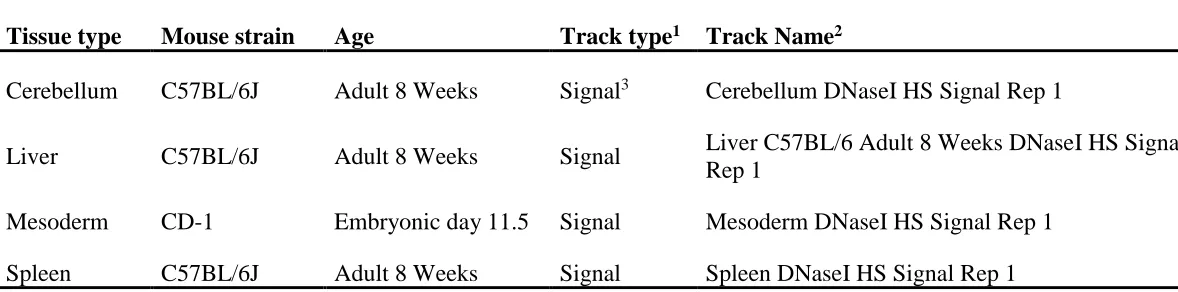
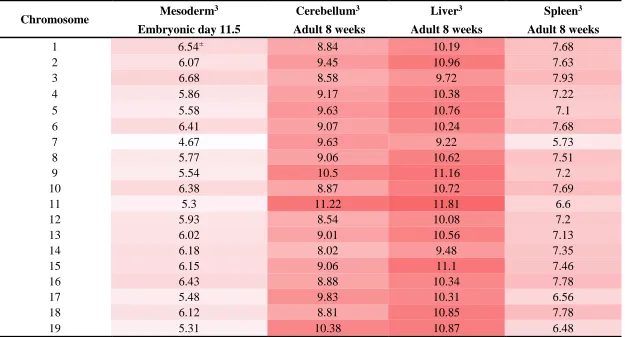
To determine probable open and closed areas of DNA across the genome, annotations for DNase I hypersensitive regions across four tissues were obtained (Table 2.3). The genomic intervals for DNase I sensitivity signals across the mesoderm, cerebellum, liver, and spleen were found as annotation tracks on UCSC Genome Browser (http://genome.ucsc.edu/cgi-bin/hgFileUi?db=mm9&g=wgEncodeUwDNase). DNase I sensitivity measures for the cerebellum, liver, and spleen were derived from adult C57BL/6J mice at 8 weeks of age while measures for the mesoderm tissue were derived from a mice of CD-1 background at embryonic day 11.551,66. The cerebellum, liver, mesoderm, and spleen tissues were chosen for their comparability to the cerebellum, liver, tail, and spleen tissues used for CNV detection in previous studies.
Original signal annotation tracks were available in BigWig format, an indexed binary file format that allows for the display of dense, continuous data that can be displayed from the Genome Browser as a graph. The tracks are annotation files containing measures (signals) of DNase I sensitivity. Signal tracks in BigWig format were simplified to wiggle (wig) format using a conversion program called bigWigToWig from UCSC available from the directory of binary utilities at http://hgdownload.cse.ucsc.edu/admin/exe/. The wig files were then converted to annotation tracks in BED format using an open sourced Linux-based genomic toolset called BEDOPS (v2.4.14)95. An annotation track in BED
position (chromStart), and end position (chromEnd). The resulting BED files were then used as data
Table 2.2 Copy number variant (CNV) data for an in-house sample set derived
from three mouse tissues1
Mouse tissue2
Number of samples
Total number of CNVs
Total number of CNVs
by state3 CNV loss/gain
ratio4
0 1 3 4
Cerebellum 12 184 28 69 53 34 1.11
Spleen 10 148 18 62 50 18 1.18
Liver 5 31 10 10 8 3 1.82
Total 27 363 56 141 111 55 1.19
1CNV calls were obtained from the Hill Laboratory (Milojevic, unpublished).
2Mouse tissue samples include replicates of the same tissue from the same mouse as well
as multiple tissue types from the same mouse. Tissue samples were taken from adult mice ranging in age from 4.4 months to 11.4 months with a genetic background of either CBA/CaJ (8 mice) or C57BL/6J (2 mice).
3CNVs are classified by state as either deletions (copy number state of 0 or 1) or
duplications (copy number state of 3 or 4).
Table 2.3 Previously published DNase I accessibility data for mouse tissues exist as tracks
Tissue type Mouse strain Age Track type1 Track Name2
Cerebellum C57BL/6J Adult 8 Weeks Signal3 Cerebellum DNaseI HS Signal Rep 1
Liver C57BL/6J Adult 8 Weeks Signal Liver C57BL/6 Adult 8 Weeks DNaseI HS Signal Rep 1
Mesoderm CD-1 Embryonic day 11.5 Signal Mesoderm DNaseI HS Signal Rep 1
Spleen C57BL/6J Adult 8 Weeks Signal Spleen DNaseI HS Signal Rep 1
1DNase I sensitivity signal annotation tracks curated by the ENCODE Consortium were downloaded from the University of
California, Santa Cruz (UCSC) Genome Browser (http://genome.ucsc.edu/cgi-bin/hgFileUi?db=mm9&g=wgEncodeUwDNase)66.
2Tracks exist as three types of sequence data: Hotspots, Peaks, and Signals.
containing DNase I accessible, or open regions across the genomes of four tissues. Custom annotation tracks representing genomic intervals of CNV regions were created for each tissue type. To determine the degree of overlap between DNase I sensitive and CNV regions of the genome by tissue type, an open-source Linux-based genomic arithmetic software called BEDTools (v2.18) was used96.
To generate BED files of genomic intervals of DNase I inaccessible, or closed DNA, the inverse of the DNase I accessible intervals was found using the “complement” function on BEDTools. All complements were based on chromosomal start and end positions from NCBI’s build 37 of Mus musculus (UCSC:mm9). The complemented BED files representing genomic intervals of closed DNA for each tissue type were compared with the genomic intervals of the CNV regions from each tissue. The BEDTools “intersect” function was used to enumerate each and every intersection between the two sets of genomic intervals to determine degree of overlap between the CNVs and closed DNA. Only the autosomal genome (chromosomes 1-19) was considered for the analyses. Output files containing intersection data between genomic intervals of closed DNA and CNV regions by tissue type were obtained and analyzed for degree of overlap.
subtracted from the union of all tissues. The process was repeated for each tissue of interest to determine tissue-specific closed and open DNA.
2.4 Compiling a list of stringent probes suitable for
cross-species hybridization
Probes predicted to be suitable for cross-species hybridization were determined by BLAST, or aligning the probe sequences to similar sequences in two reference naked mole-rat genomes (Table 2.4). All probe sequences were BLAST searched against each existing naked mole-rat genome build (1 and 2) that was downloaded from the NCBI FTP server (ftp://ftp.ncbi.nlm.nih.gov/genomes/Heterocephalus_glaber/). The script was written such that BLAST results of probe sequences complementing without mismatch to one unique locus in the naked mole-rat were recorded to one output file and probe sequences complementary to more than one locus were recorded to a second output file. All other BLAST results were excluded.
A probe was considered to be complementary to the naked mole-rat genome if all 25 nucleotides of the probe sequence aligned perfectly with complementarity (with no mismatch in nucleotides) to a sequence in the naked mole-rat genome. Any probe sequences found to align to more than one locus in one genome build would result in competition for probe-DNA hybridization and were thus excluded from a stringent list of probes targeting unique loci only. Probes found to be complementary without mismatch to sequences in both genome builds were compiled as a list of probes that theoretically should be able to reliably hybridize to naked mole-rat genomes (in the absence of genetic variation or de novo mutations) with high hybridization success.
Table 2.4 Two naked mole-rat reference genome builds were used to predict
hybridization between Mouse Diversity Genotyping Array (MDGA) probes and
naked mole-rat samples
Genome Assembly1 Build 12 Build 23
Name of genome build
HetGla_1.0, USCS name: BGI HetGla_1.0
HetGla_female_1.0, UCSC name: hetGla2
Submitter Beijing Genomics Institute Broad Institute
Scaffolds 39267 4229
Scaffold N50 1.6 Mb 20 Mb
Number of contigs 273990 114653
Contig N50 21750 47778
Predicted genes 30743 30876
Predicted proteins 41963 34892
Size (Mb) 2643.96 2618.2
1Naked mole-rat genome assemblies (build 1 and build 2) were downloaded from the
National Centre for Biotechnology Informatics (NCBI) FTP server: ftp://ftp.ncbi.nlm.nih.gov/genomes/Heterocephalus_glaber/.
2Build 1 was released by Kim et al.84.
2.5 Determining sequence-specific biological functions of
probe targets complementary to the naked mole-rat
genome
Since no comprehensive database of known exons or genes exists for the naked mole-rat and since there is potential for exonic regions in the mouse to be conserved in the naked mole-rat, all probe sequences complementary to the naked mole-rat genome were examined for functional attributes using the existing annotated mouse genome. Annotations for mouse genes and exons based on NCBI’s build 37 of the mouse genome were downloaded from the archives (release 67) of an open-source genomic database called Ensembl BioMart (http://www.ensembl.org/info/website/archives/index.html). Probes on the array were designed to interrogate these genes and exons annotated by the Ensembl group.
Annotations for the stringent probe list and annotations for the gene and exon lists were compiled to generate BED files for use on BEDTools. All probe annotations were assessed for overlap with the annotations of mouse genes and exons on their respective chromosomes using the “intersect” function. All probe sequences were also mapped along NCBI’s build 37 of the mouse genome (UCSC:mm9) to ascertain their distances in nucleotides to proximal genes, upstream or downstream, using a function called “closest”. Output from BEDTools was converted to Excel format for examination of the overlapping and proximal genes and exons.
Diseases and biological functions that were overrepresented in genes of interest were determined. Specifically, genes in each list were grouped into disease and biological function networks using QIAGEN’s Ingenuity Pathway Analysis’ Core Analysis [IPA®, QIAGEN Redwood City, CA]. Focus Genes (or Focus Molecules) are those genes from the two gene lists that pass filters and have potential to be linked to other genes as part of a gene network. Direct and indirect relationships with a maximum of 35 Focus Molecules per network were included. Pseudogenes were also included. Molecule relationships with endogenous chemicals were excluded. Networks included for analysis were those networks that have a score of two or higher with a score of two reflecting a 99% confidence of not being generated by random chance alone. This score is based on a p-value of 0.05 from a Fisher’s Exact Test.
The Ensembl genes that are targeted by the MDGA probes can be associated with variation. The predicted effect of the variants is listed as a SNP class function (i.e., missense change). All genes found to overlap with SNP probes and predicted to have nonsynonymous effects were manually examined using Ensembl’s gene search function and researching the Mouse Genome Informatics (MGI) international database (accessible at http://www.informatics.jax.org/).