Profiled Model Based Power Simulator
for Side Channel Evaluation
Nicolas Debande1,2, Ma¨el Berthier1, Yves Bocktaels1 and Thanh-Ha Le1
1 Morpho
18 chauss´ee Jules C´esar, 95520 Osny, France
[email protected] 2 TELECOM ParisTech
46 rue Barrault F-75634 Paris Cedex 13, France
Abstract
An embedded cryptographic device performs operation on sensi-tive data and as such, is vulnerable to side-channel attacks. This forces smart-card manufacturers to carefully consider development of security mechanisms. To accelerate this procedure, the use of power and elec-tromagnetic simulator can be relevant and saves non negligible time. Based on a high level simulator, we propose to use profiled abstract models to gain accuracy on the simulated traces. These abstract mod-els are obtained by profiling some parts of the target device which is physically available by the evaluator.
keyword: Smart Cards, Power Simulation, Side Channel Analysis,
Se-curity Evaluation.
1
Introduction
observed from the power consumption, the electromagnetic emanation or even in the time execution of the device. Also, this context allows the at-tacker to inject faults on the chip, which perturbs the correct behaviour of the device. The efficiency of these attacks combined with the amount of embedded device users implies the interest of the smart-card designers, smart-card manufacturers, certification centres and research laboratories to this subject. Indeed, a better knowledge of these physical attacks leads to a better evaluation of the vulnerability or robustness of a device against Side Channel attacks. Thus, a lot of countermeasures have been worked out in order to secure embedded devices from these attacks. Companies in the embedded systems sector are concerned by these security questions, and have to guarantee information security on their products which ensures information confidentiality or impossibility of reproduction,etc.
A way to evaluate the security of an embedded device is to attack it. Indeed, the more efficient the attack, the less secured the device. Besides having a good knowledge about SCA, to perform an attack requires an amount of data curves, acquired from a physical device or from a simulator. In the first case, the attacked device has to be in a post-conception step,
i.e. the device is ready to be sold (except the security validation), in order to have relevant and realistic results. Indeed, the companies want to test a device as near as possible than the final product. This is a non-negligible constraint. When an software information leakage is found, developers in-clude suitable countermeasures and load the new code on the device. If the leakage comes from a hardware weakness, then the smart-card manu-facturers have to patch the device before a security test is performed again. The use of a power consumption (or electromagnetic emanation) simulator is motivated by a gain of speed in the security evaluation. However, this method is naturally less realistic than with real physical device.
To generate power consumption of a device while executing an operation (e.g. an encryption) requires the knowledge of the hardware design. Indeed, power consumption is deduced from the number of transistors used by the device at each instant.
The simulator allows to evaluate the device robustness for various leakage models. Also, it can be used to deduce, from a given model, a new model according to a code revising or a countermeasure adding. Additionally, there is many approaches for the combination of the high level simulator with the low level simulator. The high level simulator can take as inputs the curves simulated by the low level simulator, in order to characterize a leakage model. This model will be used to speed up the next simulation processing. Another way to combine the two tools is to simulate a part of the device with one simulator and another part of the device with the other. The simulated curves will be construct according to some countermeasures, selected by the user (noise, temporal warping, etc. ). The simulator aims at approaching as better as possible the effect of a given countermeasure, in order to better predict its consequences. Also, the high level simulation is light and fast, being suitable to generate training sets for academic purpose, especially when no acquisition equipment is available.
In this paper, we considered attacks which exploit power consumption. The introduced simulator aims at being a high level (or abstract level) plat-form for evaluation of SCA vulnerability for embedded device.
We recall some existing simulators in Sec. 2. Then the simulator is introduced in Sec. 3. The profiling phase and the pattern reconstruction are described in Sec. 4 and Sec. 5 respectively. At last, some experimental results are described in Sec. 6.
2
Previous Work
Sec. 2.1 shows several power simulators from the state of the art. Sec. 2.2 recalls some mathematical backgrounds about the stochastic methods.
2.1 Simulation
NanoSim is a transistor-level power simulator developed for CMOS and BiCMOS circuit designs [9]. Transistor-level is the lowest possible level. NanoSim contains also some analysis tools. However, the main goal of Nanosim is to help designers for lower power but cannot works with high level models so, it is not suitable for side channel analysis.
PINPAS (Program INferred Power Analysis in Software), developed by the Eindhoven University of Technology and TNO-TPD in 2004, is a tool which permit to generate power curves without physical device (see [5]). The algorithm can also be chosen (DES, IDEA, etc) and even different hardware implementation. However, PINPAS needs to know the hardware design and the assembler code to work.
SCARD (Side Channel Analysis Resistant Design flow) is a tool which aims to simulate side channel analysis effects, developed in 2005 [1]. This tool proposes to evaluate the efficiency of a given countermeasure by at-tacking the virtual device with the generated curves and with side channel analysis. The distinctive characteristic of SCARD is that it already includes an approach about high level simulation.
MP-ARM is a simulation platform for MP-SoC (Multi-Processor Systems-on-Chip) based on SystemC (see [3]). This tool aims to ease the design step of a MP-SoC. Its includes processor models, memory models and some other pratical tools.
SystemC is used to describe material at a high level [2]. This permits to simulate systems with a very high speed. However, it is only suitable for functionality check and not for secret information leakages.
More recently, Thuillet et al. [10] introduced a high level simulator which allows to construct traces without the knowledge of hardware design. Based on a software code, the simulator compute all states for all regis-ters. Then, power consumption traces are deduced from these states using abstract models as the Hamming distance.
2.2 Stochastic Models
Stochastic model has been introduced by Schindleret al. in [8]. It allows to profile the power consumption or electromagnetic emanation behaviour of a device. Let’s assume that the device’s activity is expressed as:
C(t) =β0(t) + n X
i=1
βi(t)fi, (1)
where fi are n chosen functions and C(t) is an estimation of the power
model a register r, during the storage process, then fi could be a function of S0, the initial state of rand S1, the final state of r. In this case, profiling
step aims at computing weighting curvesβidepending on all bits of aN-bits
registerr and an additional weighting curveβ0 which models the rest of the
circuit. The chosen function can be:
• n= 1, Hamming weight of S0⊕S1 • n=N,fi is theith bit of S0⊕S1
• ...
Note: The choice of fi can be different between profiling and
estimat-ing. Indeed, a countermeasure can be simulate by a suitable choice of fi
functions. For example, we can simulate a balanced power consumption or electromagnetic emanation by chosenfi such as:
fi=
1 if HW(S0⊕S1)i = 1
0.9 if HW(S0⊕S1)i = 0
where HW(S0⊕S1)i isith bit of the Hamming weight of S0⊕S1.
When averaged activity has been computed, the variance of the noise is characterized as follows:
v(t) = Var(C(t)−C˜(t)), (2)
whereC(t) and ˜C(t) are real and reconstructed traces respectively.
3
Description of the simulator
3.1 General Behaviour
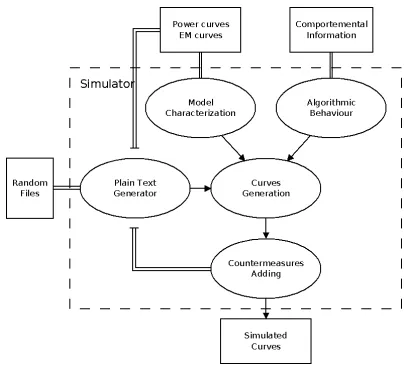
The global behaviour of the simulator is described in Fig. 1. For the char-acterization, we used the profiling phase introduced in [8]. Unlike template-based profiling [4], stochastic models allows to easily reconstruct traces, thanks to the linear regression. The characterization step is not dependent of cryptosystems and implementations, when profiling registers behaviour. Indeed, it takes on parameter only two successive states of a given register (for instance, S0 is a part of the plain text and S1 the corresponding part of
final model. If the profiling phase is applied on a single round, the profiled
βi are used on all the other rounds. In Equ. 1,β0 is useless and never saved
in our case. However, when computing the noise variance, we compute the averaged activity A which will be used to simulate new traces. Note that all linear regression methods, and more generally all profiling methods, can be used for the characterization step, as long as the traces reconstruction is available with the abstract models.
The ”‘Algorithmic Behaviour”’ part aims at providing intermediate states necessary for using previous profiled model. For instance, for using an ab-stract model which characterize the Hamming weight of a variable, the sim-ulator has to know all values of this variable. This part is similar than the work provided by Thuillet et al. [10]. Additionally, the evaluator can add functional information about leakages on other part of the device, as the noise generated by the clock or the hardware design of a specific coun-termeasure. This allows to combine information from different sources to construct a single trace.
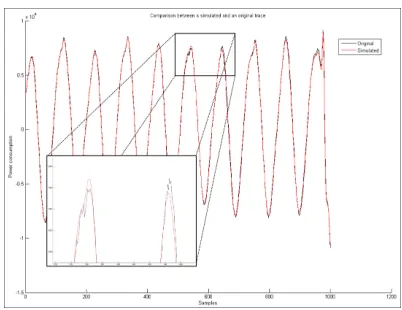
Fig. 2 shows an example of a simulated power consumption trace.
Figure 1: Conceptual model of the simulator
3.2 Objectives
Figure 2: Comparison between a real and a simulated power trace
This implies we cannot use this kind of simulator in pre-conception. This section clarifies the objectives of the high level simulator.
In the hardware context, we have a post-conception device and we char-acterize a cryptoprocessor (with an unknown design). If some leakages are found, one can wonder which hardware modifications could improve the de-vice’s robustness. It seems complex to predict any modifications directly on the characterized cryptoprocessor (e.g. to upgrade from unprotected to masking implementation). However, models can be used to simulate mod-ules adding such as noise or delay generator. The question is if stochastic models are useful to give good predictions on hypothetical hardware counter-measure adding. Hardware modules activity (as cryptoprocessors) depends strongly of the design and the used technology. Thus, even a perfect char-acterization of a hardware module could not lead to a realistic prediction.
4
Profiling Phase
This section describes how the profiling phase is computed. The profiling step allows to compute averaged power activity according to the chosen models. Hardware and software case are dealt within two different sections, Sec. 4.1 and Sec. 4.2 respectively. Then for both cases, the global averaged activityA(t) is computed as follows:
A(t) =E[C(t)−P(t)], (3)
where C(t) is the profiled traces andP(t) is the reconstructed profiled signal. The noise variance is modelled by computing:
v(t) = Var[C(t)−P(t)], (4)
4.1 The Hardware Case: cryptoprocessor
A first approach is to model a cryptoprocessor is to target state registers using an arbitrary leakage model. By using first-order stochastic model, we obtain as many weighting curves βi as bit register. Each βi represents the main activity of one bit, in function of the time. Then in Equ. 3, A is the averaged activity of the device. To improve the accuracy of the model, one can repeat the process. Indeed, when computing the βi for the first time, raw observations C(t) are used. With a second process, theβiare computed again, but using modified observationsg(C(t)) as follows:
g(C(t)) = C(t)−X j
β1j(t)fj =β0(t) + n X
i=1
βi2(t)fi, (5)
where theβk(t) are the models computed at thekth iteration.
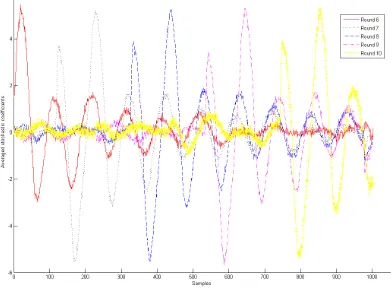
Figure 3: Influence of key bits on the model
Figure 4: Stochastic profiling applied on several rounds
4.2 The Software Case: microcontroller
step, we tried three ways to make partitions. First we focused only on the target register (without taking into account the other registers), as usually. However, this method cannot lead to a relevant characterization of the reg-ister. The reason is that partitions are strongly affected by other activity, especially caused by the opcode value. Second, we focused on the target register and the opcode register: we compute an averaged trace for each opcode, then subtract the corresponding pattern to data before partition-ing. Again, this failed. At last, by only focusing on the target register and according to a single opcode, we had relevant register’s model. Fig. 5 shows different bit activity.
Figure 5: Different shapes for a bit flipping activity
5
Pattern Reconstruction
Curves are generated using all the models as follows: ˜
C = ˜C0||C˜1||...||C˜p, (6)
where ˜Ci is ith cycle of the encryption. Each ˜Ci are in function of some
parameters, varying on the time (as intermediate values, operands, etc. ). They are defined as:
˜
Ci(t) =Ai(t) + n X
j=1
βj(t)fj. (7)
For instance, an hardware AES can be modelled with:
˜
Ci(t) =Ai(t) + 128
X
j=1
β1,j(t)f1,j(S0i,S1i) + 128
X
j=1
with
f1,j(S0i,S1i) = S0i(j)⊕S1i(j) and f2,j(S1i) = S1i(j),
where S0i(j) is the jth bit of the state S0.
6
Experimental Results
This section provide some experiments using the high level simulator. Sec. 6.1 discuss about the number of traces needed to obtain a model sufficiently ac-curate. Then, we compare simulated traces with acquired ones is Sec. 6.3.
6.1 Quality of the obtained stochastic models
In order to evaluate the quality of our simulation method, we compare the efficiency of standard SCA attacks on simulated sets and experimental ac-quired sets. As a metric, we used the success rate of the attacks. Fig. 6 shows success rates of CPA on an acquired set and several simulated sets, according to the number of traces used to construct the stochastic models. As expected, success rate is very sensitive to the size of used set. Further-more, we can see that, comparing to the real traces, it is easier to attack with CPA on simulated traces when the model is sufficiently accurate (i.e.
when computed with a sufficient number of traces).
6.2 Effect of several iterations during the profiling step
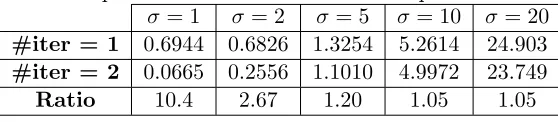
As mentionned in Sec. 4.1, the evaluator can repeat the profiling process using Equ. 5 in order to obtain more accurate models. In this section, we compare profiled models using one and two iterations. We simulate an amount of 10000 traces by fixing manually the βi values and the standard deviation of Gaussian noise. As metric, we compute the square distance between the fixed βi and profiled ones. Tab. 1 shows the results for five
different noise level. Clearly, we see that the efficiency of the second process highly depends on the standard deviation of the noise. With a low level, the abstract models can significantly be improved with an extra iteration, while it practically has no effect when the noise is too high.
Table 1: Square distances between real and profiled models
σ= 1 σ = 2 σ= 5 σ = 10 σ = 20
#iter = 1 0.6944 0.6826 1.3254 5.2614 24.903
#iter = 2 0.0665 0.2556 1.1010 4.9972 23.749
Ratio 10.4 2.67 1.20 1.05 1.05
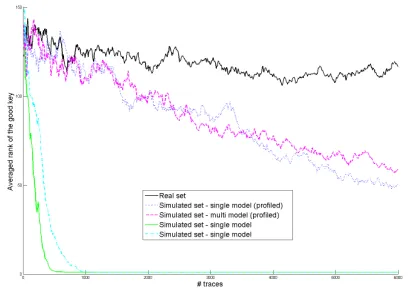
6.3 Comparison with acquired traces
and so favour the CPA attack.
Figure 7: CPA guessing entropy using Hamming Distance model
Figure 8: CPA guessing entropy using Hamming Weight model
7
conclusion
References
[1] M. J. Aigner, S. Mangard, F. Menichelli, R. Menicocci, M. Olivieri, T. Popp, G. Scotti, and A. Trifiletti. Side channel analysis resistant design flow. InISCAS. IEEE, 2006.
[2] D. Automation. Ieee standard systemc language reference manual.
IEEE Computer Society, 2002(March):1666–2005, 2006.
[3] L. Benini, D. Bertozzi, A. Bogliolo, F. Menichelli, and M. Olivieri. Mparm: Exploring the multi-processor soc design space with systemc.
VLSI Signal Processing, 41(2):169–182, 2005.
[4] S. Chari, J. R. Rao, and P. Rohatgi. Template attacks. In B. S. K. Jr., C¸ etin Kaya Ko¸c, and C. Paar, editors, CHES, volume 2523 of Lecture Notes in Computer Science, pages 13–28. Springer, 2002.
[5] J. den Hartog, J. Verschuren, E. P. de Vink, J. de Vos, and W. Wiersma. Pinpas: A tool for power analysis of smartcards. In D. Gritzalis, S. D. C. di Vimercati, P. Samarati, and S. K. Katsikas, editors, SEC, volume 250 of IFIP Conference Proceedings, pages 453–457. Kluwer, 2003. [6] P. C. Kocher. Timing attacks on implementations of diffie-hellman, rsa,
dss, and other systems. In N. Koblitz, editor, CRYPTO, volume 1109 of Lecture Notes in Computer Science, pages 104–113. Springer, 1996.
[7] P. C. Kocher, J. Jaffe, and B. Jun. Differential power analysis. In M. J. Wiener, editor, CRYPTO, volume 1666 of Lecture Notes in Computer Science, pages 388–397. Springer, 1999.
[8] W. Schindler, K. Lemke, and C. Paar. A stochastic model for differential side channel cryptanalysis. In CHES, pages 30–46, 2005.
[9] B. Sukhwani, U. Padmanabhan, and J. M. Wang. Nano-sim: A step wise equivalent conductance based statistical simulator for nanotech-nology circuit design. CoRR, abs/0710.4633, 2007.