Western University Western University
Scholarship@Western
Scholarship@Western
Electronic Thesis and Dissertation Repository
7-2-2019 10:00 AM
Analyzing avian incubation with a computer algorithm
Analyzing avian incubation with a computer algorithm
Tanya T. Shoot
The University of Western Ontario
Supervisor Sherry, David F.
The University of Western Ontario Co-Supervisor Daley, Mark J.
The University of Western Ontario Graduate Program in Neuroscience
A thesis submitted in partial fulfillment of the requirements for the degree in Master of Science © Tanya T. Shoot 2019
Follow this and additional works at: https://ir.lib.uwo.ca/etd Part of the Ecology and Evolutionary Biology Commons
Recommended Citation Recommended Citation
Shoot, Tanya T., "Analyzing avian incubation with a computer algorithm" (2019). Electronic Thesis and Dissertation Repository. 6311.
https://ir.lib.uwo.ca/etd/6311
This Dissertation/Thesis is brought to you for free and open access by Scholarship@Western. It has been accepted for inclusion in Electronic Thesis and Dissertation Repository by an authorized administrator of
ii
Abstract
A stable nest environment is necessary for incubation and development of
offspring. Birds vary behaviour to regulate temperature for successful hatchlings. I used a
hidden Markov model (HMM) to test how environmental conditions affect incubation
behaviour. I examined nest temperatures and behaviours collected from Zebra finches
that incubated at 30 °C or 14 °C, then incubated in the same or opposite condition for a
second clutch. Data loggers and cameras recorded nest temperature and number of
parents on nest. The HMM inferred behaviour from recorded behaviours and
temperatures. Temperature and offspring success affected incubation duration. Birds that
had successful offspring incubated at higher temperatures than unsuccessful birds. The
HMM could not accurately predict number of birds from the temperature data because
birds maintained nest temperature irrespective of behaviour. This study shows that birds
can change behaviour in relation to the environment. Previous offspring success and
ambient temperature are drivers of change in incubation behaviour.
Keywords
Zebra finch, Hidden Markov model, avian incubation, temperature, temperature
iii
Summary for lay audience
Birds sit on nests to develop the embryos within the eggs they laid. However, the
environment is not always good for embryo growth. One aspect of the environment
which is important for embryo growth is the surrounding temperature. The birds have to
change the way they sit on the nest because of the surrounding temperature. If the
surrounding temperature is too warm or too cold, then the embryos may die or not
develop correctly. I look at what birds do in these situations where the surrounding
temperature is either cool or warm. I use a computer program I built to see if I can use a
small sample of bird behaviour and nest temperature to predict how many birds are on the
nest, given only the nest temperature. Zebra finches, birds that are native to Australia,
laid eggs and sat on them in either 14 °C or 30 °C. The zebra finches then stayed in the
same surrounding temperature or switched to the alternative for a second laying and
sitting on eggs.
Birds need to consider the surrounding temperature, and their breeding experience
at that temperature so that their chicks survive. I thought that if birds made mistakes in
the first try in one of the surrounding temperature conditions, the second try in the same
condition they would have more eggs hatched. If they were in a different condition for
the second try, then they would not be as successful hatching eggs than if they were in the
same condition. The surrounding temperature, and if the birds had hatched eggs had an
effect on how long the birds needed to hatch an egg. Birds that had previously been
successful hatching an egg had higher nest temperatures than unsuccessful pairs. My
model was not able to predict behaviour from nest temperature. Birds can change how
iv
Co-Authorship Statement
I conducted all statistical analyses described in the thesis, wrote and tested the
hidden Markov model, and am responsible for all interpretation and conclusions
presented in the thesis. Jeff Martin of Western University, Sophie Edwards of the
University of St. Andrews, and I collected all of the data described in the thesis as part of
a large-scale joint project on nest building behaviour and incubation with Dr. Sue Healy
of the University of St. Andrews and Dr. David Sherry of Western University. Some of
these data were used in my undergraduate thesis. Jeff Martin and I conceived the
experimental design and outlined the methodologies to be used. Sophie Edwards was
responsible for all video recordings. Results on nest building behaviour and nest structure
will be published elsewhere. Dr. Mark Daley provided expertise and guidance in writing
and testing Hidden Markov Models.
Erich R Eberts and team at the Loyola Marymount University, through the LMU
Center for Urban Resilience was the group credited for the Allen’s hummingbird data set.
Erich is responsible for all experimental design, data collection, and processing of the
v
Acknowledgments
I would like to firstly thank both of my supervisors, Dr. David Sherry and Dr. Mark Daley. David took on this project even though modeling and incubation were neither one of his research fields. His trust in my ability to execute this project will always be humbling. David always had thoughtful and encouraging feedback whenever I felt frustrated or lost. There is no discernable end to David’s understanding, knowledge and creativity. I am grateful to count myself as one of his students, and even if I take only a fraction of the wisdom he has given me, I am a better person.
Dr. Mark Daley took this project, again that was out of his research field.
However, his insight and compassion towards my learning process was always timely. I may never be able to shake the feeling of not having the skills to do the ideas I have, but Mark would always uplift me and remind me of how far I have come.
Jeff Martin has been a steadfast mentor and colleague throughout this project, as a sounding board for analyses and interpretations, as well as someone to empathize with over the data. This project would not be as robust, successful and interesting if it was not for Jeff’s dedication and critical thinking. Thank you for keeping my wild conclusions in check.
Dr. Ben Rubin, much thanks goes to for his advice on which statistical tests to run and comprehending the results. Dr. Rubin as well I would like to thank for giving me the confidence to pursue mathematics, by admitting mistakes and working through problems together made me realize everyone makes mistakes and that equations are only useful if they help understanding.
I would like to thank Adriana Diez for her teachings on how best to care for zebra finches and sharing her experience from over the years. As well, all the volunteers that cared for the zebra finches; caring for 72 zebra finches is no small feat. Thank you Erich Eberts for the hummingbird data set, without it I would be forever wondering if I had only encoded more data maybe the model would work… This project would not have been possible without the numerous users of Stack Overflow and Github, whose replies aided me in my time of programming struggle.
vi
Table of Contents
Abstract ... ii
Summary for lay audience ... iii
Co-Authorship Statement... iv
Acknowledgments... v
Table of Contents ... vi
List of Tables ... viii
List of Figures ... ix
List of Appendices ... xiii
Chapter 1: Introduction ... 1
1 Avian incubation and mathematical models ... 1
1.1 The effect of environmental cues on avian incubation ... 2
1.2 Nest-building and incubation behaviour, two methods to cope with the physiological limits of egg development ... 3
1.3 Zebra finch incubation ... 5
1.4 Hummingbird incubation ... 6
1.5 Hidden Markov models ... 7
1.5.1 Basic components of a hidden Markov model (HMM) ... 7
1.5.2 Decoding states from observations ... 10
1.6 HMMs in animal behavior ... 11
1.7 Hypothesis and predictions ... 12
Chapter 2: Methods ... 14
2.1 Zebra finch incubation ... 14
2.1.1 Subjects and husbandry... 14
vii
2.2 HMM implementation ... 17
2.2.1 Extracting data from iButton and inputting into HMM ... 17
2.2.2 Data analysis ... 20
Chapter 3: Results ... 22
3.1 Zebra finch incubation ... 22
3.1.1 Trial 1 ... 22
3.1.2 Trial 2 ... 22
3.2 HMM results ... 32
3.2.1 Descriptive results of the distribution ... 32
3.2.2 Training set creation ... 32
3.2.3 Temperature thresholds ... 33
3.2.4 HMM results ... 33
3.2.5 Allen’s hummingbird methods and data ... 34
Chapter 4: Discussion ... 41
4.1 Specific interpretations of results ... 41
4.1.1 Interpretation of breeding results ... 41
4.1.2 Exploring why the HMM was unsuccessful at predicting behavior accurately ... 42
4.1.3 Ramifications of HMM results ... 45
4.2 Future directions... 45
4.3 General conclusions ... 46
References ... 48
Appendices ... 52
viii
List of Tables
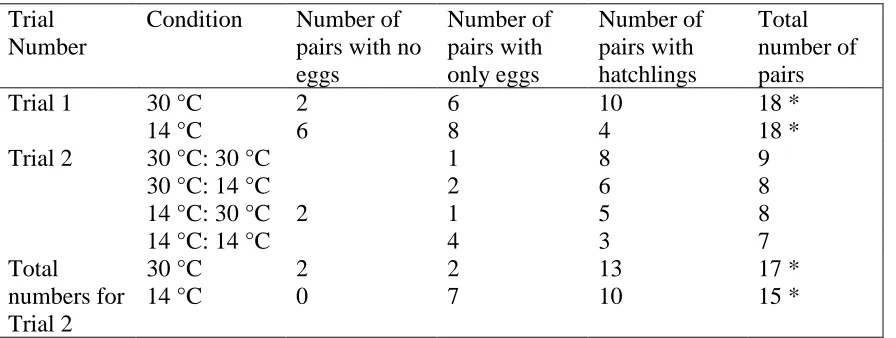
Table 1: Developmental stages that pairs arrived at by the end of each trial. * One pair
from Trial 1 in the 30 °C and three pairs from Trial 1 in the 14 °C condition were
excluded from analyses as one individual of the pair died, and therefore the pair could not
ix
List of Figures
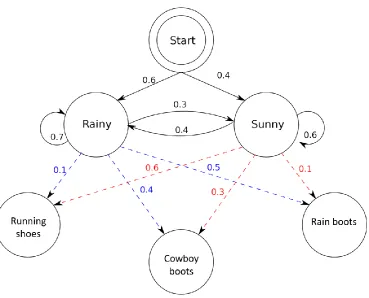
Figure 1. Example of a HMM application. The states of rainy and sunny have a starting
probability of .6 and .4 respectively. Given that it is rainy, there is a .3 chance it will
become sunny and a .7 chance it will continue raining. Given that it is sunny, there is a .4
chance that it will start to rain, and a .6 chance that it will continue to be sunny. There is a
relationship with footwear worn by individuals and the weather, where given that it is
rainy there is a .1 chance people will wear running shoes, .4 chance people will wear
cowboy boots and a .5 chance people will wear rain boots. The same can be done for
when it is sunny, there is a .6 chance of people wearing running shoes, .3 chance people
are wearing cowboy boots, and .1 chance people are wearing rain boots. This relationship
between footwear and weather can be used to predict the weather, given the footwear is
known. ... 9
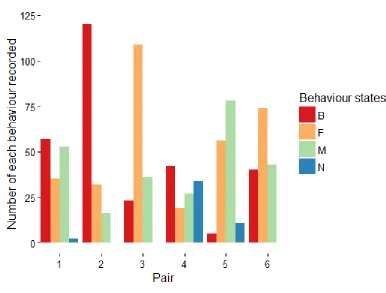
Figure 2. Number of behaviour states for the training set. Pairs 1 to 3 were from the 30°C
condition, pairs 4 to 6 were in the 14°C condition. M in blue are male, F in green are
female, N in purple are neither on nest, B in red are both on nest. Pairs were concatenated
together (where the end of pair 1 is directly followed by the start of pair 2, and so on) to
generate a suitably long sequence of both behaviour and temperature data for three pairs.
... 19
Figure 3. Cumulative number of eggs recorded per condition for all pairs in Trial 1, 30 °C
shown in red with a sample of 16 pairs, 14 °C shown in blue with a sample of 12 pairs.
Days as recorded by first egg laid, the same day for both conditions. The number of eggs
recorded are only shown prior to first hatchling. The 14 °C condition hatched earlier than
the 30 °C, which is why the red bars continue further than the blue. The total number of
pairs with successful hatchlings was significantly higher in the 30 °C condition than the
14 °C condition (χ2
1 = 4.2, p = .04). ... 21
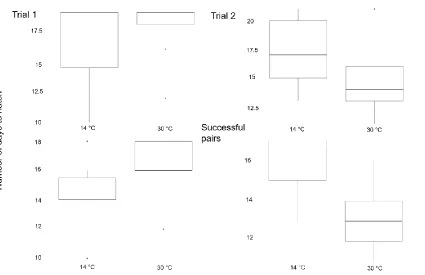
Figure 4. Incubation duration in days for each temperature condition. Trial 1 first
column; Trial 2 second column. Bottom row is solely successful pairs. In Trial 1, pairs
x
(z = -3.41, p = .0003). In Trial 2 they incubated longer in the 14 °C condition (z = -1.61,
p = .05). The successful pairs show the same trend as the rest of the pairs. ... 25
Figure 5. Cumulative number of eggs laid for Trial 2. Red shows eggs laid for the 30 °C
condition, blue shows eggs laid in the 14 °C condition, both have a sample of 17 pairs per
condition. The 14 °C condition laid earlier and more than the 30 °C condition. The 30 °C
condition hatched prior to the 14 °C condition, which is why the blue bars continue
further than the red bars. The hatch date was later in the 14 °C condition than the 30 °C.
... 26
Figure 6. Mean values of incubation duration in Trial 2 for each of the ambient
temperature groups, separated by previous hatchling success in Trial 1. The prediction
was that pairs that had experience in the same ambient temperature condition, would need
the same or less time to incubate and hatch offspring. Translating the prediction to the
graph, I would expect the blue and red bars to be shorter than the green and orange bars,
respectively. Although the 30 °C:30 °C and 30 °C:14 °C follow this pattern, the 14 °C:14
°C does not. The lack of significant effect in the ANOVA furthers the conclusion that at
this sample size, there is likely not an experience effect. Hatchling success and ambient
temperature condition in Trial 2 both had significant main effects on incubation duration
for Trial 2. Error bars are standard deviation. ... 28
Figure 7. Mean incubation temperature as measured by the iButton for every pair and
time point, for a representative incubation day. The temperatures for the whole incubation
period is visualized in Figure 8,9. Pairs that were successful are shown in dark red and
dark blue, with unsuccessful shown in light red and light blue (30 °C, and 14 °C,
respectively). Successful pairs from Trial 1 maintain a higher temperature in the nest in
Trial 2 than unsuccessful pairs. Error bars are standard error of the mean. ... 29
Figure 8. Nest temperature distributions for 30 °C and 14 °C for Trial 2, successful and
unsuccessful from Trial 1 (top successful, bottom unsuccessful). Unsuccessful pairs have
distributions with a large peak around ambient temperature. Density plots can be thought
xi
Trial 1 and the effect of success of Trial 2. Density plots have the number, in this case
temperature value on the x-axis, and the y-axis has the probability density function of the
kernel density estimation (Koehrsen, 2018). For more information, see
https://towardsdatascience.com/histograms-and-density-plots-in-python-f6bda88f5ac0. 30
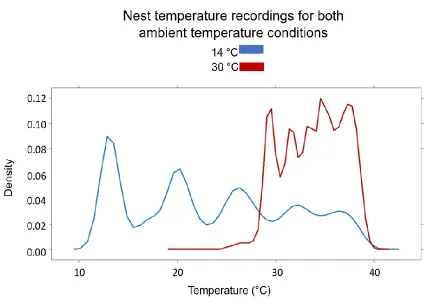
Figure 9. Distributions of temperature recordings for all pairs per condition, 30 °C in red,
14 °C in blue. Both distributions are significantly not normal (Anderson-Darling value of
573) and are visually quite different from each other, with the 30 °C nest temperature
recordings having a narrow range of temperatures recorded, whereas the 14 °C is more
dispersed. See Appendix C for a comparison of Trial 1 and Trial 2 complete temperature
distributions... 31
Figure 10. Recorded temperature for the training data set compared to binarized
temperature shown below. Recorded temperatures are shown in the left panels with the
temperature scale on the right side of each panel. Binarized temperatures are shown in
the right panels with a binarized temperature scale. 30 °C training set shown in dark red
(above), 14 °C training set shown in cyan (below). Grey lines indicate behaviour states,
with number of birds on the left side of each panel. Black lines separate data for the three
training data set pairs. For each pair, the record for one day randomly picked during the
incubation period is shown. The binarized temperatures create a simpler model, but
without the resolution of the absolute temperatures. ... 35
Figure 11. HMM predicted behavior (dashed orange) as compared to manually encoded
behaviours (purple) and associated temperatures shown in red and cyan for the separate
ambient temperature conditions. The HMM was unable to effectively capture the
variation of behaviours. ... 36
Figure 12. Comparing iButton recordings at random points during incubation (left) and at
start of incubation (right). Model predictions remained constant, even as behavior
changed. There was a decrease in accuracy of predicting behavior from temperature
during the first few days. This was likely to more variable behavior that the model could
xii
Figure 13. Proportion of behaviour for 30 °C (top two pie charts) and 14 °C conditions
for the training set (left) and validation set (right). The training set is quite different in the
30 °C condition, however is similar in the 14 °C training set, with no associated increase
in accuracy. ... 38
Figure 14. Hummingbird incubation, model predicted behaviour (dashed orange) still
predicting one bird on the nest almost all the time, whereas the manually encoded
behaviour (purple) shows instances of the hummingbird off the nest, with respective
temperature variation (red). Even with an increased sample size, the HMM fails to
encapsulate minute changes in behaviour. ... 39
Figure 15. Distributions of whole temperature data set for each behaviour state, for each
ambient temperature condition. There is an insufficient amount of data for zero birds on
the nest to draw conclusions, and there is considerable overlap between 1 and 2 birds on
the nest, which would make accurate prediction of behaviour using temperature not
possible. Mann-Whitney tests with Bonferroni correction for multiple comparisons were
done to see if there was a relationship between the behaviour (0,1, or 2 birds on nest)
with the nest temperature distributions (14 °C 0 birds: 1 bird z = 0.78, p = 1, 1:2 z =
-0.398, p = 1, 0:2 z = 0.763, p = 1; 30 °C 0:1 z = -1, *** p < .001, 1:2 z = -4.19, *** p <
xiii
List of Appendices
Appendix A. Both HMM codes………52
Appendix B. Animal use protocol for zebra finches……….……57
Appendix C. Trial 1 and post-Trial 2 nest temperature distributions for all pairs and
1
Chapter 1: Introduction
1
Avian incubation and mathematical models
Incubation is the period during avian reproduction when birds sit on the eggs to
keep a stable temperature until the eggs hatch. It is during this time that the embryo
inside the egg develops into a chick. Fluctuating environmental conditions (i.e.,
temperature, precipitation, and wind) can put pressure on birds to change how they
incubate to maintain a stable temperature and microclimate for their eggs (Love,
Gilchrist, & Semeniuk, 2010; Ninnes et al., 2011).
Avian incubation is how birds can maintain the nest environment for suitable
embryo development. Birds achieve the ideal nest environment by careful control of
temperature, humidity, and gas exchange. As with most physiological processes, embryo
development requires a narrow range of temperatures (35 °C -38 °C) for successful
hatching. The bird maintains this nest temperature by sitting on the eggs, however the
length of time sitting on the nest and how the nest is built are factors that lead to
successful offspring (Deeming, 2002). If the nest temperature becomes too cool (less than
30 °C), birds have been observed shivering and feather raising or fluffing up; whereas if
the nest temperature becomes too warm (greater than 40 °C) the birds open their mouths
to release heat (gular fluttering) (Deeming, 2002).
As one or both parent birds are required to be on the nest to maintain a
satisfactory temperature, the other tasks such as foraging for food and grooming each
other must be modified. To achieve this, most birds have both parents incubating like the
zebra finch (Taeniopygia guttata). There are exceptions though, with some species
having only one bird incubate, whether it is the female such as in the Allen’s
hummingbird (Selasphorus sasin) or the male. The amount of time spent on the nest
varies widely across species whether it is constant sitting on the nest or sporadic
incubation sessions. Nest temperature and number of birds on the nest are part of the
equation that can lead to successful offspring. The next section (1.1) will delve into how
2
1.1 The effect of environmental cues on avian incubation
Environmental variables such as precipitation, wind, temperature and elevation
are challenges for birds during reproduction (Heenan, Goodman, & White, 2015). Yet, as
birds are found from the rainforest to the Antarctic, they have evolved diverse
behavioural mechanisms to adapt to seemingly inadequate reproductive environments. A
general mechanism that birds use is to time their reproduction to food availability (Love,
Gilchrist, & Semeniuk, 2010; Ninnes et al., 2011; Stouffer, Johnson, & Bierregaard Jr.,
2013). Near the equator, birds generally breed throughout the year with some relation
with rainfall, as food is plentiful. In the temperate regions, birds generally breed in
conjunction with the seasons, as food resources are scarce during the winter (Stouffer,
Johnson, & Bierregaard Jr., 2013). This example of birds adapting to environmental
conditions is a gross difference between the temperate and equatorial regions. Can birds
show similar changes to behaviour when environmental conditions change rapidly?
The Adélie penguin (Pygoscelis adeliae) has been seen to exhibit rapid
behavioural change in line with the ice sheets receding. Adelie penguins modulate their
incubation duration due to the amount of ice sheet still present to allow for the best
chance of chick survival from one year to the next. The differences between incubation
duration is observed not only from year to year, but also compared to different colonies,
where ice melt differs (Ninnes et al., 2011). Shortening the incubation period to coincide
with food availability is one method of behavioural change to adapt to environmental
conditions (Ninnes et al., 2011).
The common eider (Somateria mollissima) takes a slightly different approach
when faced with changing environmental conditions. Instead of changing its number of
days during incubation, the common eider changes its lay date, but maintains the same
number of days for incubation. The behavioural change is correlated with both the
ambient temperature and ice melt, to time hatching with the receding ice and increased
food availability (Love, Gilchrist, & Semeniuk, 2010). Changing lay date and incubation
duration are two mechanisms birds have employed to synchronize reproduction to
3
Not all birds, however, show this relationship between environmental change, and
subsequent reproductive behavioural change. Rhinoceros auklets (Cerorhinca
monocerata) were observed under variable field conditions for four years, with no
significant change in incubation following environmental fluctuation and widely variable
breeding success (Hipfner, Mcfarlane-tranquilla, & Addison, 2008). The success of
offspring did not influence the next reproductive attempt. Another example of a bird
species unable to change their reproductive behaviour to changing environmental
conditions is the great tit (Parus major), who after 23 years of study has not changed its
lay date to accommodate the increased ambient temperature. The great tit is at a
disadvantage as it is missing potential food resources before its clutch has hatched
(Visser, Noordwijk, & Tinbergen, 1998).
The research into how birds can change their incubation behaviour to react to
changing environmental conditions has shown potential mechanisms, from changing
incubation duration to changing the lay date of the eggs to coincide with available food
resources. All the included studies have taken place in the field, so the ecological validity
of the findings is high. An understanding of which environmental conditions are cuing
these behavioural changes is difficult to establish. My project aims to recreate
reproductive conditions while in the lab. The lab allows for a higher number and
precision of measurements. Investigating incubation within a controlled lab setting will
provide an opportunity to look at a single environmental variable and its effect on
incubation.
1.2 Nest-building and incubation behaviour, two methods to cope
with the physiological limits of egg development
Incubation duration and egg lay date need to align with food availability, but also
the physiological requirements needed for embryo development. Eggs require a narrow
range of temperatures to reach hatching with proper development. Approximately 35 °C
must be maintained for egg viability. Any consistent temperatures below the 35 °C
threshold will halt development of the embryo, or lead to lower rates of survival as the
offspring matures (Berntsen & Bech, 2015; Durant, Hepp, Moore, Hopkins, & Hopkins,
4
1974). For example, Wada et al., (2015) found that even 1 °C change from the ideal
temperature can lead to poorer offspring development and survival.
There are two potential methods to maintain 35 °C, either: 1) the birds can
construct a nest that will keep heat from interspersed incubation bouts, or 2) incubate for
an amount of time that maintains the required temperature with the nest retaining little
heat. It is possible that birds use some combination of both (Deeming, 2002).
In theory, the more insulation a nest has, the less the parents must incubate to
achieve the ideal incubating temperature. However, previous literature has found little
evidence to support the theory that more insulation is used to offset incubation duration.
When researchers studied the structural and thermal components of cup-shaped nests,
they found that nest shape was for structural support of the eggs and parents rather than
for insulation (Heenan & Seymour, 2011).
An example illustrating that modulating nesting material may not be the method
used to control nest temperature is arctic birds. One would assume an extreme amount of
nest insulation would be needed, however, nests did not have a higher amount of
insulation—if any—than would be expected for the climate (Irving & Krog, 1956).
Because of these studies, it can be concluded that modulating nesting material may not be
a strong method for maintaining nest temperature.
Instead of changing nest shape for insulation, birds can alter incubation duration
as a fine scale adjustment of the nest microclimate (Deeming, 2002). A pair could
incubate in 15 minute increments with two birds on the nest always, then after 15 minutes
both birds leave the nest; whereas another pair may have one bird incubating constantly,
presuming the birds switch off seamlessly. Incubation duration will likely influence the
amount of time required to hatch, as seen in the Adelie penguin example (section 1.1).
Birds can change how long they sit on the nest to regulate temperature, but also
can adjust the heat output they produce. Previous research has shown that if the number
of eggs is increased, female zebra finches (Taeniopygia guttata) will increase their heat
output (Hill, Lindström, Mccafferty, & Nager, 2014). As well, at more variable
temperatures, the male plover (Charadrius spp.), increases his incubation temperature
output (Alrashidi et al., 2016). The female zebra finch and male plover are both able to
5
Changing incubation behaviour is a response to the environmental conditions. The
more experience a bird has in the environment, the more it will learn what modifications
are required during reproduction for successful offspring. Birds have been shown to
integrate previous experience into their preferences during reproduction. Experience with
nesting material or environmental factors have been shown to elicit rapid plastic
behavioural responses in birds. For example, experience can lead to sensitivity to colour,
rigidity of material, precipitation or wind direction, and birds will change their
nest-building behaviour to withstand these environmental pressures (Muth, Steele, & Healy,
2013; Muth & Healy, 2011; Bailey, Morgan, Bertin, Meddle, & Healy, 2014; Heenan,
2013). Taken what is known about birds’ ability to modulate nest temperature and their
behavioural flexibility, I aim to delve further into when and how birds change their
incubation behaviour.
In both section 1.1, and the current section 1.2, numerous examples of birds
adapting to environmental cues have been put forward. These studies use manual data
collection where there is a possibility for subjective and erroneous recordings. My project
improved the previous research by recording data in a controlled lab environment to look
at one environmental cue— temperature— and by automating a part of data collection to
increase objectivity, while decreasing human error.
This MSc project investigated when and what kind of changes in incubation
behaviour occur. I examined a large data set consisting of automatically recorded nest
temperatures and video recordings of parental nest attentiveness that I had previously
collaborated in collecting as part of a large-scale project on nest building behaviour in
zebra finches. In this thesis, I examine the effect of ambient temperature and previous
incubation experience on nesting success in zebra finches. I develop a Hidden Markov
model (HMM) and apply it to the time series of recorded nest temperatures and parental
nest attentiveness by zebra finches, and also apply this model to another smaller dataset
of Allen’s hummingbird incubation behaviour obtained by thermal imaging.
1.3 Zebra finch incubation
Zebra finches (Taeniopygia guttata) were chosen to study when and what kinds of
6
opportunistic breeders and thus breed throughout the year. Therefore, their ability to
change behaviour according to differing environmental temperatures should be evident.
Zebra finches are extensively studied; their incubation behaviour and physiology are well
described (Nord, Sandell, & Nilsson, 2010; Salvante, Walzem, & Williams, 2007; Zann
& Rossetto, 2014).
To understand how zebra finches change their incubation behaviour, the typical
reproductive behaviours are first described. In zebra finches, the breeding cycle begins
with the male and female completing a courtship routine, with the male singing. The male
then builds a nest. A typical zebra finch nest is constructed in a dome shape. The dome
shape can include a roof, though not all zebra finch nests do. The female contributes little
to building of the nest. After internal insemination, a clutch of eggs is laid (Morris, 1954).
The female takes on the primary role of incubating the eggs, though the male will aid in
incubation (Gorman & Nager, 2003; Hill, Lindström, Mccafferty, & Nager, 2014; Zann
& Rossetto, 2014). The average percent of total time spent on the nest during incubation
is 91.1% +/- 10.8% for Passeriformes who share incubation of altricial young, which
zebra finches fall into (Deeming, 2002). Each clutch consists of approximately 4-6 eggs,
with the female only able to lay one egg each day (Griffiths & Gilby, 2013). The
nest-building takes roughly 10 days, followed by an incubation of 14 days and then fledging
for another 14 days. After the hatchlings have fledged from the nest, they can live
independent from their parents (Morris, 1954).
1.4 Hummingbird incubation
As small birds, hummingbirds face an even greater challenge of keeping an
optimal thermal climate in the nest as compared to other birds. However, Calder (1971)
observed Calliope hummingbirds (Stellula calliope) that reproduce at high elevation
throughout the Cascade, Sierra and Rocky Mountains and when compared to Anna’s
hummingbirds (Calypte anna) that breed at lower elevations, found no difference in the
number of days taken to incubate. Calder’s finding that high elevation hummingbirds
need no more time than low elevation hummingbirds illustrates that the high elevation
7
whether it is optimizing the type of nest, proportion of the days sitting on the nest, or the
heat output that the hummingbird is expelling.
As hummingbirds do exhibit behavioural changes to environmental stimuli, they
will be used as a comparison to the zebra finches, as only the female hummingbird
incubates the eggs, thus creating an even more challenging situation in terms of energy
expenditure and offspring survival. For my project, I was able to use a data set collected
by Erich Eberts of the Allen’s hummingbird (Selasphorus sasin). The Allen’s
hummingbird female creates a nest using downy materials for the interior and grass and
leaves for the exterior, spider webs are used as an adhesive. The clutch size is two eggs,
with the second egg being laid two days after the first. Multiple clutches are laid
throughout the breeding season. Only the female incubates for 15 days, with the
attendance increasing after the laying of the second egg. The female is on the nest
constantly, save for feeding. Females will change their position on the nest to change nest
temperature (Clark & Mitchell, 2013). Having only one parent possible to be on the nest
at one time allows for a simpler data set to test the model on.
1.5 Hidden Markov models
1.5.1 Basic components of a hidden Markov model (HMM)
Hidden Markov models are used to analyze time series data consisting of states
and observations. Let us consider the example of a diligent graduate student working in a
windowless lab. She would like to know what the weather is outside. In this example, the
weather can only be sunny or rainy. An assumption of the HMM is that only the previous
day influences today’s weather. These states follow the Markov property, of being
dependent on just the previous state (Equation 1). The current state is required to make
8
Pr(𝐶𝑡+1| 𝐶𝑡… 𝐶1) = Pr(𝐶𝑡+1|𝐶𝑡)
Equation 1. The Markov property. The history of state C from the initial state C1, to the
present state Ct predicts the next state Ct+1 with the same probability as using the most
recent value of Ct. That is, the next state depends only on the current state.
In this example, the weather is the state, and there are only two possible states that
follow one after the other: sunny or rainy. There is an initial or starting probability of it
raining or being sunny. As days go past, the weather has the possibility of changing from
sunny to rainy, rainy to sunny or for it to remain sunny or rainy. These transitions from
one weather state to the next have associated probabilities—transition probabilities—of
the likelihood that one weather state would follow the previous one. This is visualized in
the top portion of Figure 1 (Zucchini & MacDonald, 2009).
However, as the name suggests, these states are hidden in this hidden Markov
model. The only method to discern the weather is from the shoes of people passing by the
lab, because the lab has no windows. The weather state is the cause of the footwear
observations, but the studious graduate student cannot directly see the weather. In this
lab, people generally wear rain boots when it is raining, running shoes when it is sunny
and cowboy boots irrespective of weather conditions. However, fashion trends have
created a world that it is not a certainty that all people wearing rainboots means it is
raining outside, as shown in Figure 1. The relationship between footwear and weather
can be used to determine the weather, as knowing that most people wore rain boots and
cowboy boots would mean it is most likely raining. Thus, even though the state is hidden,
it can be inferred from direct observations.
In my project, the states are the number of birds on the nest: 0,1, or 2 birds on the
nest. The observations are nest temperature. As nest temperature is related to the number
of birds on the nest, the hypothesis that I am testing with the HMM is that by knowing
what the temperature is at a given point, it is possible to determine the number of birds on
9
Figure 1. Example of a HMM application. The states of rainy and sunny have a starting
probability of .6 and .4 respectively. Given that it is rainy, there is a .3 chance it will
become sunny and a .7 chance it will continue raining. Given that it is sunny, there is a .4
chance that it will start to rain, and a .6 chance that it will continue to be sunny. There is a
relationship with footwear worn by individuals and the weather, where given that it is
rainy there is a .1 chance people will wear running shoes, .4 chance people will wear
cowboy boots and a .5 chance people will wear rain boots. The same can be done for
when it is sunny, there is a .6 chance of people wearing running shoes, .3 chance people
are wearing cowboy boots, and .1 chance people are wearing rain boots. This relationship
between footwear and weather can be used to predict the weather, given the footwear is
10
1.5.2 Decoding states from observations
The HMM takes a subset of recorded behaviour states and temperatures, creates
starting and transition probabilities from that training set of known states and
temperatures, and applies those starting and transition probabilities to a new set called the
test set of temperatures only, where the model predicts the most likely state given the
temperature. The training set is the subset of behaviour states and temperatures that the
HMM generates probabilities from, and bases all behaviour predictions upon. Therefore,
the training set should be a representative sample of the data set, otherwise probabilities
and predictions would not be accurate. How I generate a training set is included in section
2.2. The values for temperature that occur in the test set list of temperatures must be
values that occur in the training set, as only temperatures present in the training set will
have probabilities associated with them. For example, if the case that 32 °C as an
observation does not occur in the training set, but does occur in the test set, there will be
no associated prediction as to the state at that temperature. Although all the values for
temperature in the test set must be present in the training set, no particular sequence of
temperatures has to be, as the HMM only relies on the previous state to generate
predictions.
The rest of this section delves into how the transition and starting probabilities are
generated.
This section follows Zucchini and MacDonald (2009), primarily their section
5.3.1. The main problem that the HMM aims to address for the current project is the
ability to inform the researcher for any given temperature in the training set, what is the
most likely behavioural state. To be able to calculate the most likely state from
temperatures, forward and backward probabilities are required. The forward probability is
calculated by taking the first observations in the sequence and finding the likelihood of
being in a specific state. The backward probabilities instead assume a state and calculate
the probability of obtaining future observations. The forward and backward probabilities
can be used in conjunction to predict any state for any specific time, however, they
11
𝛼𝑡(i)𝛽𝑡(i) = Pr( 𝑋(𝑇) = 𝑥(𝑇), 𝐶 𝑡 = 𝑖).
Equation 2. Forwards (α) and backwards (β) probabilities for each of the possible states
i, is equal to the probability of one observation for the most recent time point (x(T)) being
equal to one out of the possible observations X(T) , given that the state is one (C
t) out of the possible i.
For every time point (t), one can predict the most likely state Ct , given the
observations x(T). For the current problem, global decoding is required as the sequence of
behaviour states c1,c2,c3…cT is sought. As forward and backwards probabilities can only
give the most likely state at a given time, and the sequence of most likely states is
required, the Viterbi algorithm is used (Viterbi, 1967; Forney, 1973; see Zucchini &
MacDonald, 2009 for the proof).
1.6 HMMs in animal behavior
For my project, I used a HMM to infer behaviour states from nest temperatures.
Previous work has shown how successful HMMs can be at discerning “hidden” states
from observations. Past uses have included human speech recognition, transmembrane
protein topology, and brain imaging (Krogh, Larsson, Heijne, & Sonnhammer, 2001;
Rabiner, 1989; Zhang, Brady, & Smith, 2001). Within ecology, a similar approach to
what I have taken has been abundant: an animal behaviour that is not directly observable
is inferred from collected data. Dean et al. (2012) used a HMM to understand behavioural
differences between two colonies of seabirds (Puffinus puffinus). The researchers used
ground speed from GPS recordings and saltwater immersion to train the HMM to predict
which of the three states, foraging, flying and sitting the seabirds were most likely in. The
HMM was then trained, and able to use just the GPS recording and saltwater immersion
data to accurately predict which behavioural state the seabirds were in. The result from
the model was that the two colonies of birds foraged in two generally exclusive areas,
12
Franke, Caelli and Hudson (2004) used a HMM to validate previously collected
caribou (Rangifer tarandus) movement data. The three states of interest were bedding,
feeding, and relocating. The observations to infer these states were distance between
locations and turning angle, from GPS collars. The HMM trained on the GPS data was
able to accurately predict which behavioural state the caribou were in. Those HMM state
predictions were then compared to auto-regressive model predictions, with the former
being more accurate (Franke, Caelli, & Hudson, 2004).
Schliehe-Diecks, Kappeler, and Langrock (2012) used a slightly more
sophisticated HMM to address individual differences. The HMM was used to infer
motivational states, specifically hungry or satiated in grey mouse lemurs (Microcebus
murinus). The observations were sex, body mass and time of night. The observations
were used to infer motivational states (hungry/satiated), however there were extensive
individual differences between the grey mouse lemurs. These differences were
encapsulated by adding random effects—akin to random effects in a regression model—
to their HMM. These random effects controlled for individual differences. The HMM
with random effects allowed for insightful conclusions about grey lemur appetitive states,
such that they change states much more often than the authors hypothesized in
conjunction with time of night (Schliehe-Diecks, Kappeler, & Langrock, 2012).
HMMs have been used to understand complex systems when measured in the
field, as illustrated here. For each of these examples, the behavioural states have discrete
and mutually exclusive signatures within time and space—like in the caribou example the
caribou cannot be both moving and sleeping, and the GPS data has a specific signature
that defines moving from sleeping. In the current project, incubation posed a challenge to
the HMM as detecting one or two birds on the nest may be a state change not as closely
linked to the observations than the previous literature shown here.
1.7 Hypothesis and predictions
I hypothesized that ambient temperature, and the birds’ experiences at that
ambient temperature affect how birds incubate. I predicted that at a low ambient
13
development. This is accomplished by an increase in continuous incubation or shorter
trips away from the nest. The opposite would be expected at a high ambient temperature.
I also predict that birds with more experience at a certain temperature will use their
experience to inform the subsequent breeding attempt by either doing the same
incubation behaviour if they were successful, or adjusting their incubation duration to be
different than before.
To test this hypothesis, I observed36 pairs of zebra finches at different
temperatures at the known ambient temperature limit of the breeding range. I collected
nest temperature recordings from time the first egg was laid to the first hatchling hatched.
18 pairs were then either kept in the same ambient temperature condition for a second
breeding cycle while 18 pairs were switched to the alternate ambient temperature
condition, to address the aspect in my hypothesis about temperature-related experience.
The same nest temperature was recorded for Trial 2, along with behavioural video
recordings. The duration of incubation in days, hatchling success, and number of eggs
was recorded for Trial 1 and 2. A subset of behaviours during incubation in Trial 2 were
encoded, along with the respective nest temperatures. The subset of behaviour and nest
temperature was used to train the HMM. The HMM predicted behaviour states from nest
temperatures, which allowed for detailed analyses of incubation behaviour, and the
differences that arose between ambient temperature conditions. Further method detail can
be found in Chapter 2.
In Chapter 3 I present results on number of eggs and successful hatchlings per
ambient temperature condition. The differences in incubation duration per ambient
temperature and breeding experience are shown. The distributions of nest temperatures
for 30 °C and 14 °C are compared, along with how the distributions shift when
comparing successful and unsuccessful pairs. Accuracy of HMM for predicting
behaviour from temperature is calculated for both the zebra finch and hummingbird data
14
Chapter 2: Methods
2.1 Zebra finch incubation
2.1.1 Subjects and husbandry
Thirty-six male-female pairs of sexually mature zebra finches were used in this
study. All zebra finches were purchased from pet stores. The zebra finches were all given
one breeding attempt prior to the start of the experience to ensure all pairs had at least
one breeding experience to partially factor out lack of breeding experience. This breeding
attempt was halted before egg hatching so no one pair had successful breeding that others
did not. Throughout the study, birds had ad libitum access to water, mixed seeds,
cuttlebone, and oyster shell grit, along with two tablespoons per pair of eggmix per day.
Eggmix contained boiled egg with shell, corn meal and bread, blended using a food
processor. Birds were given water dishes for bathing on a weekly basis.
Pairs were housed in individual cages (46 cm x 47 cm x 46 cm). Isolation walls
that obstructed the pair’s view of the neighbouring pairs were affixed to the cage with
zip-ties. These isolation walls were composed of white Bristol board and cut to fit the
three sides of each individual cage. Cages were arranged in the room to prevent pairs
from viewing other pairs. For the second trial, black Bristol board was used on the back
wall for added contrast when viewing the video recordings. Each cage contained a food
cup, grit cup, water bottle, cuttle bone and a nest cup which was a plastic tray generally
used under small plant pots (89 mm in diameter) The tray was hot glued to a U-shaped
bolt affixed to the cage.
Two climate-controlled chambers were used to house the two ambient
temperature conditions separately. Each chamber was temperature controlled (± 0.1 °C)
while providing approximately 15 air exchanges per hour (15 % fresh air, 85%
recirculated HEPA filtered air). The chambers were 2.8 m wide x 2.85 m long x 2.3 m
high.
Both conditions were on a 14:10 hr light: dark schedule, with full spectrum
lighting and initial temperature range of 19-22 °C, 50-70 % humidity. Temperature was
15
Plastic nest cups were supplied to each pair along with naturally uncoloured
Everlasto flexible cotton string, with a diameter for 2.5 mm (James Lever & Sons Ropes
& Twines, England, UK). Each pair started with 300 pieces of string (15 cm in length).
Once the pair had used the original 300 pieces, they were given an additional 100 pieces.
This continued until they did not use the string or four days went by, whichever came
first. Four days was used as a standard nest-building period and the number of days
where string was provided was not increased as to discourage nest rebuilding.
2.1.2
Procedure
Both Trial 1 and Trial 2 were completed as part of my undergraduate thesis
project, where only the nest-building phase of reproduction was of interest. For my
Masters degree data regarding the incubation phase of reproduction was used.
2.1.2.1 First breeding trial
This experiment investigated how zebra finch pairs adapted their incubation
behaviour to different temperatures. The pairs were randomly assigned to either the 14 °C
or 30 °C condition. Each condition contained 18 pairs. Maxim iButtons DS1925 +/- 0.5
°C temperature loggers, were used to measure temperature in the nest. An iButton was
placed beside the first egg laid and set to record temperature every five minutes. This was
done only for pairs that had kept their egg in the nest for 24 hrs. Pairs were monitored
every other day to reduce intrusion on the nest. Number of eggs laid was recorded as well
as if any eggs were discarded by the pair. Eggs laid outside of the nest cup were
discarded by the experimenter, unless three successive eggs were laid outside the nest
cup, then the next eggs would be left. The iButton logged data until the parents were
taken out of the condition, along with any hatchlings. For the purpose of this experiment,
only the period between the laying and hatching of the first egg was considered, to avoid
temperature interference from the hatchlings.
2.1.2.2 Second breeding trial
To examine the effect of temperature-related experience on incubation behaviour,
a second breeding trial was completed. After the first breeding trial, temperatures were
16
The pairs had at minimum one week between breeding trials at 22 °C. This week was in
a separate room than the environmental chambers to control for any noise effects in the
chambers. Then at the start of the second breeding trial, the birds were placed in the
appropriate environmental chamber and temperatures were decreased or increased by 1.5
°C every 12 hrs in the same method as Trial 1.
The same zebra finch pairs were used for the second trial, half of the pairs from
the 14 °C chamber in the first trial were switched to the 30 °C chamber, and half from the
30 °C condition were switched to the 14 °C chamber. The other half of the pairs in each
temperature remained in the same temperature condition for the second trial. Breeding
success in Trial 1 was counter-balanced across conditions for Trial 2. As there were five
pairs in each of the original 14 and 30 °C conditions that successfully raised hatchlings to
fledge, those 10 pairs were spread randomly across each of the four conditions in Trial 2.
This counter-balancing ensured there was no unequal distribution of previous hatchling
success across the Trial 2 conditions.
There were 9 pairs in each of the four second trial conditions: 14 °C to 14 °C, 14
°C to 30 °C, 30 °C to 30 °C and 30 °C to 14 °C. Once the pairs were given string for
nesting material, video cameras were set up to record the top two rows of the three rows
of cages in each cage rack. Six out of the 17 cages for the 30 °C condition, eight of the 15
for the 14 °C were not manually encoded due to the constraints of the video cameras
used. One pair in the 30 °C, and two pairs in the 14 °C were not used as one of the
individuals in the pair had died prior to the start of Trial 2. The videos made it possible to
view each nest, and whether there was a male or female zebra finch on the nest. Video
records were collected until the pairs and hatchlings were removed from the conditions,
at approximately four weeks. IButtons were placed as per the first breeding trial.Pairs
were monitored every day for number of eggs laid and any eggs that were discarded by
the pair. If the pair laid eggs in anything other the nest cup, the eggs were discarded by
the experimenter, if three successive eggs were laid in anything other than the nest cup,
they were left. After the iButtons were collected from the nests, the data were analyzed
17
2.2 HMM implementation
2.2.1 Extracting data from iButton and inputting into HMM
The purpose of the HMM was to derive incubation behaviour from the iButton
temperature data. Three pairs per condition were picked that had the best video quality.
One day of behavioural states, male (M), female (F), both (B) or neither (N) bird on the
nest, was manually encoded into Microsoft Excel. These behavioural states were
synchronized with their respective iButton temperature recordings. The synchronization
was performed by matching the iButton serial number associated with a pair to the pair’s
video recording. Then, the time stamp on the iButton was compared to the video
recording, so that the behavioural states matched the exact time the iButton recorded
temperatures. I later discarded the sex categorization as the model was unable to account
for the differences between sex, and simplified the states to 0,1,or 2 birds on the nest.
I then had a 483 x 2 matrix of behavioural states and temperatures for the 30 °C condition, and a 429 x 2 matrix of behavioural states and temperatures for the 14 °C
condition. The different rows between conditions was due to randomization of start time,
as some start times for manually encoding behaviour included time when the cage was
dark. The rows in the matrices (483 for 30 °C, 429 for 14 °C) were each time point; the first column was the nest temperature and the second column was the behaviour state. I
ran an auto-regressive moving average (ARMA) regression with condition for trial 2 (30
°C or 14 °C) and behaviour (M,F,B,N) as independent variables, with pair as a random
effect, and temperature as a dependent variable. I ran the regression to investigate
whether there were any differences between pairs in the same ambient temperature
condition. As the only significant term was ambient temperature condition (t108 = 9.7, p <
.001), I increased the length of the time series by concatenating pairs into one long time
series for each ambient temperature condition.
The first record for the second pair followed the last point of the first pair and, the
first time point for the third pair followed the last time point of the second pair, separately
for ambient temperature condition. These two matrices were used as training sets for the
18
1.5.2, the training set is used to generate the starting distribution and transition
probabilities for the HMM.
I input either the 14 °C or 30 °C training set, with a test set of nest temperature
data only. The HMM outputs a string of states that it predicts are the most probable,
given the training set, the previous state, and the temperature at the current and previous
time.
To validate these predictions, I manually encoded a validation set for each
condition. A validation set consisted of one hour of manually encoded behavioural states
per pair. For pairs that were included in the training set, an hour that was not included in
the training set was encoded. These validation sets were 141 x 2 and 83 x 2 matrices of
temperature and behaviour for 30 °C and 14 °C, respectively. The different row numbers
for each condition are due to less cages in the 14 °C condition having video clear enough
to manually encode (11 pairs used for 30 °C and 7 for 14 °C validation sets). Only the column containing temperature was input into the HMM as a test set. The resulting
predictions were compared to the manually encoded behaviours and given a score of 0 or
1, 0 being incorrect prediction, 1 being correct prediction. The scores were tallied and the
19
Figure 2. Number of behaviour states for the training set. Pairs 1 to 3 were from the 30°C
condition, pairs 4 to 6 were in the 14°C condition. M in blue are male, F in green are
female, N in purple are neither on nest, B in red are both on nest. Pairs were concatenated
together (where the end of pair 1 is directly followed by the start of pair 2, and so on) to
20
2.2.2 Data analysis
The success of pairs in each ambient temperature condition was compared to see
if ambient temperature influenced the number of days required for incubation, and the
proportion of successful pairs. All statistics were completed with an alpha value of .05. A
Mann-Whitney test was used to assess number of days as the data was not normal, and a
chi-square test of proportions was used to assess the proportion of pairs in each
developmental stage (no eggs/eggs/hatchlings). This was completed separately for Trial 1
and Trial 2. To test the effect of temperature-related experience (Trial 1 temperature and
Trial 2 temperature) along with the effect of breeding success in Trial 1 together on the
number of days required to hatch was combined in a 2x2x2 ANOVA.
To understand the differences between successful and unsuccessful pairs I plotted
the distributions of nest temperatures separately for successful and unsuccessful pairs,
and observed the differences. I did the same for the two ambient temperature conditions. I
evaluated the HMM behaviour predictions using accuracy scores generated from the
validation sets, as detailed in the last paragraph of section 2.2.1. I compared the
behaviour state proportions between the training and test sets, as well as during different
times in incubation. I used the hummingbird dataset for further testing of the HMM
21
Figure 3. Cumulative number of eggs recorded per condition for all pairs in Trial 1, 30
°C shown in red with a sample of 16 pairs, 14 °C shown in blue with a sample of 12 pairs.
Days as recorded by first egg laid, the same day for both conditions. The number of eggs
recorded are only shown prior to first hatchling. The 14 °C condition hatched earlier than
the 30 °C, which is why the red bars continue further than the blue. The total number of
pairs with successful hatchlings was significantly higher in the 30 °C condition than the
14 °C condition (χ2
22
Chapter 3: Results
3.1 Zebra finch incubation
3.1.1 Trial 1
Eight pairs out of 34 had no eggs, (2 out of 17 in 30 °C condition), 14 pairs
produced eggs without hatchlings (6 in 30 °C condition), and 14 (10 in 30 °C condition)
produced hatchlings during the experiment (Table 1). I did not run statistical tests on
absolute number of eggs laid, as some nests were difficult to enter without disturbing the
pair. Figure 3 shows the cumulative number of eggs laid and should be taken as an
approximation of absolute eggs laid. The cumulative number of eggs was calculated by
adding eggs recorded to a tally per pair. This led to egg counts always increasing or
plateauing as time went on, even if the absolute number of eggs decreased. The
cumulative tally was then summed with the rest of the pairs in each respective ambient
temperature condition. The cumulative number of eggs laid between the two ambient
temperature condition is similar (Figure 3).The 30 °C condition had significantly more
hatchlings than the 14 °C condition, as tested by a chi-square test of proportions (χ2 1 =
4.2, p = .04). The 30 °C condition incubated significantly longer than the 14 °C
condition, as tested with a Mann-Whitney test (Figure 4, first column) (z = -3.41, p =
.0003). Including only pairs that successfully hatched eggs, the trend of the pairs in the 30
°C condition taking more days to incubate persists (Figure 4). There were significantly
more pairs in the 30 °C condition with hatchlings than the 14 °C condition, and those
pairs needed significantly more time to incubate in Trial 1.
3.1.2 Trial 2
Two pairs had no eggs, (two in 30 °C condition), nine pairs produced eggs
without hatchlings (two in 30°C condition), and 23 (13 in 30 °C condition) produced
hatchlings during the experiment. No difference in number of successful hatchlings was
found between the two ambient temperature conditions for Trial 2, as tested by a
23
Trial 2 had significantly more pairs that had successful hatchlings, as tested by a
chi-square test of proportions (χ21 = 5.8, p = .02). The number of incubation days to
hatch in Trial 2 showed the reverse trend that Trial 1 showed, with 14 °C pairs taking
significantly longer than 30 °C pairs to hatch an egg, as tested by a Mann-Whitney test
(Figure 4, second column, Figure 5) (z = -1.61, p = .05).
To test the effects of ambient temperature and breeding experience on hatching
success, I ran an 2x2x2 ANOVA with Trial 1condition (30 °C or 14 °C), Trial 2 (30 °C or
14 °C), and hatchling success in Trial 1 (yes or no) as fixed effects, with an interaction
between temperature condition in Trial 1 and temperature condition in Trial 2 included.
The dependent variable I was interested in was the incubation duration, the number of
days from first egg laid to first egg hatched. The results of the ANOVA were that Trial 1
hatchling success and Trial 2 temperature condition had significant effects; F(1,27), p =
.0056, F(1,27), p = .03. Successful pairs in Trial 1 had shorter incubation durations in
Trial 2 than birds that were unsuccessful in Trial 1 (see Figure 6). Birds that incubated at
30°C in Trial 2 had shorter incubation durations than birds that incubated at 14°C (See
Figure 4). Ambient temperature condition 1 trended towards a significant main effect;
F(1,27), p = .07. The interaction between Trial 1 and Trial 2 was not significant; F(1,27)
p = .69. There should be some caution taken when interpreting these results, as some
24
Reproductive success per trial and condition
Trial Number
Condition Number of pairs with no eggs
Number of pairs with only eggs
Number of pairs with hatchlings
Total number of pairs
Trial 1 30 °C 2 6 10 18 *
14 °C 6 8 4 18 *
Trial 2 30 °C: 30 °C 1 8 9
30 °C: 14 °C 2 6 8
14 °C: 30 °C 2 1 5 8
14 °C: 14 °C 4 3 7
Total numbers for Trial 2
30 °C 2 2 13 17 *
14 °C 0 7 10 15 *
Table 1: Developmental stages that pairs arrived at by the end of each trial. * One pair
from Trial 1 in the 30 °C and three pairs from Trial 1 in the 14 °C condition were
excluded from analyses as one individual of the pair died, and therefore the pair could not
25
Figure 4. Incubation duration in days for each temperature condition. Trial 1 first
column; Trial 2 second column. Bottom row is solely successful pairs. In Trial 1, pairs
incubated significantly longer in the 30 °C condition as compared to the 14 ° C condition
(z = -3.41, p = .0003). In Trial 2 they incubated longer in the 14 °C condition (z = -1.61,
p = .05). The successful pairs show the same trend as the rest of the pairs.
26
Figure 5. Cumulative number of eggs laid for Trial 2. Red shows eggs laid for the 30 °C
condition, blue shows eggs laid in the 14 °C condition, both have a sample of 17 pairs per
condition. The 14 °C condition laid earlier and more than the 30 °C condition. The 30 °C
condition hatched prior to the 14 °C condition, which is why the blue bars continue
27
To determine how Trial 1 hatchling success might have reduced Trial 2
incubation duration, I calculated mean nest temperature in Trial 2 at each time point
throughout the day for each pair for all days of incubation for unsuccessful pairs and
successful pairs for Trial 2. I did this separately for ambient temperature condition. The
result was that birds successful in Trial 1, incubated at higher temperatures in Trial 2 than
the unsuccessful pairs in Trial 1, irrespective of ambient temperature condition in Trial 2
as seen in an example of a representative incubation day (Figure 7).
As the nest temperature dataset was large, (~ 50,000 data points per ambient
temperature condition), I used the whole distribution to see trends. The distributions of
nest temperatures in Trial 2 for successful and unsuccessful birds from Trial 1 within the
same temperature condition look quite different, with the unsuccessful birds having a
peak in temperature around ambient temperature, whereas the successful birds have no
such peak (Figure 8). The spread of nest temperatures is much higher in the 14 °C
condition than the 30 °C (Figure 9). For nest temperature distributions for Trial 1 nest
temperatures and separated by the success in Trial 1; and nest temperatures for Trial 2
and separated by the success in Trial 2 (as compared to Figure 8 where the success in
28
Figure 6. Mean values of incubation duration in Trial 2 for each of the ambient
temperature groups, separated by previous hatchling success in Trial 1. The prediction
was that pairs that had experience in the same ambient temperature condition, would need
the same or less time to incubate and hatch offspring. Translating the prediction to the
graph, I would expect the blue and red bars to be shorter than the green and orange bars,
respectively. Although the 30 °C:30 °C and 30 °C:14 °C follow this pattern, the 14 °C:14
°C does not. The lack of significant effect in the ANOVA furthers the conclusion that at
this sample size, there is likely not an experience effect. Hatchling success and ambient
temperature condition in Trial 2 both had significant main effects on incubation duration
29
Figure 7. Mean incubation temperature as measured by the iButton for every pair and
time point, for a representative incubation day. The temperatures for the whole incubation
period is visualized in Figure 8,9. Pairs that were successful are shown in dark red and
dark blue, with unsuccessful shown in light red and light blue (30 °C, and 14 °C,
respectively). Successful pairs from Trial 1 maintain a higher temperature in the nest in
30
Figure 8. Nest temperature distributions for 30 °C and 14 °C for Trial 2, successful and
unsuccessful from Trial 1 (top successful, bottom unsuccessful). Unsuccessful pairs have
distributions with a large peak around ambient temperature. Density plots can be thought
of as smoothed histograms. See Appendix C for successful and unsuccessful pairs from
Trial 1 and the effect of success of Trial 2. Density plots have the number, in this case
temperature value on the x-axis, and the y-axis has the probability density function of the
kernel density estimation (Koehrsen, 2018). For more information, see
31
Figure 9. Distributions of temperature recordings for all pairs per condition, 30 °C in red,
14 °C in blue. Both distributions are significantly not normal (Anderson-Darling value of
573) and are visually quite different from each other, with the 30 °C nest temperature
recordings having a narrow range of temperatures recorded, whereas the 14 °C is more
dispersed. See Appendix C for a comparison of Trial 1 and Trial 2 complete temperature