Light meson spectroscopy at BESIII
Tianjue Min1,
for the BESIII Collaboration
1Institute of High Energy Physics, Beijing 100049, People’s Republic of China
Abstract. The BESIII collaboration has collected a sample of 1.311 billionJ/ψevents since 2009. In this talk, we will introduce four recent analyses on light meson
spec-troscopy at BESIII, including two studies on theX(1835) and two partial wave analyses
that are related to searching for and studying glueball candidates.
1 Introduction
Quantum Chromodynamics is one of the fundamental theories in modern high energy physics. Light meson spectroscopy plays a crucial role in examining and understanding the QCD theory in
non-pertubative energy region. Decays of theJ/ψmeson, being the lowest lying 1−−cc¯states, provide an
ideal laboratory for light meson spectroscopy.
The BESIII detector collected 225 millionJ/ψevents in 2009 and 1.086 billionJ/ψevents in 2012,
which gives us a very good opportunity to study light mesons throughJ/ψdecays. In this presentation,
we will introduce some recent results from BESIII that are related to light meson spectroscopy.
2 Recent results from BESIII
2.1 Observation ofX(1835)inJ/ψ→γK0
SKS0η
The stateX(1835) was first observed by the BESII experiment as a peak in theηπ+π−invariant mass
distribution inJ/ψ → γηπ+π−decays [1]. This observation was later confirmed by BESIII studies
of the same process [2] with a mass and width measured to be M = 1836.5±3+5.6
−2.1 MeV/c2 and Γ = 190±9+38
−36 MeV/c2. An anomalously strong enhancement at the proton-antiproton (pp¯) mass
threshold, dubbedX(pp¯), was first observed by BESII inJ/ψ→γpp¯decays [3]; this observation was
confirmed by BESIII [4] and CLEO [5]. This enhancement structure was subsequently determined to
have spin-parityJP =0−by BESIII [6]. Among the various theoretical interpretations on the nature
of theX(1835) andX(pp¯), a particularly intriguing one suggests that the two structures originate from
app¯bound state [7–10].
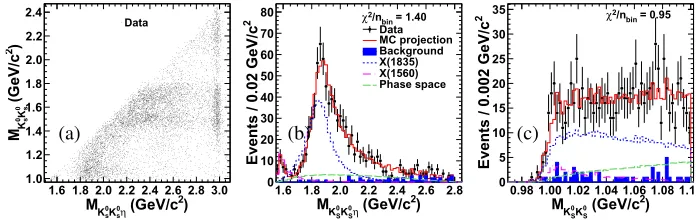
To understand the nature of theX(1835), it is crucial to measure its JPC and to search for new
decay modes. Recently, BESIII analyzed theJ/ψ → γK0
SK0Sη process with 1.311 billion J/ψdata
sample collected since 2009 [11]. The scatter plot of the invariant mass ofK0
SKS0 versus that of
K0
SKS0η is shown in Fig. 1(a). A clear accumulation of events is seen around the intersection of the
f0(980) onMK0
SKS0 and the structure around 1.85 GeV/c
2onM
K0
SKS0η. This indicates that the structure
around 1.85 GeV/c2is strongly correlated with thef
0(980). A partial wave analysis (PWA) of events
satisfyingMK0
SK0Sη<2.8 GeV/c
2andM
K0
SK0S <1.1 GeV/c
2is performed to determine the parameters
of the structure around 1.85 GeV/c2. The K0
SKS0ηandKS0KS0 mass spectra are shown in Fig. 1(b)
and (c). The PWA fit requires a contribution fromX(1835)→ KS0KS0ηwith a statistical significance
greater than 12.9σ, where the X(1835) → K0SK0Sη is dominated by f0(980) production. The spin
parity of theX(1835) is determined to be 0−+, which is significantly better than the 1++ or 2−+
hy-potheses. The mass and width of theX(1835) are measured to be 1844±9(stat)+−1625(syst) MeV/c2and
192+20
−17(stat)+
62
−43(syst) MeV/c
2, respectively. The corresponding product branching fraction is
mea-sured to be (3.31+0.33
−0.30(stat)+
1.96
−1.29(syst))×10−
5. The mass and width of theX(1835) are consistent with
the values obtained from the decayJ/ψ→ γηπ+π−by BESIII [1]. Another 0−+state, theX(1560),
also is observed in data with a statistical significance larger than 8.9σand is seen to interfere with the
X(1835). The mass and width of theX(1560) are consistent with those of theη(1405) andη(1475)
as given in [12] within 2.0σand 1.4σ, respectively. Present statistics do not allow us to conclusively
determine if theX(1560) is the same state as theη(1405)/η(1475) or a new meson.
)
2
(GeV/c η s 0
K
s 0
K
M
1.6 1.8 2.0 2.2 2.4 2.6 2.8 3.0
)
2
(GeV/c s
0
Ks
0
K
M
1.0 1.2 1.4 1.6 1.8 2.0 2.2 2.4
Data
)
2
(GeV/c η S 0
K
S 0
K
M
1.6 1.8 2.0 2.2 2.4 2.6 2.8
2
Events / 0.02 GeV/c
0 10 20 30 40 50 60 70
80 = 1.40
bin
/n
2
χ Data MC projection Background X(1835) X(1560) Phase space
)
2
(GeV/c
S 0
K
S 0
K
M
0.98 1.00 1.02 1.04 1.06 1.08 1.1
2
Events / 0.002 GeV/c
0 5 10 15 20 25 30
35 = 0.95
bin
/n
2
χ
(a) (b) (c)
Figure 1. (a) Scatter plot ofMK0
SK0S versus that ofMK0SK0Sη; (b) and (c) are the comparisons of invariant mass
distributions ofK0
SK0SηandKS0KS0between data and PWA fit projections.
2.2 Anomalous line shape ofηπ+π−near the pp¯mass threshold inJ/ψ→γηπ+π−
From Sect. 2.1 we know that theX(1835) has the sameJPCnumber as theX(pp¯) does. If theX(1835)
is really app¯bound state, it should have a strong coupling to 0− pp¯systems, in which case the line
shape of theX(1835) at thepp¯mass threshold would be affected by the opening of theX(1835)→pp¯
decay mode. A study of theηπ+π−line shape ofX(1835) with high statistical precision therefore
provides valuable information that helps clarify the nature of theX(1835) andX(pp¯).
With 1.086 billionJ/ψdata collected in 2012, BESIII re-analysed theJ/ψ→γηπ+π−process [13]
in which theX(1835) was observed [1, 2]. Theη is reconstructed in its two major decay modes:
η→γπ+π−andη→ηπ+π−, η→γγ. As shown in Fig. 2, we observed a significant abrupt change
in slope of theX(1835)→ηπ+π−line shape at thepp¯mass threshold. Study of background shows
this abrupt change in line shape is not caused by background processes.
A simultaneous fit to theηπ+π−mass distribution between 1.3 and 2.25 GeV/c2for both event
samples is performed. We find that a simple Breit-Wigner function cannot describe the X(1835)
line shape near thepp¯ mass threshold (Fig. 3(a)). Typically, there are two circumstances where an
)
2
] (GeV/c
-π
+
π
’
η
M[
1.4 1.6 1.8 2 2.2 2.4 2.6 2.8 3
)
2
Events / (20 MeV/c
0 500 1000 1500 2000 2500 3000 3500
4000 Data
PHSP MC Background
threshold p p
)
2
] (GeV/c
-π
+
π
’
η
M[
1.4 1.6 1.8 2 2.2 2.4 2.6 2.8 3
)
2
Events / (20 MeV/c
0 200 400 600 800 1000 1200 1400 1600
Data PHSP MC Background
threshold p p
Figure 2. Theηπ+π−invariant mass spectra after the application of all selection criteria. The plot on the left
side shows the spectrum for events with theη →γπ+π−channel, and that on the right shows the spectrum for
theη→ηπ+π−, η→γγchannel.
an additional decay mode, or interference between two resonances. We try to fit the data for both of these possibilities.
In the first model, we assume the state around 1.85 GeV/c2 couples to the pp¯ and use a Flatté
formula [14] to describe theX(1835) line shape:
T =
√ρ
out
M2−s−i
kg2kρk
≈
√ρ
out
M2−s−ig2
0
ρ0+
g2 pp¯
g2 0
ρpp¯
(1)
Here,T is the decay amplitude, √ρoutis the phase space forJ/ψ→γηπ+π−,Mis a parameter with
the dimension of mass,sis the square of theηπ+π−system’s mass,ρkis the phase space for decay
modek, and g2k is the corresponding coupling strength. The termkg2kρk describes how the decay
width varies withs, and can be replaced byg20
ρ0+
g2 pp¯
g2 0
ρpp¯
approximately, whereg20is the sum ofg2
of all decay modes other than theX(1835) → pp¯,ρ0 is the maximum two-body decay phase space
volume [12], andg2
pp¯/g20is the ratio between the coupling strength to thepp¯channel and the sum of
all other channels. The fit results for this model are shown in Fig. 3(b). The Flatté model fit yields
M=1638.0±121.9(stat)−+254127..83(syst) MeV/c2,g20 =93.7±35.4(stat)+−4743..69(syst) (GeV/c2)2,g2pp¯/g20 =
2.31±0.37(stat)+0.83
−0.60(syst), a product branching fraction ofB(J/ψ→γX)·B(X→ηπ+π−)=(3.93±
0.38(stat)+0.31
−0.84(syst))×10−4. The value ofg2pp¯/g20implies that the couplings between the state around
1.85 GeV/c2and the pp¯final states is very large, the significance ofg2
pp¯/g20being non-zero is larger
than 7σ. Following the definitions given in [15], the pole nearest to thepp¯mass threshold is found to
beMpole=1909.5±15.9(stat)−+927.4.5(syst) MeV/c2andΓpole=273.5±21.4(stat)−+646.1.0(syst) MeV/c2. In
this fit, an additional Breit-Wigner resonance (denoted as “X(1920)” in Fig. 3(b)) is needed with 5.7σ
statistical significance.
In the second model, we assume the existence of a narrow resonance near the pp¯ threshold and
that the interference between this resonance and the X(1835) produces the line shape distortion.
Here we denote this narrow resonance as “X(1870).” For this case we represent the line shape in
the vicinity on 1835 MeV/c2 by the square ofT, which is the coherent sum of two Breit-Wigner
amplitudes. The fit results for this model are shown in Fig. 3(c). TheX(1835) mass is 1825.3±
2.4(stat)+17.3−2.4(syst) MeV/c2and width is 245.2±13.1(stat)+−49..66(syst) MeV/c
2; TheX(1870) mass
is 1870.2±2.2(stat)+2.3
−0.7(syst) MeV/c
2and width is 13.0±6.1(stat)+2.1
−3.8(syst) MeV/c
2, with a statistical
)
2
] (GeV/c
-π
+
π
’
η
M[
1.3 1.4 1.5 1.6 1.7 1.8 1.9 2 2.1 2.2
)
2
Events / (10 MeV/c
0 500 1000 1500 2000
Data Global Fit
(1510)
1
f X(1835) X(2120) Non-Resonant Background
threshold p p
1.8 1.85 1.9 1.95 1000
1200 1400 1600
)
2
] (GeV/c
-π
+
π
’
η
M[
1.3 1.4 1.5 1.6 1.7 1.8 1.9 2 2.1 2.2
)
2
Events / (10 MeV/c
0 500 1000 1500 2000
Data Global Fit
(1510)
1
f X(1835) X(1920) X(2120) Non-Resonant Background
threshold p p
1.8 1.85 1.9 1.95 1000
1200 1400 1600
)
2
] (GeV/c
-π
+
π
’
η
M[
1.3 1.4 1.5 1.6 1.7 1.8 1.9 2 2.1 2.2
)
2
Events / (10 MeV/c
0 500 1000 1500 2000
Data Global Fit
(1510)
1
f X(1835)+X(1870) X(2120) Non-Resonant Background
threshold p p
1.8 1.85 1.9 1.95 1000
1200 1400 1600
(a) (b) (c)
Figure 3.Fit results of using (a) simple Breit-Wigner formula; (b) the Flatté formula; (c) coherent sum of two Breit-Wigner amplitudes.
which only differ in branching fractions of the two Breit-Wigner functions with each other [16]. The
product branching fractions with constructive interference areB[J/ψ → γX(1835)]·B[X(1835) →
ηπ+π−] = (3.01±0.17(stat)+0.26
−0.28(syst))×10−4 andB[J/ψ → γX(1870)]·B[X(1870) → ηπ+π−] =
(2.03±0.12(stat)+0.18
−0.35(syst))×10−7, while the solution with destructive interference givesB[J/ψ→
γX(1835)]·B[X(1835) → ηπ+π−] = (3.72 ± 0.21(stat)+0.43
−0.70(syst)) × 10−4, and B[J/ψ →
γX(1870)]·B[X(1870)→ηπ+π−]=(1.57±0.09(stat)+0.49
−0.86(syst))×10−5. In this model, theX(1920)
is not included in the fit because its significance is just 3.9σ.
With current data, both models fit the data well with fit qualities, more sophisticated models such as a mixture of above two models cannot be ruled out. But both fits do suggest the existence of either
app¯molecule-like or bound state.
2.3 Model independent partial wave analysis ofJ/ψ→γπ0π0
TheJ/ψradiative decays to two pesudoscalars are very important channels for identifying scalar and
tensor glueballs. Recently, BESIII studied theJ/ψ→γπ0π0process with model independent partial
wave analysis [17]. In the PWA result, two types of ambiguities are present. Trivial ambiguities arise
due to the possibility of the overall amplitude in each bin to be rotated byπor to be reflected over
the real axis in the complex plane. These may be partially addressed by applying a phase convention to the results of the fits. Non-trivial ambiguities arise from the freedom of amplitudes with the same
quantum numbers to have different phases. The non-trivial ambiguities represent a greater challenge
to the analysis and cannot be eliminated without introducing model dependencies. The intensity for
each amplitude as a function ofMπ0π0is shown in Fig. 4. For 2++contributions, the phase differences
with respect to the reference amplitude (2++E1), is constrained to be real. Above theKK¯ threshold,
two distinct sets of solutions are apparent in most bins as expected. These results may be combined with those of similar reactions for a more comprehensive study of the light scalar meson spectrum.
The branching fraction of radiativeJ/ψdecays toπ0π0is measured to be (1.15±0.05)×10−3, where
the error is systematic only and the statistical error is negligible. This is the first measurement of this branching fraction.
2.4 Partial wave analysis ofJ/ψ→γφφ
The mass of the lowest lying pseudoscalar glueball is predicted to be around 2.3−2.6 GeV/c2 by
2
Events / 15 MeV/c
0.5 1 1.5 2 2.5 3
0 5000 10000 15000 20000 25000 30000
]
2
) [GeV/c
0
π
0
π Mass(
2
Events / 15 MeV/c
0.5 1 1.5 2 2.5 3
0 2000 4000 6000 8000 10000 12000 14000 16000
]
2
) [GeV/c
0
π
0
π Mass(
2
Events / 15 MeV/c
0.5 1 1.5 2 2.5 3
0 500 1000 1500 2000 2500 3000 3500 4000 4500
]
2
) [GeV/c
0
π
0
π Mass(
2
Events / 15 MeV/c
0.5 1 1.5 2 2.5 3
0 2000 4000 6000 8000 10000 12000 14000 16000 18000
]
2
) [GeV/c
0
π
0
π Mass( (a) 0++
(b) 2++ E1
(c) 2++ M2
(d) 2++ E3
Figure 4. The intensities for the (a) 0++, (b) 2++ E1, (c) 2++M2 and (d) 2++E3 amplitudes. The solid black
markers show the phase differences calculated from one set of solutions, while the open red markers represent
the ambiguous partner solutions.
2 GeV/c2. TheJ/ψradiative decays to two vector particles processes provide opportunities to study
pseudoscalar particles. Recently, BESIII studied the J/ψ → γφφ process with a PWA [21]. The
results are shown in Fig. 5. 0−+states are dominant components in the PWA solution. The
exis-tence of theη(2225) is confirmed and two additional pseudoscalar states,η(2100) with a mass of
230+64
−35(stat)+−7726(syst) MeV/c2and a width of 250−+3630(stat)+−187164(syst) MeV/c2, andX(2500) with a mass
of 2470+15
−19(stat)+−6323(syst) MeV/c2 and a width of 230−+6435(stat)+−5333(syst) MeV/c2, are obtained. The
new experimental results are helpful for mapping out pseudoscalar excitations and searching for a 0−+
glueball. The three tensors f2(2100), f2(2300), and f2(2340) which were observed inπNscattering
are also observed inJ/ψ→γφφ.
3 Summary
With the largestJ/ψdata sample in the world, the BESIII collaboration has significant contributions in
light meson spectroscopy. For the first time, theX(1835) is determined to be a 0−+state; an anomalous
line shape ofX(1835)→ηπ+π−at thepp¯mass threshold is observed, which suggests the existence of
app¯molecule like or bound state; sophisticated model independent PWA ofJ/ψ→γπ0π0improves
our understanding of the rich structures in theππsystem and provides valuable comparison with the
ηη[22] andKK(both model dependent and independent PWA are ongoing at BESIII) systems; theφφ
) 2 ) (GeV/c
φ φ
M( 2 2.2 2.4 2.6
2
Entries/ 20 MeV/c
0 1000 2000
Data-bkg MC projection
=1.09
bin
/n
2
χ
(a)
)
γ
(
θ
cos -1 -0.5 0 0.5 1
Entries/ 0.01
0 1000 2000 3000
=0.71
bin
/n
2
χ
(b)
) 1
φ
(
θ
cos -1 -0.5 0 0.5 1
Entries/ 0.01
0 1000 2000 3000
=2.01
bin
/n
2
χ
(c)
) + 1 (K
θ
cos -1 -0.5 0 0.5 1
Entries/ 0.01
0 1000 2000 3000
=1.55
bin
/n
2
χ
(d)
)
°
(
χ
0 20 40 60 80
°
E
n
tr
ies
/
3
0 1000 2000
=1.69
bin
/n
2
χ
(e)
) 2 ) (GeV/c
φ φ
M( 2 2.2 2.4 2.6
2
Entries/ 20 MeV/c
0 500 1000 1500 2000
2500 -+ model independent 0
model dependent -+ 0
model independent ++ 0
model dependent ++ 0
model independent ++ 2
model dependent ++ 2 (f)
Figure 5. Superposition of data and the PWA fit projections for: (a) invariant mass distributions ofφφ; (b)
cosθofγin theJ/ψrest frame; (c) cosθofφ1 in theXrest frame; (d) cosθofK+in theφ1rest frame; (e) the
azimuthal angle between the normals to the two decay planes ofφin theXrest frame; (f) Intensities of individual
JPCcomponents.
References
[1] M. Ablikimet al.(BES Collaboration), Phys. Rev. Lett.95, 262001 (2005)
[2] M. Ablikimet al.(BESIII Collaboration), Phys. Rev. Lett.106, 072002 (2011)
[3] J. Z. Baiet al.(BES Collaboration), Phys. Rev. Lett.91, 022001 (2003)
[4] M. Ablikimet al.(BESIII Collaboration), Chin. Phys. C34, 421 (2010)
[5] J. P. Alexanderet al.(CLEO Collaboration), Phys. Rev. D82, 092002 (2010)
[6] M. Ablikimet al.(BESIII Collaboration), Phys. Rev. Lett.108, 112003 (2012)
[7] S. L. Zhu and C. S. Gao, Commun. Theor. Phys.46, 291 (2006)
[8] J. P. Dedonder, B. Loiseau, B. El-Bennich, and S. Wycech, Phys. Rev. C80, 045207 (2009)
[9] C. Liu, Eur. Phys. J. C53, 413 (2008)
[10] Z. G. Wang and S. L. Wan, J. Phys. G34, 505 (2007)
[11] M. Ablikimet al.(BESIII Collaboration), Phys. Rev. Lett.115, 091803 (2015)
[12] K. A. Oliveet al.(Particle Data Group), Chin. Phys. C38, 090001 (2014)
[13] M. Ablikimet al.(BESIII Collaboration), Phys. Rev. Lett.117, 042002 (2016)
[14] S. M. Flatté, Phys. Lett. B63, 224 (1976)
[15] B. S. Zou and D. V. Bugg, Phys. Rev. D48, R3948 (1993)
[16] K. Zhu, X. H. Mo, C. Z. Yuan, and P. Wang, Int. J. Mod. Phys. A26, 4511 (2011)
[17] M. Ablikimet al.(BESIII Collaboration), Phys. Rev. D92, 052003 (2015)
[18] G. S. Baliet al.(UKQCD Collaboration), Phys. Lett. B309, 378 (1993)
[19] C. J. Morningstar and M. Peardon, Phys. Rev. D60, 034509 (1999)
[20] Y. Chenet al., Phys. Rev. D73, 014516 (2006)
[21] M. Ablikimet al.(BESIII Collaboration), Phys. Rev. D93, 112011 (2016)