Electronic Thesis and Dissertation Repository
4-18-2013 12:00 AM
Biofilm Control in a Fludized Bed Bioreactor (FBBR) Treating
Biofilm Control in a Fludized Bed Bioreactor (FBBR) Treating
Municipal Wastewater: Optimization, Modeling, and Nitrous Oxide
Municipal Wastewater: Optimization, Modeling, and Nitrous Oxide
(N2O) Emissions
(N2O) Emissions
Ahmed Eldyasti
The University of Western Ontario
Supervisor
Dr. George Nakhla
The University of Western Ontario Joint Supervisor Dr. Jesse Zhu
The University of Western Ontario
Graduate Program in Civil and Environmental Engineering
A thesis submitted in partial fulfillment of the requirements for the degree in Doctor of Philosophy
© Ahmed Eldyasti 2013
Follow this and additional works at: https://ir.lib.uwo.ca/etd
Part of the Civil Engineering Commons, and the Environmental Engineering Commons
Recommended Citation Recommended Citation
Eldyasti, Ahmed, "Biofilm Control in a Fludized Bed Bioreactor (FBBR) Treating Municipal Wastewater: Optimization, Modeling, and Nitrous Oxide (N2O) Emissions" (2013). Electronic Thesis and Dissertation Repository. 1200.
https://ir.lib.uwo.ca/etd/1200
This Dissertation/Thesis is brought to you for free and open access by Scholarship@Western. It has been accepted for inclusion in Electronic Thesis and Dissertation Repository by an authorized administrator of
BIOFILM CONTROL IN A FLUIDIZED BED BIOREACTOR (FBBR)
TREATING MUNICIPAL WASTEWATER: OPTIMIZATION,
MODELING, AND NITROUS OXIDE (N
2O) EMISSIONS
(Thesis format: Integrated-Article)
By
Ahmed Eldyasti
Graduate Program in Civil and Environmental Engineering
A thesis submitted in partial fulfillment of the requirements for the degree of
Doctor of Philosophy
Department of Civil and Environmental Engineering School of Graduate and Postdoctoral Studies
The University of Western Ontario London, Ontario Canada
ii
ABSTRACT
Among the various biological wastewater treatment processes for industrial and
municipal wastewater treatment, fluidized bed bioreactors (FBBR) demonstrate numerous
advantages compared to suspended growth systems such as lower hydraulic retention time,
high surface area and accordingly high biomass retention time, higher volumetric
conversion rates, lower sensitivity to temperature, and less sludge production. Despite the
numerous biofilm bioreactor configurations and system schemes that are currently available
for a wide variety of environmental applications, the development and optimization of a
stable biofilm that is capable of offering effective and integrated functions, i.e.
biodegradation, biomass-liquid separation, and biomass retention along with a substantial
reduction of nitrous oxide (N2O) emissions is still challenging.
To achieve this goal, this work addresses four separate but interconnected projects
with a focus on denitrifying biofilm in FBBR. First, biofilm morphology and structure was
investigated by changing the media properties, i.e. sphericity, surface roughness, and
specific surface area. Four different types of media (natural and artificial) were tested and it
was found that particles with sphericity of 0.9 (multi-blast plastic (MB) and natural zeolite
(NZ)) maintained a fluffy protruding biofilm and achieved slightly higher nutrient removal
efficiencies as compared to particles with a sphericity of 0.5 (maxi-blast plastic (MX) and
lava rock (LR)), which exhibited a patchy biofilm at low COD-to-nitrogen (COD/N) ratio.
The second study explored divalent cation dosage (i.e. calcium (Ca2+)) as a novel
methodology to change and control the biofilm thickness, morphology, and structure in
denitrifying FBBRs as well as enhance biofilm strength. The DFBBRs were operated on a
iii
240 mg Ca2+/L at two different COD/N ratios of 5 and 3.5. It was found that Ca2+
concentrations played a significant role in biofilm morphology with the detachment rates for
R120Ca,R180Ca,and R240Ca 90% and 70% lower than for R20Ca and R60Ca, respectively. The
optimum influent Ca2+ concentration at both organic and nitrogen loading rates was 120 mg
Ca2+/L, with higher concentrations exhibiting fractured and weak biofilms.
The third study involved the use of the developed methodology to mitigate N2O
emissions from denitrification processes. It was found that the N2O conversion rate at
typical municipal wastewater Ca2+ concentration (R60Ca) was about 0.53% of the influent
nitrogen loading, whereas the N2O conversion rates for R120Ca,R180Ca,and R240Ca were 0.34%,
0.42%, and 0.41%, respectively. At the higher nitrogen loading, the N2O conversion rate of
R60Ca increased three folds to 1.57% of the influent nitrogen loading.
Finally, a biofilm calibration protocol was developed for biofilm one-dimensional
(1-D) fully dynamic and steady-state biofilm simulation models. The developed calibration
protocol sets a complete strategy to model particulate biofilm reactors and proposes a
method to collect the data and translate it to useful information. The detailed calibration
procedures presented here will not only help the process engineers design and retrofit plants
but also plan sampling and monitoring requirements for process optimization. Sensitivity
analysis was also used to identify the most important biofilm parameters and guide
experimental measurements.
Keywords: Fluidized Bed Biofilm Reactor, Biological Nutrient Removal (BNR),
Nitrification, Denitrification, Biofilm, Nitrous Oxide (N2O) emissions, Biofilm model,
iv
CO-AUTHORSHIP
Chapter 2: Denitrification: Processes, Regulation and Ecological Significance
Mehran Andalib, Ahmed Eldyasti, George Nakhla, Jesse Zhu
Published in Nova Publisher, ISBN: 978-1-61470-879-7
Ahmed Eldyasti was the secondary author and responsible for the scientific and writing for
the book chapter. The work was under the supervision of Professor Nakhla and Professor
Zhu.
Chapter 4: Influence of Particles Properties on Biofilm Structure and Energy Consumption
in Denitrifying Fluidized Bed Bioreactors (DFBBRs)
Ahmed Eldyasti, George Nakhla, Jesse Zhu
Published in Bioresource Technology, 126, 162-171
The primary author of this chapter was Ahmed Eldyasti under the supervision of Professor
Nakhla and Professor Zhu.
Chapter 5: Impact of calcium on Biofilm Morphology, Structure, Detachment and
Performance in Denitrifying Fluidized Bed Bioreactors (DFBBRs)
Ahmed Eldyasti, George Nakhla, Jesse Zhu
Under peer review Chemical Engineering Journal, CEJ-D-13-00442
The primary author of this chapter was Ahmed Eldyasti under the supervision of Professor
v
Chapter 6: Nitrous Oxide (N2O) Emissions from Denitrifying Fluidized Bed Bioreactors
(DFBBRs)
Ahmed Eldyasti, George Nakhla, Jesse Zhu
Under peer review Chemosphere, CHEM28551
The primary author of this chapter was Ahmed Eldyasti under the supervision of Professor
Nakhla and Professor Zhu.
Chapter 7: Mitigation of Nitrous Oxide (N2O) Emissions from Biological Denitrification
Process in Fluidized Bed Bioreactors (FBBRs) using divalent cations
Ahmed Eldyasti, George Nakhla, Jesse Zhu
Under peer review Environmental Science & Technology (ES&T)
The primary author of this chapter was Ahmed Eldyasti under the supervision of Professor
Nakhla and Professor Zhu.
Chapter 8: Biological Nutrient Removal from Leachate Using a Pilot Liquid-Solid
Circulating Fluidized Bed Bioreactor (LSCFB).
Ahmed Eldyasti, George Nakhla, Jesse Zhu
Published in Journal of Hazardous Materials, 181 (1-3), 289-297
The primary author of this chapter was Ahmed Eldyasti under the supervision of Professor
Nakhla and Professor Zhu.
Chapter 9: Comparative Modeling of Biological Nutrient Removal from Landfill Leachate
using a Circulating Fluidized Bed Bioreactor (CFBBR)
vi
Published in Journal of Hazardous Materials, 187 (1-3), 140-149
The primary author of this chapter was Ahmed Eldyasti under the supervision of Professor
Nakhla and Professor Zhu.
Chapter 10: Development of a Calibration Protocol and Identification of the Most Sensitive
Parameters for the Particulate Biofilm Models Used in Biological Wastewater Treatment
Ahmed Eldyasti, George Nakhla, Jesse Zhu
Published in Bioresource Technology, 111, 111-121
The primary author of this chapter was Ahmed Eldyasti under the supervision of Professor
vii
ACKNOWLEDGEMENT
First and foremost, I would like to thank Allah, the almighty, who blessed me with the
strength and knowledge to fulfill my ambitions, and to achieve this work.
I would like to express my sincere gratitude and appreciation to my supervisors, Prof.
George Nakhla and Prof. Jesse Zhu for their patience, guidance, and continuous support.
Special thanks must go to Prof. Nakhla for his constructive criticisms and endless help
throughout this work and to Prof. Zhu for his utmost attention to my professional
development and challenging me to achieve higher goals. It was a substantial milestone in
my career when I joined your research groups. I have changed my science views and my
ways of doing research very much. I have been very lucky being your student. Thank you.
I sincerely acknowledge and thank my fellow colleagues, Dr. Hisham Hafez, Dr.
Elsayed Elbeshbishy, Dr. Mehran Andalib, Dr. Nabin Chowdhury, Dr. Ming Li, and Bipro
for their encouragement, guidance, enthusiasm, patience and dedication. I would like to
convey special thanks to Mr.Wen, Michael Zhu, and George Zhang, and Whitney Barrett
for their guidance and assistance for this work.
I would like to thank the University of Western Ontario, Natural Sciences and
Engineering Research Council of Canada (NSERC), Ontario Centre of Excellence (OCE),
The Government of Ontario, Ontario Graduate Scholarship (OGS), and Trojan
Technologies, and City of London for their financial support of my studies and research.
Finally reaching the end of what seemed to be a never ending journey, I would like
to express my deepest appreciation and sincere gratitude to my parents for their moral
viii
would like to express heartfelt appreciation to my wife, Amira, for her endless love, kind
understanding, and support. To my gorgeous kids, Fayrouz and Omar, thanks for bringing
endless joy and inspiration to your father’s life.
ix
I
N THE NAME OF'A
LLAH'- L
ORD OF THEW
ORLDS,
THEM
OSTM
ERCIFUL ANDTHE
M
OSTB
ENEVOLENTDEDICATION
To my parents for their inspiration
To my beloved wife, Amira, for her love, patience, and support
To my Kids, Fayrouz and Omar, for the best feeling ever they gave to me
And
x
Table of Content
Abstract ... ii
Acknowledgments ... vii
Dedication ...ix
Table of Contents ...x
List of Tables ... xvii
List of Figures ... xix
List of Abbreviations and Symbols... xxii
CHAPTER 1! INTRODUCTION ... 1!
1.1! Background ... 1!
1.2! Problem Statement ... 3!
1.3! Objectives ... 3!
1.4! Thesis Organization ... 4!
1.5! Contribution of Thesis ... 6!
1.6! References ... 6!
CHAPTER 2! LITERATURE REVIEW ... 9!
2.1! Introduction ... 9!
2.2! Biological Nutrient Removal ... 10!
2.2.1! Kinetic Models For Biological Nitrogen Removal ... 12!
2.2.1.1!Nitrification Kinetics ... 12!
2.2.1.2!Denitrification Kinetics ... 16!
2.2.2! Nitrification and Denitrification Microbial Communities ... 18!
2.3! Emerging Biological Nutrient Removal Processes ... 18!
2.4! Nitrification/Denitrification Particulate Biofilm Technologies ... 22!
2.4.1! Biofilm Airlift Suspension (BAS®) Reactor ... 23!
2.4.2! Internal Circulation Reactor (IC®) ... 24!
2.4.3! CIRCOX® Airlift Reactor ... 25!
2.4.4! Fluidized Bed Reactors (FBR) ... 26!
2.4.4.1!Fluidized Bed BioReactors and Wastewater ... 28!
2.4.4.2!Fluidized Bed Bioreactor characteristics ... 31!
xi
2.6! Biofilm Characteristics and Structure ... 34!
2.6.1! Biofilm Formation ... 35!
2.6.2! Biofilm Detachment ... 37!
2.7! Effect of Divalent Cations on Biofilm ... 41!
2.8! Nitrous Oxide, Greenhouse Gases, and Process Sustainability ... 43!
2.9! Mathematical Biofilm Modeling ... 49!
2.10! Synopsis of Literature Reviewed ... 52!
2.11! References ... 53!
CHAPTER 3! MATERIALS AND METHODS ... 71!
3.1! Materials ... 71!
3.1.1! Systems Description ... 71!
3.1.1.1!Pilot-Scale LSCFB ... 71!
3.1.1.2!DFBBR ... 73!
3.1.1.3!N2O-DFBBR ... 75!
3.1.1.4!MH-CFBBR ... 77!
3.1.2! Wastewater Feed ... 80!
3.1.2.1!Landfill Leachate ... 80!
3.1.2.2!Synthetic Municipal Wastewater (SMW) ... 80!
3.1.3! Particles Properties ... 82!
3.2! Methodologies ... 83!
3.2.1! Water Quality Analysis Methods ... 83!
3.2.2! Acclimatization, Startup, and Reactors Operation ... 84!
3.2.2.1!Acclimatization of LSCFB ... 84!
3.2.2.2!Acclimatization of DFBBR ... 84!
3.2.3! Batch Tests ... 85!
3.2.4! Biofilm Thickness ... 85!
3.2.5! Biofilm Strength ... 86!
3.2.6! Biofilm Morphology ... 86!
3.2.7! Biofilm Extracellular Polymeric Substances (EPS) ... 87!
3.2.8! Statistical Analysis ... 88!
3.3! Modeling and Simulation ... 88!
xii
3.3.2! Modeling using AQUIFAS® ... 89!
3.4! References ... 90!
CHAPTER 4! INFLUENCE OF PARTICLES PROPERTIES ON BIOFILM STRUCTURE AND ENERGY CONSUMPTION IN DENITRIFYING FLUIDIZED BED BIOREACTORS (DFBBRS) ... 92!
4.1! Introduction ... 92!
4.2! Materials and Methods ... 94!
4.2.1! Wastewater Characteristics ... 94!
4.2.2! Experimental Setup ... 95!
4.2.3! Particles Properties ... 98!
4.2.4! Acclimatization, Startup, and Reactors Operation ... 100!
4.2.5! Analytical Methods ... 102!
4.2.6! Batch Denitrification Tests ... 103!
4.3! Results and Discussion ... 103!
4.3.1! Physical Properties of the Support Media ... 103!
4.3.2! Nutrient Removal ... 105!
4.3.3! Overall Nutrient Mass Balances ... 108!
4.3.4! Biomass Yield ... 108!
4.3.5! Biofilm Morphology and Characteristics ... 110!
4.3.6! Energy Consumption and Running Cost ... 112!
4.4! Conclusions ... 114!
4.5! References ... 115!
CHAPTER 5! IMPACT OF CALCIUM ON BIOFILM MORPHOLOGY, STRUCTURE, DETACHMENT AND PERFORMANCE IN DENITRIFYING FLUIDIZED BED BIOREACTORS (DFBBRS) ... 119!
5.1! Introduction ... 119!
5.2! Materials and Methods ... 122!
5.2.1! Wastewater Characteristics ... 122!
5.2.2! Experimental Setup ... 123!
5.2.3! Acclimatization, Startup, and Reactors Operation ... 125!
5.2.4! Analytical Methods ... 125!
xiii
5.3! Results and Discussion ... 130!
5.3.1! DFBBRs Performance ... 130!
5.3.2! Biomass Yield ... 133!
5.3.3! Biofilm Morphology ... 136!
5.3.4! Biofilm EPS ... 140!
5.3.5! Nutrient Mass Balances ... 142!
5.3.5.1!Calcium Fate ... 145!
5.4! Conclusions ... 147!
5.5! References ... 148!
CHAPTER 6! NITROUS OXIDE (N2O) EMISSIONS FROM DENITRIFYING FLUIDIZED BED BIOREACTORS (DFBBRS) ... 152!
6.1! Introduction ... 152!
6.2! Materials and Methods ... 155!
6.2.1! System Description ... 155!
6.2.2! Acclimatization, Reactor Startup, and Operation ... 157!
6.2.3! Analytical Methods ... 157!
6.3! Results and Discussion ... 159!
6.3.1! Steady-State DFBBRs Performance ... 159!
6.3.2! N2O Emissions ... 164!
6.3.3! N2O Emissions Factor ... 165!
6.3.4! Dynamics of N2O Emissions ... 166!
6.3.5! Overall Mass Balances ... 167!
6.4! Conclusions ... 168!
6.5! References ... 169!
CHAPTER 7! MITIGATION OF NITROUS OXIDE (N2O) EMISSIONS FROM BIOLOGICAL DENITRIFICATION PROCESS IN FLUIDIZED BED BIOREACTORS (FBBRS) USING DIVALENT CATIONS ... 172!
7.1! Introduction ... 172!
7.2! Materials and Methods ... 175!
7.2.1! DFBBRs Setup ... 175!
7.2.2! Synthetic Calcium Rich Wastewater characteristics ... 176!
xiv
7.2.4! Analytical Methods ... 177!
7.2.5! Biofilm EPS ... 178!
7.2.6! Biofilm Morphology and Structure ... 179!
7.2.7! N2O Conversion and Emissions Rate Calculation Methods ... 180!
7.3! Results and Discussion ... 182!
7.3.1! Steady-State DFBBRs performance ... 182!
7.3.2! Biomass Yield ... 186!
7.3.3! Biofilm Morphology and EPS ... 187!
7.3.4! N2O Emissions ... 191!
7.3.5! N2O Emissions Factor ... 193!
7.4! Conclusions ... 193!
7.5! References ... 194!
CHAPTER 8! BIOLOGICAL NUTRIENT REMOVAL FROM LEACHATE USING A PILOT LIQUID-SOLID CIRCULATING FLUIDIZED BED BIOREACTOR (LSCFB) ... 198!
8.1! Introduction ... 198!
8.2! Materials and Methods ... 201!
8.2.1! Design and Fabrication of the LSCFB ... 201!
8.2.2! Reactor Start-up ... 204!
8.2.3! Batch Tests ... 204!
8.2.4! Analytical Methods ... 205!
8.3! Results and Discussion ... 206!
8.3.1! Organic Removal ... 206!
8.3.2! Nitrogen Removal ... 208!
8.3.3! Phosphorus Removal ... 210!
8.3.4! Sludge Yield ... 213!
8.3.5! Overall Nutrient Mass Balances ... 215!
8.4! Conclusions ... 217!
8.5! References ... 217!
xv
9.1! Introduction ... 223!
9.2! Materials and Methods ... 227!
9.2.1! Circulating Fluidized Bed Bioreactor ... 227!
9.2.2! Analytical Methods ... 230!
9.3! Modeling and Simulation ... 231!
9.3.1! Modeling Using BioWin® ... 231!
9.3.2! Modeling Using AQUIFAS® ... 232!
9.3.3! Model Implementation and Calibration ... 235!
9.4! Results and Discussion ... 237!
9.4.1! CFBBR Performance ... 237!
9.4.2! Model Calibration ... 239!
9.4.3! Steady-State CFBBR Model ... 240!
9.4.3.1!BioWin® Model ... 240!
9.4.3.2!AQUIFAS® Model ... 242!
9.4.4! Simulated Biomass Yield ... 244!
9.4.5! Nutrient Uptake Rates ... 246!
9.5! Summary and Conclusions ... 247!
9.6! References ... 248!
CHAPTER 10!DEVELOPMENT OF A CALIBRATION PROTOCOL AND IDENTIFICATION OF THE MOST SENSITIVE PARAMETERS FOR THE PARTICULATE BIOFILM MODELS USED IN BIOLOGICAL WASTEWATER TREATMENT ... 253!
10.1! Introduction ... 253!
10.2! Materials and methods ... 255!
10.2.1!Experimental Data ... 255!
10.2.1.1! Pilot-Scale of Circulating Fluidized Bed Bioreactor ... 255!
10.2.1.1! Biofilm Support Media (Bioparticles) ... 257!
10.2.1.1.1!Respirometry Study ... 259!
10.2.2!Biofilm Model ... 260!
10.2.3!Biofilm Calibration Protocol ... 262!
10.2.3.1! Stage I: Definition of Objectives ... 263!
xvi
10.2.3.3! Stage III: Data Analysis ... 266!
10.2.3.4! Stage IV: Model Calibration ... 266!
10.2.3.5! Stage V: Sensitivity Analysis ... 268!
10.3! Results and Discussion ... 269!
10.3.1!Definition of Objectives, Layout, and Data Collection (Modeling Stages I and II) ... 269!
10.3.2!Data Analysis (Modeling Stage III) ... 272!
10.3.3!Model Calibration (Modeling Stage IV) ... 273!
10.3.4!Sensitivity Analysis (Modeling Stage V) ... 282!
10.4! Conclusions ... 285!
10.5! References ... 286!
CHAPTER 11!CONCLUSIONS, RECOMMENDATIONS, AND ENGINEERING SIGNIFICANCE ... 291!
11.1! Conclusions ... 291!
11.2! Scientific Contribution ... 294!
11.3! Limitations ... 295!
11.4! Recommendations ... 296!
Appendix A. Pictures of MH-CFBBR System ... 298!
A.1! Trailer and Insulation Phase ... 298!
A.2! Layout of the MH-CFBBR ... 299!
xvii
List of Tables
Table 2- 1: Cost comparison for municipal wastewater treatment process for different BNR system
(adapted from Chowdhury et al., 2012) ... 30!
Table 2- 2: GHGs contribution to the total effect ... 43!
Table 3- 1: Operating conditions at different flow rates ... 73!
Table 3- 2: Landfill leachate characteristics used in LSCFB ... 80!
Table 3- 3: Influent characteristics for different media ... 81!
Table 3- 4: Physical properties for different media used in FBBRs ... 83!
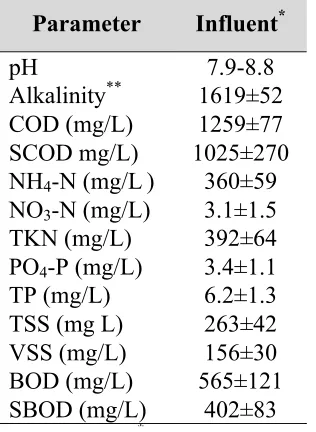
Table 4- 1: Influent and effluent characteristics for different media ... 95!
Table 4- 2: Operational conditions of each media in DFBBRs ... 98!
Table 4- 3: Physical properties for different media used in DFBBRs ... 99!
Table 4- 4: Overall mass balance for different media in DFBBRs ... 109!
Table 4- 5: Cost analysis of each media used in DFBBRs ... 113!
Table 5- 1: Operational conditions of DFBBRs in phases I and II ... 126!
Table 5- 2: Influent and effluent characteristics at different calcium concentrations ... 134!
Table 5- 3: Overall mass balance of DFBBRs at different calcium concentrations ... 139!
Table 6- 1: Operational conditions of DFBBR during the N2O measurements ... 156!
Table 6- 2: Influent and effluent characteristics at phases I, II, and III ... 164!
Table 6- 3: Overall mass balance of DFBBRs at phases I, II, and III ... 168!
Table 7- 1: Operational conditions of DFBBRs at phases I and II ... 176!
Table 7- 2: Influent and effluent characteristics at different calcium concentrations at phase I ... 190!
Table 7- 3: Influent and effluent characteristics at different calcium concentrations at phase II ... 191!
Table 8- 1: Comparison of leachate BNR studies in terms of COD, NH4-N, and PO4-P removal ... 200
Table 8- 2: Operating conditions for LSCFB ... 202
Table 8- 3: Influent and effluent characteristics for different phases of LSCFB ... 207
Table 8- 4: Overall mass balance for all phases in LSCFB ... 216
Table 9- 1: Influent and effluent characteristics for different phases compared to simulated by BioWin® ... 228!
xviii
Table 9- 3: Carbonaceous and nutrient fraction estimated for wastewater and assumed for landfill
leachate in BioWin® ... 233!
Table 9- 4: Kinetic parameters used for landfill leachate in BioWin® ... 234!
Table 9- 5: Calibrated BioWin® parameters ... 236!
Table 9- 6: Calibrated AQUIFAS® parameters ... 236!
Table 9- 7: Experimental and Simulated effluent quality ... 241!
Table 9- 8: Simulated results and measured parameters for nutrient removal rates ... 245!
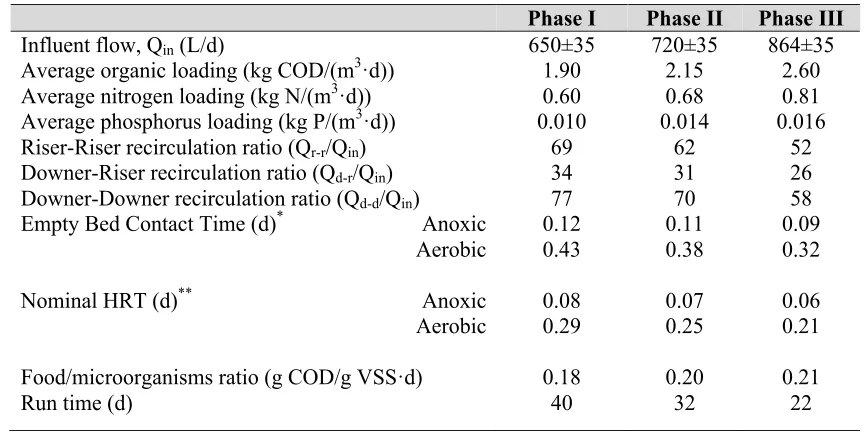
Table 10- 1: Influent and effluent characteristics at different phases ... 257!
Table 10- 2: Operating conditions ... 258!
Table 10- 3: Carbonaceous and nutrient fraction estimated for wastewater and assumed for municipal wastewater in BioWin® ... 261!
Table 10- 4: Experimental and input wastewater influent characteristics used in BioWin® ... 261!
Table 10- 5: Overall mass balance at different phases ... 273!
Table 10- 6: Calibrated kinetics parameters used in BioWin® ... 276!
Table 10- 7: Comparison between the calibrated and literature values of the selected kinetics parameters used in BioWin® ... 277!
Table 10- 8: Impact of biofilm thickness, kinetics, and biofilm properties approaches on effluent characteristics and biofilm thickness ... 278!
Table 10- 9: Experimental and Simulated effluent quality ... 280!
Table 10- 10: Simulated results and measured parameters for nutrient removal rates ... 281!
Table 10- 11: Normalized sensitivity coefficient of effluent characteristics ... 283!
Table 10- 12: Mean square sensitivity measure (δjmsqr) ranking of kinetic/ stoichiometric and biofilm parameters ... 284!
xix
List of Figures
Figure 2- 1: The variation of minimum sludge age for nitrification in different temperature and
influent ammonia concentration ... 16!
Figure 2- 2: Particulate biofilm technologies configurations (a) UASB (b) FBBR (c) EGSB (d) BAS and CIRCOX® (e) IC (Adapted from Nicolella et al., 2000) ... 24!
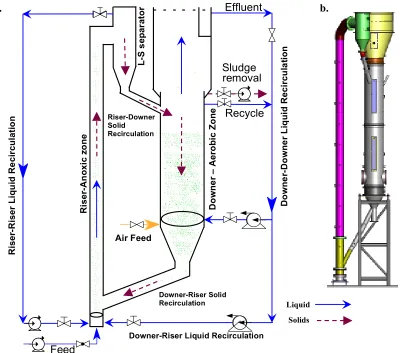
Figure 2- 3: Conceptual overview of the N2O production and consumption pathways of denitrification process including periplasmatic nitrate reductase (NAP), membrane-bound nitrate reductase (NAR), Cu-containing nitrite reductase (NirK), cytochrome cd1 nitrite reductase (NirS), nitric oxide reductase (NOR), and nitrous oxide reductase (NOS) ... 46!
Figure 3- 1: (a) Schematic and (b) 2-D view of the pilot-scale LSCFB ... 72!
Figure 3- 2: Schematic diagram of the lab-scale DFBBR ... 74!
Figure 3- 3: Schematic diagram of the lab-scale N2O-DFBBR ... 76!
Figure 3- 4: Schematic diagram of MH-CFBBR ... 77!
Figure 3- 5: The MH-CFBBR at the movable full size trailer of 53` drop van ... 78!
Figure 3- 6: MH-CFFBR system at Adelaide treatment plant, London, ON, Canada ... 79!
Figure 4- 1: (a) Schematic diagram of DFBBRs, (b) Microscopic picture of bare particles, (c) Microscopic picture of bioparticles on the 120th day ... 96!
Figure 4- 2: Fluidization characteristics of each medium (before and after biofilm attachment) ... 97!
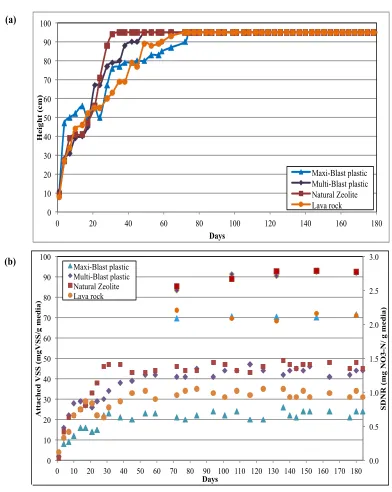
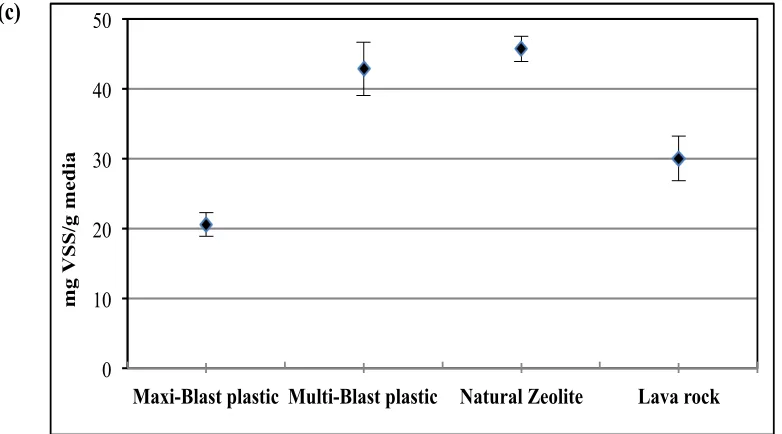
Figure 4- 3: (a) change in heights of expanded bed, (b) attached VSS inventory, and (c) Average and SD of the attached VSS of each media ... 102!
Figure 4- 4: (a) TCOD for influent and SCOD for effluent of each media, (b) Nitrate concentration of influent and effluent for different DFBBRs, (c) Organic and Nitrogen removal efficiency for each media, and (d) Biomass yield in each medium ... 107!
Figure 4- 5: Cost-flow diagram of each media used in DFBBR ... 114!
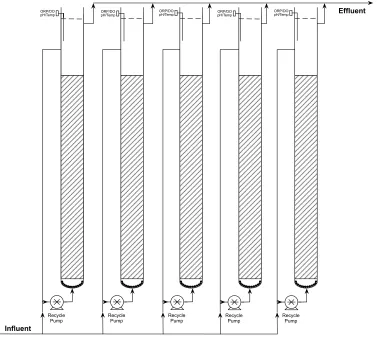
Figure 5- 1: Schematic diagram of DFBBRs ... 124!
xx
Figure 5- 3: (a) Influent TCOD and effluent SCOD, (b) Influent and effluent nitrate concentration,
(c) Organic removal efficiencies, and (d) Nitrogen removal efficiencies ... 135!
Figure 5- 4: Biofilm morphology of DFBBR’s bioparticles ... 138!
Figure 5- 5: Scanning Electron Microscope (SEM) of DFBBR’s bioparticles ... 141!
Figure 5- 6: Cumulative Ca2+ mass balance of (a) 20 mg Ca2+/L, 60 mg Ca2+/L, 120 mg Ca2+/L, 180 mg Ca2+/L, and 240 mg Ca2+/L (Including cumulative Ca2+ mass balance captured as the sum of liquid and attached divided by the influent calcium, at selected times) ... 147!
Figure 6- 1: Schematic diagram of DFBBRs ... 124!
Figure 6- 2: (a) attached VSS inventory, (b) suspended VSS inventory, (c) average and SD of the attached VSS, and (d) Biomass yield ... 133!
Figure 6- 3: (a) Influent TCOD and effluent SCOD, (b) Influent and effluent nitrate concentration, (c) Organic removal efficiencies, and (d) Nitrogen removal efficiencies ... 135!
Figure 6- 4: Biofilm morphology of DFBBR’s bioparticles ... 138!
Figure 6- 5: Scanning Electron Microscope (SEM) of DFBBR’s bioparticles ... 141!
Figure 6- 6: Cumulative Ca2+ mass balance of (a) 20 mg Ca2+/L, 60 mg Ca2+/L, 120 mg Ca2+/L, 180 mg Ca2+/L, and 240 mg Ca2+/L (Including cumulative Ca2+ mass balance captured as the sum of liquid and attached divided by the influent calcium, at selected times) ... 147!
Figure 7- 1: Schematic diagram of DFBBRs used for mitigation of N2O ... 175!
Figure 7- 2: (a) attached VSS inventory, (b) suspended VSS inventory, (c) average and SD of the attached VSS, and (d) Biomass yield ... 184!
Figure 7- 3: (a) Influent TCOD and effluent SCOD, (b) Influent and effluent nitrate concentration, (c) Organic removal efficiencies, and (d) Nitrogen removal efficiencies. ... 185!
Figure 7- 4: Biofilm morphology of DFBBR’s bioparticles ... 188!
Figure 7- 5: Scanning Electron Microscope (SEM) of DFBBR’s bioparticles ... 189!
Figure 8- 1: (a) Schematic and (b) 2-D view of the pilot-scale LSCFB ... 203!
Figure 8- 2: Nutrient removal using the LSCFB, a) COD removal, b) BOD removal, c) Nitrogen removal, d) Ammonia removal, e) Total Phosphorus removal, and f) PO4-P removal ... 212!
Figure 8- 3: Yield of process using LSCFB at (a) Phase I, (b) Phase II, and (c) Phase III ... 214!
xxi
Figure 9- 2: BioWin® and AQUIFAS® schematic flow diagram of CFBBR model ... 235!
Figure 9- 3: Temporal variation of attached biomass in the Anoxic and Aerobic reactors ... 238!
Figure 9- 4: Temporal variation of the CFBBR effluent VSS concentrations ... 239!
Figure 9- 5: Comparison between predicted and measured parameters for phases I and II with BioWin® ... 242!
Figure 9- 6: Comparison between predicted and measured parameters for phases I and II with
AQUIFAS® ... 244!
Figure 10- 1: (a) Schematic diagram of CFBBR, (b) 2-D view of the pilot-scale CFBBR, (c) Bioparticles
distribution in the CFBBR system, (d) BioWin® schematic flow diagram of CFBBR model ... 256!
Figure 10- 2: Calibration protocol for the particulate biofilm reactors ... 262!
xxii
List of Abbreviations and Symbols
g Acceleration of gravity
ASM Activated Sludge Models
ΔpS Additional pressure drop
AOBs Ammonia oxidizing bacteria
Xm Attached biomass
AGR Attached growth reactor
dm Average particles diameter sizes
APE Average percentage error
ε Axial void fraction
ds Bare particle diameter
ε Bed voidage
BNR Biological nutrient removal
BNRb Biological nutrient removal endogenous decay coefficient
BOD Biological oxygen demand
ρp Bioparticles density
BSA Bovine serum albumin
BET Brunauer, Emmett, and Teller Theory
ρb Bulk density
Ca2+ Calcium
C/N Carbon to nitrogen ratio
CER Cations exchange resin
COD Chemical oxygen demand
COD/N Chemical oxygen demand to nitrogen ratio
CFBBR Circulating fluidized bed bioreactor
COV Coefficient of variation
xxiii CPD Critical point dryer
A Cross sectional area
Kd Decay coefficient for heterotrophic
DFBBRs Denitrifying Fluidized Bed Bioreactors
D Diffusion coefficient
DCB Divalent cations bridging theory
Xl Effluent biomass
EBCTs Empty bed contact times
b Endogenous decay coefficient
EDX Energy-dispersive X-ray
H Expanded bed height
Lf Expanded height
EPS Extracellular polymeric substances
b' First-order detachment rate coefficients
FBBR Fluidized bed bioreactor
εf Fluidized bed voidage
fd Fraction of inert biomass that remains as cell debris
MX Granulated maxi-blast plastic
MB Granulated multi-blast plastic
HRT Hydraulic retention time
HRT Hydraulic retention time
ICP Inductively coupled plasma
So/X Initial substrate to microorganisms ratios
xi Input variable
IFAS Integrated Fixed Film Activated Sludge
IC Integrity coefficient
LR Lava rock
xxiv
ρ Liquid density
u Liquid superficial velocities
µ Liquid viscosity
Mg2+ Magnesium
Ms Mass of particles
LL Mass transfer boundary layer thickness
MTBL Mass transfer boundary layers
SSAmax Maximum possible surface area
µmax Maximum specific growth rate
δjmsqr Mean square sensitivity measure
dm Media diameter
umf Minimum fluidization velocity
KS Monod half saturation coefficient
MBBR Moving bed bioreactor
MWW Municipal wastewater
NZ Natural zeolite
NOBs Nitrite oxidizing bacteria
Fup Nonbiodegradable particulate chemical oxygen demand fraction
Si,j Normalized sensitivity coefficient
OHOs Ordinary heterotrophic organisms
OLR Organic loading rate
yi Output variable
ΔO2 Oxygen consumption
ORP Oxygen reduction potential
ρp Particle density
dp Particle diameter
Fxsp Particulate biodegradable fraction of slowly biodegradable COD
xxv P/C Protein to carbohydrates rat
R120Ca Rector with a Ca2+ of 120 mg/L
R180Ca Rector with a Ca2+ of 180 mg/L
R20Ca Rector with a Ca2+ of 20 mg/L
R240Ca Rector with a Ca2+ of 240 mg/L
R60Ca Rector with a Ca2+ of 60 mg/L
SEM Scanning electron microscopy
M/AL Solids concentrations
εS Solids hold-up
SRT Solids retention time
SCOD Soluble chemical oxygen demand
SMP Soluble microbial product
SDNR Specific denitrification rates
SSA Specific surface area
SSV Specific surface volume
φ Sphericity
Lo Static height
dp Steady-state bioparticle diameter
SGR Suspended growth reactor
SMW Synthetic municipal wastewater
ut Terminal settling velocity
TBOD Total Biochemical oxygen demand
TCOD Total chemical oxygen demand
TN Total nitrogen
TP Total phosphorus
TSA Total surface area
TSS Total suspended solids
xxvi YH True biomass yield
VSS Volatile suspended solids
WWTP Wastewater treatment plant
CHAPTER 1
INTRODUCTION
1.1
Background
Limited water resources and increasing urbanization require more advanced
technologies to preserve water quality, reduce water pollution, and reclaim wastewater
for reuse (Metcalf and Eddy, 2007). One of the most important factors affecting water
quality is the enrichment of nutrients, i.e. organic matter, nitrogen, and phosphorus in
water bodies (Romanski et al., 1997). Nitrogen is an essential building block in the
synthesis of protein. Phosphorus is a key element to the growth of algae and other
microorganisms (Metcalf and Eddy, 2007).
Biological treatment is one of the most cost-effective means to reduce organic and
nutrient content of liquid waste streams, prior to their final discharge to the environment.
Although conventional biological treatment and reuse processes have been used
successfully to control various nutrient contaminants, their applications are currently
economically and practically challenged by increasingly stringent federal and provincial
regulations for tertiary wastewater quality discharges. The application of particulate
biofilm reactors for municipal and industrial biological wastewater treatment has gained
considerable interest in recent years due to their inherent advantages of high biomass
retention time, compactness, and high volumetric conversion rates. This type of reactors
primarily used for the suspension of particulate biofilms in wastewater treatment
processes are Biofilm Upflow Anaerobic Sludge Blanket (UASB), Fluidized Bed
Bioreactors (FBBR), Expanded Granular Sludge Blanket (EGSB), Biofilm Airlift
2004, Fahid et al., 2004, Bolton et al., 2006). Due to its high surface area and excellent
biomass retention, FBBR have demonstrated numerous advantages over conventional
systems including low footprint, excellent nutrient removal efficiency at low
temperatures, and low sludge yields which may result in elimination of secondary
clarification (Sutton et al., 1980, Cooper and Sutton, 1983, Nicolella et al., 2000, Shieh et
al., 1986).
Furthermore, nitrous oxide (N2O) is a significant anthropogenic greenhouse gas
(AnGHG) emitted from BNR processes. During nitrification, N2O can be produced
through the aerobic hydroxylamine oxidation pathway of ammonia oxidizing bacteria
(AOB). The direct oxidation of hydroxylamine to NO is catalyzed by hydroxylamine
oxidoreductase (HAO) encoded by the heoAB genes, and reduced to N2O under the
catalysis of c554 cytochrome (Cyt c554) (Chandran et al., 2011, Stein, 2011).
During the denitrification process, N2O is one of obligatory intermediates in the
biochemical reaction of heterotrophic denitrifying bacteria (HDN) where NO3-N is
reduced to NO2-N and N2O, with N2O finally reduced to N2 gas (Hu et al., 2013). The
reduction of NO3 to N2 involves six enzymes and reductases using five electrons
(Desloover et al., 2012).
However, the N2O emissions are estimated to account for 3.2% of the global
anthropogenic N2O emission from wastewater treatment plants (WWTP) and considering
the widespread use of BNR processes due to the rigorous effluent water quality standards,
therefore, the emission of N2O during BNR processes of industrial and municipal
and a mitigation of the N2O emission in a biofilm processes is an important issue (Sahley
et al., 2006, Kampschreur et al., 2009).
1.2
Problem Statement
Notwithstanding the fact that numerous FBBR configurations and system
schemes are currently available for industrial and municipal wastewater treatment
processes, it remains a major challenge to develop and optimize a stable bioparticles
reactor system that is capable of offering effective and integrated functions, i.e.
biodegradation, biomass-liquid separation, and biomass retention along with a substantial
reduction of the N2O emission. However, wider applications of the FBBR technology in
practice have been hindered largely due to biofilm detachment leading to performance
instability, precipitating the need to explore different media and optimize the biofilm.
This can be achieved through a thorough investigation of different media characteristics
to optimize an integrated patented FBBR system, termed the Circulating Fluidized Bed
Bioreactors (CFBBR), and study the impact of divalent cation of calcium (Ca2+) on the
CFBBR biofilm. Furthermore, this proposed strategy was used to mitigate the emissions
of N2O from the FBBR system. Additionally, the CFBBR process development can
benefit immensely from the development of a biofilm model to simulate the biofilm
dynamics in FBBR system including a calibration protocol for the existing simulation
packages.
1.3
Objectives
In the present research, optimization, development, and modeling of the patented
• Investigate the effects of different media bioparticles on the biofilm structure,
morphology, thickness, and reactor performance of FBBR systems used for
BNR from municipal wastewater.
• Investigate the impact of a divalent cation (i.e. Ca2+) on the biofilm structure,
morphology, thickness, and reactor performance of a denitrifying FBBR used
for BNR from municipal wastewater, as well as delineating the relationship
between biofilm characteristics and deleterious N2O emissions.
• Development of a novel methodology to control the dynamics of biofilm
thickness using divalent cation (i.e. Ca2+) dosage technique in the range of
20-240 mg Ca2+/L to provide a stable biofilm thickness, structure, and
morphology, in order to reduce the detachment rate in FBBR system.
• Simulation and modeling the biofilm used in the CFBBR system numerically
• Development of a calibration protocol of the biofilm numerical model.
1.4
Thesis Organization
This thesis encompasses twelve chapters and conforms to the “integrated-articles”
format as outlined in the Thesis Regulation Guide by the School of the Graduate and
Postdoctoral Studies (SGPS) of the University of Western Ontario. After an introduction
in the first Chapter, a comprehensive literature review including the background and a
thorough assessment of the information on the biological nutrient removal (BNR) from
wastewater, fluidized bed bioreactor (FBBR), nitrous oxide (N2O) emissions from BNR
systems, and modeling of biofilm reactors is presented in Chapter 2. In Chapter 3, the
detailed description of the materials and methodology used throughout this work is
Chapter 4 investigates the impact of particles properties on the biofilm morphology
and structure. In this Chapter, the author investigates the energy consumption as a
function of initial capital cost, fluidization energy cost, and replacement cost. Greater
focus on the biofilm morphology and the change in the structure with the ultimate goal of
developing a novel method to control the denitrifying biofilm in DFBBR system using
divalent cations (i.e. Ca2+) is presented in Chapter 5.
Chapter 6 discusses N2O emissions from DFBBR during denitrification of
municipal wastewater, followed by presentation of a novel method to control N2O
emissions from denitrifying biofilms using Ca2+ in Chapter 7.
Chapters 8, 9, and 10 concentrate on mathematical modeling and simulation of
biological nutrient removal using the CFBBR using the aforementioned technologies by
the most used simulation software in the market for fixed-film processes, BioWin and
AQUIFAS. In Chapter 8, a comprehensive study of biological Nutrient Removal from
Leachate Using a Pilot Liquid-Solid Circulating Fluidized Bed Bioreactor (LSCFB) is
presented and used as a case study for the mathematical modeling with a challenge to
model the BNR from landfill leachate using FBBR. Chapter 9 presents a comparative
modeling of the BNR process during the treatment of landfill leachate using BioWin and
AQUIFAS. In Chapter 10, a calibration protocol to overcome the challenges of using
available simulation software packages to model particulate biofilm processes, which
would help the process engineers to model such systems, was developed.
Finally, Chapter 11 summarizes the major findings of this study with
1.5
Contribution of Thesis
The main goal of this study was to advance the commercialization of the patented
CFBBR developed at Western, through improved understanding of fluidization energy
requirements and their connection with media characteristics, better control of biofilm
properties to affect increased biomass retention, lower detachment, and consequently
higher loadings, and finally mitigation of N2O emissions widely recognized for its
adverse impact on the carbon footprint of wastewater treatment systems. The significant
contribution of this thesis stems directly from the achieved improvement of the biofilm
stability and ensuing enhancement of FBBR performance, while simultaneously
mitigating N2O emissions. Furthermore, the proposed model and calibration protocol are
both necessary and helpful to successfully apply biofilm models both for research and
design and optimization purpose. The detailed calibration procedures presented in this
study will not only help the process engineers to design and retrofit plants but also plan
sampling and monitoring requirements for process optimization.
1.6
References
Bolton, J., Tummala, A., Kapadia, C., Dandamudi, M., Belovich, M.J. 2006. Procedure to quantify biofilm activity on carrier used in wastewater treatment systems. J. Environ. Eng., 132, 1422-1430.
Chandran K., Stein L., Klotz, M., van Loosdrecht M.C.M. 2011. Nitrous oxide production by lithotrophic ammonia-oxidizing bacteria and implications for engineered nitrogen-removal systems. Biochemical Society Transactions 39, 1832-1837.
Cui, Y., Nakhla, G., Zhu, J., Patel, A. 2004. Simultaneous carbon and nitrogen removal in anoxic-aerobic circulating fluidized bed biological reactor (CFBBR). Environ. Technol., 25, 699-712.
Desloover, J., Vlaeminck, S., Clauwaert, P., Verstraete, W., Boon, N., 2012. Strategies to
mitigate N2O emissions from biological nitrogen removal systems, Current Opinion
in Biotechnology. 23(3), 474-482.
Fahid, K., Rabah, J., Dahab, M.F. 2004. Nitrate removal characteristics of high performance fluidized-bed biofilm reactors. Water Res., 38, 3719-3728.
Hu, Z., Zhang, J., Xie, H., Liang, S., Li, S., 2013. Minimization of nitrous oxide emission
from anoxic-oxic biological nitrogen removal process: Effect of influent COD/NH4+
ratio and feeding strategy, Journal of Bioscience and Bioengineering. 115(3), 272-278.
Metcalf and Eddy. 2007. Water Reuse: Issues, Technologies, and Applications. 1st Ed. McGraw-Hill, New York.
Nicolella, C., Van Loosdrecht, M.C.M., Heijnen, J.J. 2000.Wastewater treatment with particulate biofilm reactors, J Biotechnol., 82, 1-33.
Romanski, J., Heider, M., Wiesmann, U., 1997. Kinetics of anaerobic orthophosphate release and substrate uptake in enhanced biological phosphorus removal from synthetic wastewater, Water Research, 31(12), 3137-3145
Shieh, W.K., Keenan, D.K., 1986. Fluidized bed biofilm reactor for wastewater treatment. In: Fiechter, A. (Ed.), Advances in Biochemical Engineering/Biotechnology. Springer- Verlag, Berlin, 132-168.
Stein, L.Y., 2011. Surveying N2O-Producing Pathways in Bacteria, Methods in
Enzymology, 486, 131-152
9
9
CHAPTER 2
LITERATURE REVIEW
*2.1
Introduction
Biological treatment is one of the most cost-effective means to reduce organic and
nutrient content of liquid waste streams, prior to their final discharge the environment.
Although conventional biological treatment and reuse processes have been used
successfully to control various nutrient contaminants, their applications are currently
economically and practically challenged by increasingly stringent federal and provincial
regulations for tertiary wastewater quality discharges. The application of particulate
biofilm reactors for municipal and industrial biological wastewater treatment has gained
considerable interest in recent years due to their inherent advantages of high biomass
retention time, compactness, and high volumetric conversion rates. This type of reactors
primarily used for the suspension of particulate biofilms in wastewater treatment
processes are Biofilm Upflow Anaerobic Sludge Blanket (UASB), Fluidized Bed
Bioreactors (FBBR), Expanded Granular Sludge Blanket (EGSB), Biofilm Airlift
Suspension (BAS), and Internal Circulation (IC) reactors (Nicolella et al., 2000, Cui et al.,
2004, Fahid et al., 2004, Bolton et al., 2006).
Despite the fact that numerous bioreactor configurations and system schemes are
currently available for a wide variety of environmental applications, it remains a major
challenge to develop and optimize a stable bioparticles reactor system that is capable of
offering effective and integrated functions, i.e. biodegradation, biomass-liquid separation,
10
10
and biomass retention. Due to its high surface area and excellent biomass retention, the
Fluidized Bed Bioreactors (FBBR) have demonstrated numerous advantages over
conventional systems including low footprint, excellent nutrient removal efficiency at
low temperatures, and low sludge yields which may result in elimination of secondary
clarification (Sutton et al., 1980, Cooper and Sutton, 1983, Nicolella et al., 2000, Shieh et
al., 1986). Therefore, this literature review intends to examine five distinct topics:
biological nutrient removal, fluidized bed bioreactor, bioparticles and biofilm formation,
nitrous oxide (N2O) emissions, and mathematical biofilm models.
2.2
Biological Nutrient Removal
Biological nutrient removal (BNR) processes typically consist of specific aerobic,
and anoxic/anaerobic bioreactors. The bioreactors are classified on the basis of terminal
electron acceptor utilized and variability of the nutrient substrate. In the aerobic
bioreactor, oxygen is predominantly the electron acceptor, while in the anoxic bioreactor,
nitrate acts as the electron acceptor. Combination of these bioreactor environments is the
distinguishing feature of BNR system (Chowdhury, 2009, Metcalf and Eddy, 2003).
Nitrogen in different types of wastewater can be transformed and removed by
biologically mediated nitrification and denitrification as well as nitrogen uptake for cell
synthesis. Oxidation of Ammonia nitrogen (NH3-N) to nitrite (NO2-) (Equation (2.1))
using ammonia-oxidation-bacteria (AOB), i.e. Nitrosomonas followed by conversion of
nitrite (NO2-) to nitrate (NO3-) as shown in Equation (2.2) using nitrite-oxidizing-bacteria
(NOB), i.e. Nitrobacter completes the nitrification process (Metcalf and Eddy, 2003).
First step: 2NH4+ +3O2 2NO2- +2H2O+ 4H+…..Equation (2.1)
Second step: 2NO2- + O2 2NONitrobacter 3-………..……..…Equation (2.2)
11
11
Both Nitrosomonas and Nitrobactor, as autotrophic bacteria, can only develop
biochemical activity in an environment containing dissolved oxygen. Based on the
aforementioned stoichiometry, the theoretical amount of oxygen, needed to complete the
reaction, is 4.57g O2/g N with a minimum of 7.14 g of alkalinity as CaCO3 for each g of
ammonia nitrogen (Teske et al. 1994, Metcalf and Eddy, 2003). Therefore, nitrification is
limited by the dissolved oxygen in the reactor environment and influenced by solids
retention time (SRT), temperature, pH, and presence of toxic compounds (Randall et al.,
1992).
Biological reduction of nitrate to nitric oxide, nitrous oxide, and nitrogen gas,
performed by heterotrophic bacteria under anoxic conditions, is defined as denitrification
(Metcalf and Eddy, 2003). Denitrifiers use nitrite and nitrate as electron acceptors and
organic matter as carbon and energy source. Each step of denitrification may be
represented by a half-reaction where e denotes electron equivalents transferred from the
substrate (Henze et al., 2008):
2!!+!!
!!+2!! !!!!+!!!…….………. Equation (2.3) !!+!!
!!+2!! !! +!!!……… Equation (2.4)
2!!+2!! +2!! !
!! +!!!……… Equation (2.5)
2!!+!
!! +2!! !! +!!!………. Equation (2.6)
The net reaction for complete denitrification is obtained by combining the above
four equations as follows:
10!!+2!!
!!+12!! !!+6!!!………..…… Equation (2.7a)
Or
equivalently, 0.2!!!!!+1.2!!+!!! 0.1!!!+0.6!!!…….. Equation (2.7b) The biological nitrate reduction can be either a respiratory pathway, which is also
12
12
reduction of nitrate to ammonia for the biosynthesis of nitrogenous compounds. These
two pathways differ: (1) The enzymes of the respiratory pathways dissimilatory nitrate
reduction to ammonia (DNRA) are integrated in cytoplasmic membranes or located in the
periplasm (a space between the inner cytoplasmic membrane and external outer
membrane of Gram-negative bacteria) or the equivalent space outside the inner
membrane of Gram-positive bacteria and their synthesis is repressed by oxygen, whereas
(2) The biosynthesis pathways use soluble enzymes, the synthesis of which is repressed
by ammonia (Fletcher and Floodgate, 1973). According to Tiedje et al. (1988), DNRA is
a major nitrate pathway in anaerobic digesters in which the nitrate reductase enzymes are
within the cytoplasm. Several other researchers have also concluded that added nitrate in
a strict anaerobic environment was mainly reduced to ammonia, while only a minor
fraction was recovered as nitrogen gas (Ergun, 1952, Berge et al., 2005, Berge et al.,
2007, Mertoglu et al., 2006, Spagni et al., 2009). A number of obligate and facultative
anaerobic, and microaerophilic, bacteria perform dissimilatory nitrate reduction to
ammonium, mainly in carbon rich and low electron acceptor environments such as nitrate.
Relative abundance of fermentative and obligate anaerobes such as ammonium formers,
discovered in anaerobic environments is responsible for DNRA (Gibilaro et al., 1986).
Assimilatory nitrate reduction occurs directly to eukaryotes. Additionally, organic
nitrogen may be used further by bacteria and fungi to form ammonia (ammonification).
2.2.1 Kinetic Models For Biological Nitrogen Removal
2.2.1.1 Nitrification Kinetics
The classical microbial growth kinetics model termed the Monod model is a simple
empirical model that introduces the concept of a growth-controlling substrate. For
13
13
versus nitrite-oxidation kinetics are rate limiting, so that designs are based on saturation
kinetics for ammonia oxidation as given in Equation (2.8) (Metcalf and Eddy, 2003). As
a result generally very little nitrite (<1 mgN/L) is observed in the effluent from a plant
operating on an influent that does not contain substances that inhibit NOBs or a plant that
NOBs are purposely inhibited.
µn=
µn,maxNa
KN+Na −kdn………...……..Equation (2.8)
where µn is specific growth rate of nitrifying bacteria (g new cells/g cells.d), µn,max is
maximum specific growth rate of nitrifying bacteria (1/d) at temperature T(°C) and KN is
half saturation coefficient at temperature T(°C), and kdn is endogenous decay coefficient
for nitrifying organisms at temperature T(°C) (g VSS/g VSS.d) and Na is bulk liquid
ammonia concentration (mg/L). The values of µn,max, KN and kdn change based on
temperature following Arrhenius law as shown in Equation (2.9).
µn,max=µn,max, 20
( )
θN (T−20) θN =1.123KN =KN, 20
( )
θN(T−20)
kdn =kdn, 20
( )
θk(T−20)
θk=1.029
"
# $ $
% $ $
Equation (2.9)
As apparent from Equation (2.9), the effect of temperature on nitrification is stronger
than the effect of temperature on endogenous respiration. For every 6°C drop in
temperature the specific growth rate decreases to half and minimum SRT for nitrification
doubles. Monod showed that the mass of organisms generated is a fixed fraction of the
mass of substrate utilized and the specific growth rate (the rate of growth per unit mass of
organisms per unit time) is related to the concentration of substrate surrounding the
14
14
YAOB=
mass of nitrifiers generated(mgVSS)
mass of ammonia as N utilized(mg N)=
ΔXAOB
ΔNa ……Equation (2.10)
The differential state of the aforementioned equation in a very small time interval
can be written as shown in equation (2.11).
dXAOB
dt =YAOB −
dNa
dt
" #$
%
&'………Equation (2.11)
On the other hand the growth rate is defined by the product of the specific growth
rate and the AOB concentration (XAOB) (Equation 2.12).
dXAOB
dt =
µn,maxNa
KN+Na −kdn "
#
$ %
&
'XAOB………..Equation (2.12)
The rate of ammonia (Na) conversion as well as nitrate (Nn) formation as shown in
Equation (2.13).
dNn
dt =−
dNa
dt =
1
YAOB
µn,maxNa
KN+Na
−kdn
"
#
$ %
&
'XAOB…….Equation (2.13)
Due to the presence of inhibitory substances and variations in experimental
techniques, a wide range of maximum nitrification growth rates has been reported,
0.25-0.77 g VSS/g VSS.d at 20°C, i.e. µn,max values for nitrifying organisms are much lower
than the corresponding values for heterotrophic organisms, requiring much longer SRT
values for nitrifying systems, 10-20 d at 10°C and 4-7 d at 20°C (Metcalf and Eddy,
2003). Based on the aforementioned equations and mass balance over an ideal Chemostat
process, Henze et al., (2008) derivedEquations (2.14) and (2.15) for theoretical minimum
sludge age for nitrification below which theoretically nitrification can not be achieved
15
15
SRTm=
1
1+KN
Nai
!
"
# $
%
&µn,max−kdn
………..Equation (2.14)
Na =Nae=
KN
(
kdn+1 SRT)
µn,max−
(
kdn+1SRT)
……….Equation (2.15)
Henze et al., (2008) stated that the effect of influent ammonia (Nai) on SRTm is
very small because the magnitude of KN relative to Nai (<5%). Therefore substituting
zero for KN/Nai yields Equation (2.16).
SRTm= 1
µn,max−kdn
..……..…...………Equation (2.16)
where Nai is nitrogen ammonia concentration in the influent, Nae is the nitrogen ammonia
concentration in the effluent and Na is the ammonia concentration in the bulk liquid and
kdn is endogenous decay coefficient for nitrifying organisms at T(°C)(g VSS/g VSS.d).
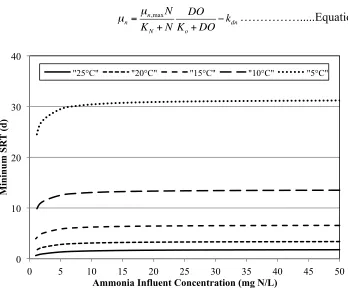
As shown in Figure 2-1, the minimum sludge age in nitrification process varies
significantly at different temperature and slightly with the magnitude of inlet nitrogen
concentrations. Unlike the effect of temperature, the effect of influent ammonia
concentration (Nai) is very small simply because the value of KN is very small relative to
the changes in concentration of inlet ammonia. However, at higher temperatures, the
dependency of SRTmin on Nai is more considerable compared to the lower temperature.
According to Figure 2-1, Equation (2.16) estimates minimum SRT precisely at Nai>10
mg/L which is the case for most municipal wastewater treatment plants.
Nitrification rates are affected by the liquid DO concentration. To account for the
effect of DO, the expression for the specific growth rate is modified as follows (Metcalf
16
16
………...Equation (2.17)
Figure 2- 1: The variation of minimum sludge age for nitrification in different temperature and influent ammonia concentration
where Ko is half-saturation coefficient for DO. At low DO concentrations (<0.5 mg/L)
where nitrification rates are greatly inhibited, the low DO inhibition effect has been
shown to be greater for Nitrobacter than for Nitrosomonas (Metcalf and Eddy, 2003).
2.2.1.2 Denitrification Kinetics
Heterotrophic denitrifiers utilize organic matter as energy source in different forms
such as readily biodegradable organics (rbCOD), slowly biodegradable organic (sbCOD),
and the slowly biodegradable organics generated through death and lysis of organisms
(endogenous respiration). The sbCOD can be in the form of particulate or colloidal
organic compounds. These organics have to be hydrolyzed to smaller readily
biodegradable compounds, which then can be transferred to the microorganisms and
utilized. The extracellular sbCOD hydrolysis rate is slow in general and particularly
much slower under anoxic condition (1/3 of aerobic hydrolysis rate) where oxygen is not
µn=
µn,maxN
KN+N
DO
Ko+DO−kdn
0 10 20 30 40
0 5 10 15 20 25 30 35 40 45 50
M
in
in
u
m S
R
T
(d
)
Ammonia Influent Concentration (mg N/L)
17
17
the electron acceptor (Stern and Marais, 1974, Van Haandel et al., 1981). Therefore the
denitrification rate with influent rbCOD is much faster than with sbCOD and
consequently rbCOD is the preferred organic for denitrification for a greater nitrogen
removal. DelPozo and Diez (2003) suggested the minimum biodegradable soluble COD
(bsCOD)/NO3-N based on Equation (2.18).
g rbCOD
g NO3−N =
2.86
(1−YH,NO
x)+(1−fXI)YH,NOx
……...Equation (2.18)
where YH,NOx is the anoxic yield coefficient and fXI is the fraction of inert COD (chemical
oxygen demand) generated in biomass lysis. Nitrate serves as an electron acceptor in the
same way as oxygen from a biokinetics perspective and thus the nitrate utilization rate
(denitrification rate) is proportional to the substrate utilization rate. To apply biokinetic
expressions for denitrification, the substrate utilization rate expression (rsu) is modified to
account for the fact that only a portion of the biomass is active in the anoxic zone
(Equation 2.19).
rsu =−kXSη
Ks+S=−
µmax,HXSη
YH(Ks+S)………...Equation (2.19)
where η is the fraction of denitrifying bacteria in the biomass (g VSS/g VSS) and X is the
concentration of active biomass in the system (mg VSS/L). Combination of Equations
(2.19) and (2.20) yields the denitrification rate as shown in Equation (2.20).
rNO3−N =−
(1−YH,NOx)+(1− fXI)YH,NOx
2.86 "
#
$ %
&
'µmax,HXη YH
S KS+S
….Equation (2.20)
Dissolved oxygen can inhibit nitrate reduction by repressing the nitrate reduction
18
18
rsu=−
kXS
Ks+S
"
#
$ %
&
' NO3
Ks,NO3+NO3
"
#
$$ %
&
'' KO
KO+DO
"
#
$ %
&
'η……..Equation (2.21)
where KO is DO inhibition coefficient for nitrate reduction (mg/L) and Ks,NO3 is half
velocity coefficient for nitrate (mg/L). Values of 0.1-0.2 mg/L and 0.1 have been
proposed for KO and Ks,NO3, respectively.
2.2.2 Nitrification and Denitrification Microbial Communities
The bacteria capable of denitrification are both heterotrophic and autotrophic. The
heterotrophic organisms include Achromobacter, Acinetobacter, Agrobacterium,
Alcaligenes, Arthrobacter, Bacillus, Chromobacterium, Corynebacterium,
Flavobacterium, Hypomicrobium, Moraxella, Neisseria, Paracoccus, Propionibacterium,
Pseudomonas, Rhizobium, Rhodopseudomonas, Spirillum, and Vibrio, of which
Pseudomonas species are the most common and widely distributed of all the denitrifiers,
and have been shown to use a wide range of organic compounds such as hydrogen,
methanol, carbohydrates and VFAs (Payne , 1981, Metcalf and Eddy, 2003). Most of the
aforementioned species are facultative aerobic organisms with the ability to use oxygen,
nitrate, and nitrite.
In a study conducted by Mohseni and Elliott (1998), the dominant denitrifying
bacteria for methanol, ethanol, and acetic acid were species of P.fluoresence,
P.mendocina, and P.stutzeri, which belong to Pseudomonas genus. This is in agreement
with the results an older study by Blaszczyk et al. (1980).
2.3
Emerging Biological Nutrient Removal Processes
Autotrophic bacteria can grow heterotrophically if an organic carbon source is