Type of the Paper: Article
1
Exploring the influence of the microstructure on the
2
passive layer chemistry and breakdown for some
3
titanium-based alloys in normal saline solution
4
Nader El-Bagoury1,2, Sameh Ibrahim2,4, Ola Ahmed Abu Ali1, Shimaa El-Hadad3, Ahmed M.
5
Fallatah1, G.A.M. Mersal1,5, Mohamed M. Ibrahim1,6, Joanna Wysocka7, Jacek Ryl*7, Rabah
6
Boukherroub8, Mohammed A. Amin*1,9
7
1 Department of Chemistry, Faculty of Science, Taif University, 21974, Taif, P. O. Box 888, Saudi
8
Arabia
9
2 Department of Physics, Faculty of Science, Taif University, 888 Hawiya, Saudi Arabia
10
3 Central Metallurgical Research and Development Institute, P.O. Box: 87 Helwan, Cairo, Egypt
11
4 Department of Physics, Faculty of Science, Ain Shams University, 11566 Abbassia, Cairo, Egypt
12
5 Chemistry Department, Faculty of Science, South Valley University, Qena, Egypt
13
6 Chemistry Department, Faculty of Science, Kafrelsheikh University, 33516, KafrElSheikh, Egypt
14
7 Department of Electrochemistry, Corrosion and Materials Engineering, Chemical Faculty, Gdansk
15
University of Technology, Narutowicza 11/12, 80-233 Gdansk, Poland
16
8 Univ. Lille, CNRS, Centrale Lille, ISEN, Univ. Valenciennes, UMR 8520 - IEMN, F-59000 Lille,
17
France
18
9 Department of Chemistry, Faculty of Science, Ain Shams University, 11566 Abbassia, Cairo, Egypt
19
20
* Correspondence: jacek.ryl@pg.edu.pl; +48-58-347-1092 (J.R.)
21
maaismail@yahoo.com +966-545-707-507 (M.A.)
22
23
Abstract: The effect of microstructure and chemistry of passive films on the kinetics of passive
24
layer growth and passivity breakdown of some Ti-based alloys, namely Ti-6Al-4V, Ti-6Al-7Nb and
25
TC21 alloys was studied. The rate of pitting corrosion was evaluated using cyclic polarization
26
measurements. Chronoamperometry was applied to assess the passive layer growth kinetics and
27
breakdown. Microstructure influence on the uniform corrosion rate of these alloys was also
28
investigated employing Tafel extrapolation and dynamic electrochemical impedance spectroscopy.
29
Corrosion studies were performed in 0.9% NaCl solution at 37 oC, and the obtained results were
30
compared with ultrapure Ti (99.99%). The different phases of the microstructure were
31
characterized by X-ray diffraction and scanning electron microscopy. Chemical composition and
32
chemistry of the corroded surfaces were studied using X-ray photoelectron analysis. For all studied
33
alloys, the microstructure consisted of α matrix, which was strengthened by β phase. The highest
34
and the lowest values of the β phase’s volume fraction were recorded for TC21 and Ti-Al-Nb alloys,
35
respectively. The uniform corrosion rate and pitting corrosion resistance (Rpit) of the studied alloys
36
were enhanced following the sequence: Ti-6Al-7Nb < Ti-6Al-4V << TC21. The corrosion resistance
37
of Ti-Al-Nb alloy approached that of pure Ti. The obvious changes in the microstructure of these
38
alloys, together with XPS findings, were adopted to interpret the pronounced variation in their
39
corrosion rates.
40
Keywords: Titanium-based alloys; Microstructure; Passivity breakdown; Pitting corrosion
41
42
43
1. Introduction
44
Titanium and its alloys are widely used in many industrial applications, because of their highly
45
desirable properties, including very good mechanical properties, excellent corrosion and erosion
46
resistance, and favorable strength to weight ratios [1]. In fact, titanium and its alloys have
47
experienced increased use in the past years as biomaterials, because of their superior
48
biocompatibility, high resistance to localized and generalized corrosion, and their good mechanical
49
properties (fatigue resistance) [2]. Among all titanium and its alloys, the commonly used materials in
50
biomedical area are commercially pure titanium (cp Ti) and its (+ ) Ti6-Al4-V alloy [3–5].
51
Next to biomedical applications, aerospace sector has dominated titanium use, instead of heavy
52
steel components, in fabricating crucial and decisive systems such as airfoils and airframes [6–9].
53
About 50% of titanium used in the aerospace industry is the (α+β) alloy Ti-6Al-4V. This alloy
54
possesses a perfect combination of operational and technological properties [10,11]. Titanium alloys
55
have also found widespread applications in a variety of fields such as in chemical and petrochemical
56
sectors due to their excellent corrosion resistance [12]. The outstanding characteristics (such as high
57
specific strength, high fatigue strength, good corrosion resistance, etc.) of the titanium alloys
58
(particularly Ti-6Al-4V) are attributed to a very stable native oxide film (1.5 – 10 nm) formed on the
59
Ti and Ti-alloy surface upon exposure to atmosphere and/or aqueous environments [13,14].
60
However, this thin oxide layer can be damaged and thus strongly impacts the bioactivity and other
61
characteristics of the material. To improve the performance of Ti and Ti-alloys for biomedical and
62
aerospace applications, oxidation (anodization) has been applied as a successful approach to
63
improve the material properties [15].
64
The microstructure, formed during various processing methods, is found to greatly affect the
65
mechanical properties of titanium alloys [16]. The microstructure type (bimodal, lamellar and
66
equiaxed) affects the mechanical properties of Ti based alloys [17]. Even though, the corrosion of
67
Ti-alloys in different environments was previously studied [18,19], to the best of our knowledge,
68
literature data revealed no reports concerning the passive layer growth kinetics and breakdown, and
69
subsequent initiation and propagation of pitting corrosion over the surfaces of Ti-6Al-7Nb,
70
Ti-6Al-4V, and TC21 alloys. For this reason, the main objective of this work is to shed more light on
71
the pitting corrosion characteristics of these alloys, employing cyclic polarization and
72
chronoamperometry measurements. In addition, the uniform corrosion behavior of these alloys was
73
also studied based on Tafel extrapolation and EIS methods. All measurements were conducted in
74
0.9% NaCl solution at 37 oC.
75
2. Materials and Methods
76
The working electrodes investigated in this study consist of three Ti-based alloys, namely
77
Ti-6Al-4V, Ti-6Al-7Nb and TC21; their chemical compositions are presented in Table 1. The
78
microstructure of these alloys was studied by Meiji optical microscope fitted with a digital camera. A
79
JEOL JSM5410 and Hitachi S-3400N scanning electron microscopes (SEM) were also used for
80
microstructure studies. For this purpose, the specimens were prepared following ASTM E3-11
81
standard metallographic procedures, and then etched in a mixture of 5 mL HNO3, 10 mL HF and 85
82
mL H2O. The alloys were machined in the form of rods to perform electrochemical measurements.
83
These rods were mounted in a polyester resin offering an active cross-sectional area of ~ 0.2 cm2.
84
Prior to conducting any electrochemical analysis, the surface of the working electrode was cleaned
85
and polished using a silicon carbide paper (600-grit) installed on a polishing machine (Minitech 233).
86
The surface was then washed in distilled water. Finally, an absolute ethanol was used for rinsing.
87
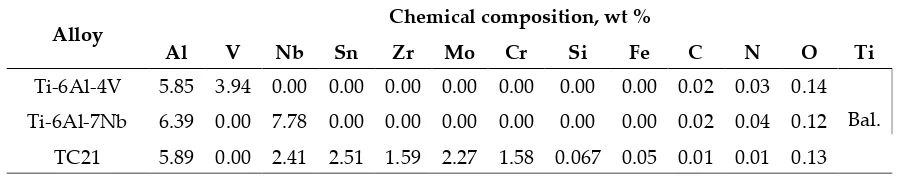
Table 1 - Chemical composition of investigated Ti alloys
90
Alloy Chemical composition, wt %
Al V Nb Sn Zr Mo Cr Si Fe C N O Ti
Ti-6Al-4V 5.85 3.94 0.00 0.00 0.00 0.00 0.00 0.00 0.00 0.02 0.03 0.14 Bal. Ti-6Al-7Nb 6.39 0.00 7.78 0.00 0.00 0.00 0.00 0.00 0.00 0.02 0.04 0.12
TC21 5.89 0.00 2.41 2.51 1.59 2.27 1.58 0.067 0.05 0.01 0.01 0.13
91
Electrochemical measurements were conducted in a standard, double-walled electrochemical
92
cell with an inner volume capacity of 200 mL. Temperature of the test solution is maintained
93
constant at the desired value by means of a temperature-controlled water bath (FP40-MA
94
Refrigerated/Heating Circulator). The water, after being adjusted at 37 ± 0.1oC, is allowed to circulate
95
through external jacket of the cell. The cover of the electrochemical cell has five openings with
96
different sizes. Such openings were designed to be fitted to the working electrode, counter electrode
97
(a long, coiled platinum wire), reference electrode (KCl-saturated calomel electrode, SCE), a
98
thermometer and a gas inlet/outlet for gas release. The reference electrode is placed in a Luggin
99
capillary, the tip of which is adjusted to be close to the working electrode to minimize iR drop. The
100
cell was connected to a Potentiostat (Autolab PGSTAT30). The test solution was a normal saline
101
(0.9% NaCl). A Millipore Milli-Q water system (18.2 MΩ cm) was used to freshly prepare the saline
102
solution. The salt was of analytical grade and purchased from Sigma-Aldrich.
103
Linear sweep voltammetry (LSV), Tafel plots, and EIS techniques were applied to investigate
104
the uniform corrosion characteristics of the studied alloys. The susceptibility of these alloys to
105
passivity breakdown was evaluated via conducting CP and CA measurements. Uniform corrosion
106
measurements were started by stabilizing the working electrode at the rest potential for 2 h,
107
followed by conducting EIS measurements at the respective corrosion potential (Ecorr) every day for a
108
week of exposure in 0.9% NaCl solution at 37 oC, covering a wide frequency range (100 kHz –10
109
mHz), with 15 mV perturbation amplitude. Uniform corrosion study is ended by constructing Tafel
110
plots via sweeping the electrode potential around the Tafel potential (E = Ecorr ± 250 mV), applying a
111
sweep rate of 1.0 mV s-1. After that, the electrode is removed from the cell (which is cleaned properly
112
and re-filled up with a new fresh test solution), cleaned and polished up to the mirror finish, as
113
described above, and then inserted in the cell for cyclic polarization measurements.
114
Chronoamperometry technique was also applied using a new set of cleaned and polished electrodes
115
submerged in a cleaned cell filled with a new fresh solution.
116
Prior to performing cyclic polarization technique, the working electrode is allowed to stabilize
117
at the rest potential for 2 h, then swept linearly, with a sweep rate of 1.0 mV s-1, starting from a
118
cathodic potential of -2.0 V vs. SCE till +8.0 V vs. SCE. The potential sweep was then reversed back
119
with the same sweep rate to reach the start point again thus, forming one complete cycle. To
120
conduct chronoamperometry (current vs. time) measurements, a two-step route was applied. The
121
working electrode is first held at a starting cathodic potential of -2.0 V vs. SCE for 60 s, then polarized
122
towards the anodic direction with a sweep rate of 1.0 mV s-1 till the required anodic potential (Ea).
123
Finally, the anodic current was measured versus time (5.0 min) by holding the working electrode at
124
Ea. To ensure results' reproducibility, each run was repeated at least three times, where mean values
125
of the various electrochemical parameters and their standard deviations were calculated and
126
reported.
127
The XRD diffraction patterns were collected for the bulk samples using a SmartLab SE (Rigaku
128
Americas Corporation, USA) X-ray diffractometer with Cu Kα (λ = 1.54056 Å) operated at 40 kV and
129
40 mA. The scanning speed was 0.2°/min and the scanning angle ranged from 20° to 100° in 2θ.
130
Energy dispersive X-ray spectroscopy (EDS) measurements were utilized in order to determine
131
microstructural composition of investigated alloys as well as evaluate changes in chemistry as a
132
result of exposure to corrosive media. S-3400N SEM was equipped with UltraDry detector from
133
ThermoFisher Scientific. High-resolution X-ray photoelectron spectroscopy (XPS) studies were
134
energy was 20 eV and the spot size diameter was 650 m. Charge compensation was controlled
136
through the low-energy electron and low energy Ar+ ions emission by means of a flood gun
137
(emission current: 150 A, beam voltage: 2.1 V, filament current: 3.5 A). Avantage software
138
(Thermofisher Scientific) was used for deconvolution purposes.
139
3. Results and discussion
140
3.1. Microstructure investigation
141
Based on the morphology of phase, the microstructure of titanium alloys can be classified into
142
equiaxed, lamellar and bi-modal microstructures [20]. The microstructure of Ti-based alloys can be
143
controlled based on their chemical composition, or in other words, based on the balance between the
144
phase stabilizing elements, such as Al, Sn and O, and the forming phase elements like V, Mo and
145
Nb [21]. As shown in Fig. 1, the microstructure of all studied titanium alloys consists of bimodal
146
structure of / phases. The initial microstructure of Ti-Al-V and Ti-Al-Nb alloys in as-received
147
(forged) state is represented by equiaxed grains of primary α-phase (dark), as well as β-transformed
148
structure (light), as it can be seen in Fig. 1. The phase formed in the microstructure of both alloys is
149
globular in shape, but seems larger in size in Ti-Al-V alloy than in Ti-Al-V alloy. The particle size of
150
phase in Al-Ti-V alloy is about 0.5 to 1.5 m; however its size in Ti-Al-Nb alloy reaches about 0.25
151
to 1 m, as shown in Fig. 1 (a) and (b).
152
153
154
155
Figure 1. Microstructure of the three investigated Ti alloys: (a) Ti-Al-V, (b) Ti-Al-Nb and (c) TC21.
156
157
Similar to Ti-Al-V and Ti-Al-Nb alloys, the microstructure of TC21 alloy, Fig. 1 (c), contains α
158
and β phases, but displays different morphologies and volume fractions. The TC21 alloy’s β phase
159
consists of two shapes; the first one is acicular-like structure, Fig. 2 (a), while the other one is a
160
blocky shape, Fig. 2 (b). The thickness of the acicular β phase in the TC21 alloy’s microstructure is
161
ranging from around 0.2 to 0.6 m, while the size extent of the blocky β phase is about 0.75 to 1.5 m.
162
Moreover, the volume fraction of β phase in the microstructure of TC21 alloy is higher than that in
163
the Ti-Al-V and Ti-Al-Nb alloys’ microstructure, as depicted in Fig. 1.
164
165
166
167
Figure 2 - Morphology of phase in TC21 alloy: (a) acicular-like structure and (b) blocky shaped
168
structure
169
Table 2 illustrates the volume fraction of α and β phases in the microstructure of the studied
171
titanium alloys. The microstructure of pure Ti has the highest volume fraction of the phase (~100%)
172
and the lowest volume fraction of phase (~0.0%). The presence of Al (-phase stabilizer) and V
173
(-phase stabilizer) as alloying elements in the chemical composition of Ti-Al-V alloy influence the
174
volume fraction of and phases. The values of the volume fractions of and phases (Table 2) in
175
the microstructure of Ti-Al-V alloy were 65% and 35%, respectively. Replacing V with Nb, yielding
176
Ti-Al-Nb alloy, resulted in an obvious enhancement in the volume fraction of phase (increased to
177
77%) at the expense of that of the phase, which decreased to 23%, as shown in Table 2. The volume
178
fraction of both phases in the microstructure of TC21 alloy is also altered, most probably due to the
179
mutual combination of the alloying elements of that alloy, revisit Table 1. The volume fractions of
180
and phases in the microstructure of TC21 alloy recorded almost equal values, namely 48% for
181
phase and 52% for phase (Table 2).
182
183
Table 2 - Volume fraction of α and β phases in the investigated Ti based alloys.
184
Alloy Volume fraction, % (α/ β) ratio α phase β phase
Pure Ti 100 0 --
Ti-6Al-4V 65 35 1.86
Ti-6Al-7Nb 77 23 3.35
TC21 48 52 0.92
185
To further assess the influence of chemical composition on the microstructure and volume
186
fraction of and phases, [Al]eq and [Mo]eq were calculated, where [Al]eq and [Mo]eq represent the
187
alloying elements form and phases [5,22]. Table 3 illustrates the calculated values of [Al]eq and
188
[Mo]eq for the tested Ti-based alloys, following Eqs. 1 and 2 [5,22].
189
190
[Al]eq. = [Al] + 0.33[Sn] + 0.17[Zr] + 10[O+C+2N] (1)
191
[Mo]eq. = [Mo] + 0.2[Ta] + 0.28[Nb] + 0.4[W] + 0.67[V] +1.25[Cr] + 1.25[Ni] +
192
+ 1.7[Mn] + 1.7[Co] + 2.5[Fe] (2)
193
194
Table 3 - [Al]eq and [Mo]eq for the investigated alloys [22,23].
195
Alloy [Al]eq [Mo]eq Ratio
TiAlV 8.05 2.64 3.05
TiAlNb 8.59 2.18 3.94 TC21 8.59 5.04 1.71
196
It follows from Table 3 that TiAlNb and TC21 alloys recorded the highest values of [Al]eq, 8.59,
197
while the lowest values were measured for the TiAlV alloy, 8.05. Additionally, TiAlNb alloy
198
achieved the maximum value of [Mo]eq, 3.94, whilst TC21 alloy recorded 1.71. Table 3 also depicts
199
the ratio [Al]eq/[Mo]eq for the tested alloys. TiAlNb alloy displayed the maximum ratio, 3.94, while a
200
minimum ratio of 1.71 was measured for the TC21 alloy. It is obvious that the results obtained from
201
Table 3 agree well with the results in Table 2. The calculated ([Al]eq /[Mo]eq) and (/) ratios are
202
maximum in case of TiAlNb alloy, and minimum for the TC21 alloy.
203
The chemical composition of both phases in all microstructures of the investigated alloys was
204
analyzed using the EDS unit attached to SEM. The EDS spectrum recorded for β phase in the
205
microstructure of Ti-Al-V alloy is depicted in Figure S1 (b) (Supporting Information). The location
206
of the area of analysis is illustrated in Figure S1 (a). The highest peak in the spectrum belongs to the
207
base metal (Ti), in addition to some other peaks from Al and V alloying elements. Similarly, the
208
depicted in Tables 4 and 5. From the results in Tables 4 and 5, it is evident that the Ti, Al, Sn and Zr
210
elements tend to segregate to α phase than to β phase [23]. However, V, Nb, Cr and Mo are β
211
forming elements [24], meaning that higher ratios of these elements are found in β phase rather than
212
in α phase.
213
214
Table 4 - Chemical composition (wt %) of different phases in Ti-Al-V and Ti-Al-Nb alloys.
215
Phase Ti-Al-V alloy (wt %) Ti-Al-Nb alloy (wt %)
Al V Ti Al Nb Ti
5.93 3.24 90.83 6.60 7.65 85.75
5.57 8.04 86.39 4.88 13.79 81.33
216
Table 5 - Chemical composition (at %) of different phases in TC21 alloy.
217
Phase Chemical composition, at %
Al Cr Mo Sn Zr Nb Ti
6.38 1.08 1.82 2.45 1.95 1.98 84.34
6.21 1.71 2.62 2.24 1.11 2.39 83.72
218
The line analysis through β phase is shown in Figure S2 (Supporting Information). The phase
219
β is surrounded by the equiaxed α phase in the microstructure of Ti-Al-Nb alloy. The distribution of
220
different alloying elements, Ti, Nb and Al, is illustrated throughout these two phases. The highest
221
line, in green color, represents the distribution of Ti and the grey line shows that of Nb. Additionally,
222
the third one, in pink color, displays the line analysis of the Al element. Obviously, the β phase has
223
lower Ti and Al contents than the α phase, while it has higher amount of Nb compared to α phase.
224
The distribution of alloying elements such as Ti, Al and Nb in Ti-Al-Nb alloy is depicted in Figure S3
225
(Supporting Information). Mapping analysis for the bimodal α/β microstructure of Ti-Al-Nb alloy
226
is exhibited in Figure S3 (a), Supporting Information, where a clear β phase surrounded by
227
equiaxed α phase is observed at higher magnification, 20000×. Figure S3 (b-d), Supporting
228
Information, illustrates the segregation of Ti, Al and Nb alloying elements, respectively. The
229
distribution of these elements between α and β phases is represented by the density of different
230
colors. The rich areas of Ti, Al and Nb elements are decorated by red color, while the poor areas are
231
painted with dark color. In case of Ti element, as it preferably segregated to α phase, as shown in
232
Figure S2 (Supporting Information), the area of α phase is colored with a combination of red,
233
yellow and pink, however the β phase area, with lower Ti content, has a dark color, see Figure S3
234
(b), Supporting Information. The contrast for the partitioning of Al alloying element between α and
235
β phases is not as clear as in the case of Ti element, Fig. S3 (c), Supporting Information. In addition
236
to the distribution of Ti and Al, the segregation of Nb alloying element, with lower percentage, to α
237
phase is represented by a combination of green, blue and black colors, while the area of the β phase
238
with higher Nb content is decorated by a mixture of red and white colors, as shown in Figure S3 (d),
239
Supporting Information.
240
3.2. X-Ray diffraction studies
241
Phase identification was performed by X-ray diffraction (XRD) patterns to define the phases
242
comprising each alloy sample. The diffraction patterns recorded for the studied alloys are compared
243
all together in Fig. 3. The phases were identified by matching the characteristic peaks with the
244
JCPDS files [25]. The phases α-Ti (JCPDS#00-044-1294), β-Ti (JCPDS#00-044-1288) were common and
245
dominated the composition of the three studied alloys. The Ti-Al-V and TC21 alloys were found to
246
contain solely α-Ti and β-Ti phases, respectively. On the other hand, Ti-Al-Nb alloy contained some
247
Ti and Nb oxides, TiO (JCPDS#00-008-0117) and Nb6O (JCPDS#00-015-0258).
248
250
Figure 3 - XRD diffraction patterns recorded for the samples Ti-6Al-4V, Ti-6Al-7Nb and TC21.
251
252
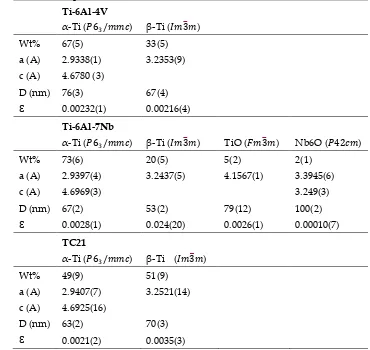
Table 6 - The structural and microstructural parameters of the three alloys obtained by the Rietveld
253
adjustment of the XRD patterns.
254
Ti-6Al-4V
α-Ti ( 6 / ) β-Ti ( 3 )
Wt% 67(5) 33(5)
a (A) 2.9338(1) 3.2353(9) c (A) 4.6780 (3)
D (nm) 76(3) 67(4)
Ɛ 0.00232(1) 0.00216(4)
Ti-6Al-7Nb
α-Ti ( 6 / ) β-Ti ( 3 ) TiO ( 3 ) Nb6O ( 42 )
Wt% 73(6) 20(5) 5(2) 2(1)
a (A) 2.9397(4) 3.2437(5) 4.1567(1) 3.3945(6)
c (A) 4.6969(3) 3.249(3)
D (nm) 67(2) 53(2) 79(12) 100(2)
Ɛ 0.0028(1) 0.024(20) 0.0026(1) 0.00010(7)
TC21
α-Ti ( 6 / ) β-Ti ( 3 )
Wt% 49(9) 51(9)
a (A) 2.9407(7) 3.2521(14) c (A) 4.6925(16)
D (nm) 63(2) 70(3)
Ɛ 0.0021(2) 0.0035(3)
255
An effective procedure for the simultaneous refinement of structural and microstructural
256
parameters based on the integration of Fourier analysis for broadened peaks in the Rietveld method
257
was first proposed by Lutterutti et al. [26] and is implemented in the Maud program [27].
258
Consequently, weight percent (wt.%), lattice parameters, isotropic crystallite size (D) and r.m.s
259
microstrain (µε) were then regarded as fitting parameters in the Rietveld adjustments and were
260
from the ICSD database [28]. The results obtained for the structural and microstructural analysis are
262
summarized in Table 6 for all alloys. It is worth to mention here that, all studied alloys were
263
characterized with considerable degree of preferred orientation which strongly modified the relative
264
intensities of the Bragg reflections, especially for α-Ti and β-Ti phases. The MAUD program also
265
incorporates correction for preferred orientation [29,30] in the Rietveld adjustments in order to
266
obtain the best fitting parameters.
267
The calculated diffraction patterns from the Rietveld adjustment are plotted with the observed
268
ones for the three alloys in Fig. 4. The average R-values obtained for the refinements were about
269
Rwp(%) = 24 to 27 and Rb(%) = 15 to 20. The simultaneous refinements of both structural and
270
microstructural parameters produced good matching of the calculated to observed profiles of
271
diffracted intensities. Also, the incorporation of the preferred orientation models enabled to account
272
for the variations of the peak intensities of α and β-Ti phases.
273
274
275
Figure 4 - The calculated (red line) and observed (black dots) diffraction patterns for the three alloys
276
as obtained from the Rietveld adjustments using the MAUD program; the positions of the Bragg
277
reflections of each phase and the difference between the calculated and observed patterns are also
278
presented at the bottom.
279
280
In the Rietveld adjustment of the alloy Ti-Al-V, the hcpα-Ti (Space group
6 /
) together281
with the bcc β-Ti (Space group
3
) dominated the composition of the alloy. In the second alloy,282
Ti-Al-Nb, the formation of some TiO (Space group
3
) and Nb6O (Space group42
) was283
observed and they form larger crystallites than those formed in the Ti phases. The total weight
284
percent of those oxide phases is less than 10% (Table 6). For the third alloy, TC21, only α and β-Ti
285
phases were observed in the XRD patterns. No oxide phases were detected due to the slight oxygen
286
content of this alloy. Nevertheless, there are some mismatches between the wt% values obtained
287
from the Rietveld adjustments and the corresponding wt% values obtained with other techniques.
288
This can be attributed to the behavior of the preferred orientation of the α-Ti phase observed for the
289
reflection (100), which was relatively stronger for the Ti-6Al-4V and Ti6Al7Nb alloys than in the
290
TC21 alloy.
291
As can be seen from Table 6, the last two alloys, Ti-Al-Nb and TC21, contain relatively higher
292
portions of β-Ti than α-Ti in contrast to the first alloy, Ti-Al-V, which has α-Ti content higher than
293
β-Ti. As known from literature, Al is an α-stabilizing while V, Nb, Mo and Fe are β-stabilizing.
294
Nevertheless, the results indicate that Nb, Mo and Fe have stronger capabilities to stabilize β-Ti
295
phase than V. These findings corroborate microstructural studies (revisit section 3.1).
296
3.3. Electrochemical measurements
298
3.3.1.Uniform corrosion studies
299
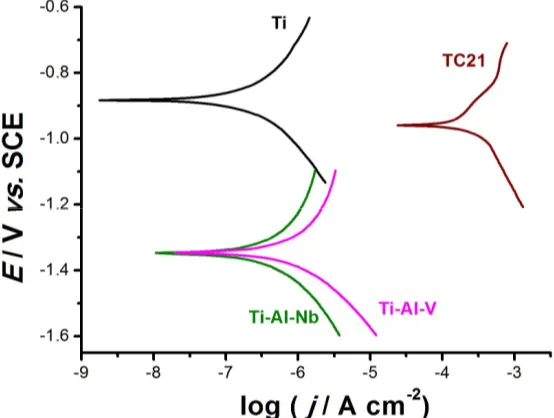
Figure 5 illustrates the Tafel plots for the cathodic and anodic domains for the studied alloys in
300
comparison with pure Ti, after 7 days of immersion in 0.9% NaCl solution at 37 oC. Table 7 depicts
301
the various electrochemical parameters derived from such polarization measurements. It follows
302
from Fig. 5 that, among the studied alloys, TC21 alloy exhibited the lowest cathodic and anodic
303
overpotentials, corresponding to increased corrosion current density (jcorr) values. This is clear from
304
Table 7, which revealed that TC21 alloy recorded a jcorr value of 0.32 mA cm-2, which is 940, 640, and
305
320 times greater than those measured for pure Ti (3.4 × 10⁻⁴ mA cm-2), Ti-Al-Nb (5 × 10⁻⁴ mA cm-2),
306
and Ti-Al-V alloys (10-3 mA cm-2), respectively. These findings reveal that the rate of the uniform
307
corrosion of the studied alloys increases following the order: Ti < Ti-Al-Nb < Ti-Al-V << TC21.
308
309
310
Figure 5 - Cathodic and anodic polarization curves recorded for the three tested alloys in
311
comparison with pure Ti, after 7 days of exposure in 0.9% NaCl solution at a scan rate of 0.5 mV s-1 at
312
37oC.
313
314
Table 7 - Mean values of the various electrochemical parameters obtained from Tafel extrapolation
315
method for pure Ti and the three tested alloys after 7 days of exposure in 0.9% NaCl solution at 37oC.
316
Tested alloy Ecorr / mV(SCE)
βc /
mV dec-1
βa /
mV dec-1
jcorr /
mA cm-2
Pure Ti -880 -296 400 3.4 × 10⁻⁴
Ti-Al-Nb -1350 -120 240 5 × 10⁻⁴
Ti-Al-V -1340 -240 480 10-3
TC21 -960 -400 560 0.32
317
EIS measurements were also conducted at the respective Ecorr throughout the exposure in 0.9%
318
NaCl solution at 37 oC to confirm the polarization data and to assess the kinetics of the uniform
319
corrosion process on the surfaces of the tested alloys. Fig. 6 displays the impedance plots in Nyquist
320
projection, recorded for the studied alloys. Pure Ti (99.99%) was also included for comparison.
321
Plotting time of exposure on X-axis of impedance diagrams allowed for monitoring of uniform
322
corrosion susceptibility [31–33]. It can be observed that in each case the impedance spectra recorded
323
at day 1 (after initial 120 min of conditioning) were highly scattered due to non-stationary conditions
324
at the metal/electrolyte interface, which is a common problem in EIS measurements. This issue
325
taken for further analysis. The impedance loop appeared as an open arc with a big diameter
327
(charge-transfer resistance, Rct), hence the overall corrosion resistance of each investigated alloy is
328
very high. Ti-6Al-4V and Ti-6Al-7Nb alloys seem to be stable over time of the exposure, with
329
Ti-6Al-7Nb alloy being more corrosion resistant than Ti-6Al-4V alloy, while the results obtained for
330
TC21 reveal gradual decrease of the impedance loop, corroborating DC electrochemical studies.
331
332
333
Figure 6 - Nyquist impedance plots recorded for the three tested alloys in comparison with pure Ti
334
at the respective Ecorr in 0.9 % NaCl solution at 37 oC. The changes in spectra shape with exposure
335
time (7 days) can be tracked on X-axis.
336
337
All impedance plots showed a single time constant (capacitive loop), which can be verified on
338
the corresponding Bode plots after 7 days of exposure (Fig. 7). An electric equivalent circuit (EEC)
339
was proposed to analyze the impedance results. Due to absence of additional time constants, a
340
simple Randles circuit was proposed with constant phase element (CPE) selected instead of
341
capacitance to take into consideration surface distribution of capacitance dispersion. The parallel
342
resistance represents the charge-transfer resistance RCT through the metal/electrolyte interface [34].
343
344
345
Figure 7 - Bode plots of each investigated alloy on the day 7 of exposure in comparison with pure Ti
346
(99.99%) at the respective Ecorr in 0.9 % NaCl solution at 37 oC.
347
348
The aforementioned capacitance dispersion may in particular originate from geometric
349
adsorption processes of passive layer breakdown [35]. The CPE impedance ZCPE = (Q(j)n)-1
351
represents a capacitor with capacitance 1/Q for a homogeneous surface n 1. Thus, it is often
352
believed that CPE component n is the heterogeneity factor and its variation can be monitored. CPE
353
describes quasi-capacitive behaviour of passive layer in case of its double layer perforation. The
354
effective capacitance Ceff can be calculated on the base of CPE using Hirschorn's model for surface
355
distribution of time constants [36]. The EEC can be schematically written as RS(QRCT), where RS is
356
electrolyte resistance. The aforementioned single time-constant EEC covers all the applied frequency
357
range.
358
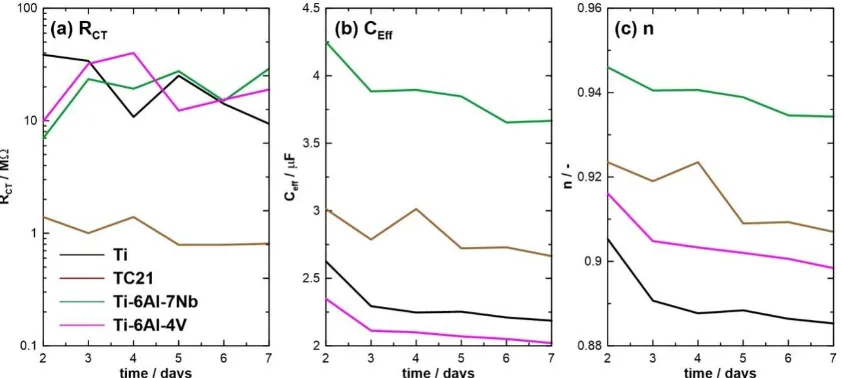
Fig. 8 depicts the electric parameters obtained on the base of RS(QRCT) EEC and their changes
359
during the one-week long exposure. The higher the RCT the lower the corrosion current density,
360
offering an easy comparison in uniform corrosion resistance of investigated alloys, see Fig. 8a. Each
361
investigated alloy is characterized with very high resistance, range of M, owing to a presence of a
362
passive layer tightly covering metal surface. Nevertheless, for TC21 alloy, RCT value is one order of
363
magnitude lower and slowly but consistently decreases throughout the exposure, revealing its lower
364
corrosion resistance. High scatter of RCT value is inversely proportional to measured fraction of
365
impedance semicircle (as seen on Fig. 6).
366
367
368
Figure 8 - Charge transfer resistance RCT, effective capacitance Ceff and CPE exponent n calculated on
369
the base of RS (QRCT) EEC for each investigated alloy. The one-week long exposure was carried out in
370
0.9 % NaCl solution at 37 oC.
371
372
The analysis of constant phase element (CPE) allows to draw conclusions on passive layer
373
homogeneity. The effective capacitance Ceff, calculated with surface distribution model is similar for
374
each investigated alloy, falling in a range between 2 and 5 F. The differentiation may result from
375
differences in passive layer thickness d and to some extent from relative permittivity of alloying
376
additives and their oxides r according to: C = 0rd/A, where 0 is the absolute permittivity and A is
377
the electrochemically active surface area. A steady decrease of Ceff should be attributed to an increase
378
of passive layer thickness, denouncing further passivation of metal in investigated electrolytic
379
conditions. The presence of stable corrosion pits would be visible in a form of rapid increase in Ceff
380
[36,37] (likely observed at TC21 alloy at day 4).
381
The initial value of CPE exponent n depends on factors such as surface phase distribution and
382
geometric defects remaining as a result of polishing. Its decrease throughout the exposure in
383
corrosive electrolyte reflects the appearance of heterogeneities on analyzed sample surface, which in
384
this case is primarily associated with initial phases of corrosion pits formation (see Fig. 8c). This
385
effect is clearly seen on SEM micrographs further in the manuscript. Notably, the value of n factor of
386
Ti-6Al-7Nb alloy was both: the highest as well as the least affected by exposure in corrosive media.
387
The aforementioned observation indicates high surface homogeneity, which may be the reason
388
3.3.2.Cyclic polarization measurements
390
Figure 9 shows typical cyclic polarization curves in the linear (E vs. j) and logarithmic (E vs.
391
log j) formats recorded for the studied alloys between −2.0 V and +8.0 V (SCE). Measurements were
392
conducted in 0.9% NaCl solution at a scan rate of 5.0 mV s-1 at 37 oC. The logarithmic form of these
393
curves (E vs. log j), Fig. 9 (b), is also constructed to define precisely the location of the pitting
394
potential (Epit) and repassivation potential (Erp) versus the corrosion potential (Ecorr). Fig. 9 (a1) is
395
zoomed with a very narrow range of current around the cathodic and anodic processes covering the
396
whole studied potential range to yield Fig. 9 (a2). It follows from Fig. 9 (a2) that, for all tested
397
samples, the cathodic current density diminishes progressively reaching its zero value at the
398
corrosion potential (Ecorr).
399
400
401
402
Figure 9 - Linear, (a1) and (a2), and logarithmic (b) cyclic polarization curves recorded for the studied
403
alloys in 0.9% NaCl solutions at a scan rate of 1.0 mV s-1 at 37 oC.
404
405
The polarization curve of TC21 alloy exhibits active dissolution near Ecorr, followed by an
406
obvious enhancement in the anodic current with the applied potential due to thinning and
407
weakening of the passive layer as a result of the aggressive attack of Cl- anions. Also, Ti-Al-Nb and
408
Ti-Al-V alloys show active dissolution near Ecorr, but to a much lower extent than TC21, and in
409
addition, tend to passivate with a very low current (passive current, jpass) covering a wide range of
410
potential. These findings reflect the weaker passivity of TC21 and its higher tendency to corrode in
411
this solution than Ti-Al-V and Ti-Al-Nb alloys. On the contrary, as expected, the anodic polarization
412
curve of pure Ti exhibits typical passivity near Ecorr, referring to its high corrosion resistance.
413
Passivity of the studied alloys persists up to a certain critical potential, designated here as the
414
pitting potential (Epit). Remarkable changes occurr within the passive region at potentials exceeding
415
potential scan. These events are a clear sign for passivity breakdown, and initiation and propagation
417
of pitting corrosion.
418
In general, the electrochemical systems suffering from pitting corrosion are characterized by a
419
hysteresis loop in their cyclic voltammograms. Such a loop refers to the continuation of pitting
420
corrosion even after potential scan reversal (pitting corrosion’s autocatalytic nature), indicating
421
repassivation delay of the existing pits. Repassivation is only achieved when the reverse scan
422
intersects the forward one within the passive region in a point designated here as the repassivation
423
potential, Erp, below which the working electrode is immune against pitting. Others defined it as the
424
potential below which no pit could grow, or in other words, a pit once initiated, will stop [38].
425
A current intermission can be seen on the reverse scan of the three tested alloys. This current
426
discontinuity is quite clear on the reverse scan of the TC21 alloy, and can be observed for alloys
427
Ti-Al-Nb and Ti-Al-V in the inset of Fig. 9 (a1). It takes place at two distinct potentials (E1ptp and E2ptp),
428
designated here as the pit transition potential (Eptp), the potential between bare and salt-covered
429
state, where diffusion control dominates beyond Eptp [38]. We previously reported similar findings
430
during pitting corrosion studies of Zn in nitrite solutions [39] and recently by Zakeri et al. [40], who
431
explored the transition potential and the repassivation potential of AISI type 316 stainless steel in
432
chloride containing media devoid of and containing 0.01 M thiosulfate.
433
At potentials beyond Eptp, the rate of anodic dissolution is diffusion-controlled (controlled by
434
diffusion of metal cations from the salt/pit solution interface into the bulk solution) [38–40]. Such a
435
current transient relationship, when satisfied, refers to an anodic diffusion control process [40]. On
436
reversing the potential scan, the thickness of the salt (pitting corrosion product) film diminishes.
437
This decrease in salt film thickness enhances with back scanning till a certain potential is reached at
438
which the cations' concentration decreases below the saturated concentration. At this stage, salt
439
precipitation is stopped, and the remaining metal salt film will be dissolved, making the bottom of
440
pits free from salt film. This in turn will establish an ohmic/activation control (a linear decrease of
441
current density with potential) regime.
442
Ti-Al-Nb alloy's passivity seems stronger and more stable that of the Ti-Al-V alloy, Fig. 9 (b).
443
The latter is characterized by a higher jpass which enhances with potential till its Epit, which attained ~
444
50 mV vs. SCE before that of the former. In addition, the pits existing on the surface of Ti-Al-V alloy
445
find it much more difficult to repassivate than those on the surface of Ti-Al-Nb alloy, as the
446
hysteresis loop of the former is much larger than that of the later.
447
Another important pitting corrosion controlling electrochemical parameter is the pitting
448
corrosion resistance, Rpit (Rpit = |Ecorr - Epit|), which defines the resistance against the nucleation of
449
new pits [38]. Referring to Fig. 9 (b), it is clear that Rpit increases following the order: TC21 <<
450
Ti-Al-V < Ti-Al-Nb. The resistance against growth of the pits also controls the susceptibility toward
451
pitting corrosion. This can be evaluated via comparing the areas of the hysteresis loops formed
452
during the reverse potential scan of the cyclic polarization curves in its linear format, Fig. 9 (a1). A
453
specific routine of the Software was used to calculate the areas of the hysteresis loops, related to the
454
charge consumed during the growth of such already formed pits. Here again, the hysteresis loop of
455
the TC21 alloy recorded the highest area (charge consumed) among the studied alloys, while the
456
lowest value of the hysteresis loop's charge consumed during was measured for Ti-Al-Nb alloy.
457
This in turn ranks the resistance against the growth of pre-existing pits as Ti-Al-Nb > Ti-Al-V >>
458
TC21. These findings mean that replacing V by Nb in Ti-Al-V alloy promotes alloy’s repassivation
459
thus, enhancing its pitting corrosion resistance.
460
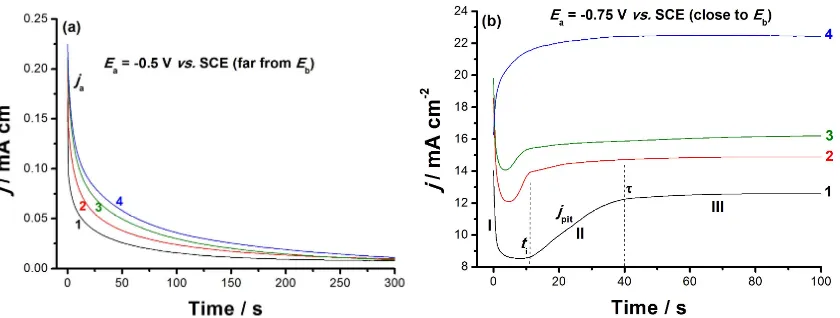
3.3.4.Chronoamperometry measurements
461
Chronoamperometry (j/t) measurements were also carried out to confirm the above results and
462
gain more information about the influence of alloyed V and Nb on the passive layer growth kinetics
463
and breakdown. Figs. 10 (a) and 10 (b) depict the j/t curves measured for the tested alloys at two
464
different Ea values, far below and close to Eb. Measurements were conducted in 0.9% NaCl solution
465
at 37 oC. The profile of the obtained curves is found to vary according to the chemical composition of
466
with two stages is obtained, as shown in Fig. 10 (a). During the first stage, the anodic current (ja)
468
declines with a rate depending upon chemical composition of the tested alloy, denoting passive
469
layer electroformation and growth [39]. This decay in current then reaches a steady-state value (jss),
470
an almost constant passive current related to jpass (revisit Fig. 9), constituting the 2nd stage of the
471
current. The constancy of jss originates from a balance between the rates of the passive layer growth
472
(current builds up) and its dissolution (current decays) [41,42].
473
474
475
Figure 10 - Chronoamperometry (current - time) curves recorded for the studied solder alloys in
476
0.9% NaCl solution at applied anodic potentials of 2.0 and 4.0 V vs. SCE at 37 oC: (1) pure Ti; (2)
477
Ti-6Al-7Nb; (3) Ti-6Al-4V; (4) TC21.
478
479
Further snooping of Fig. 10 (a) demonstrates that the rate of ja decay, and consequently the rate
480
of passive layer growth, diminishes upon alloying Ti with V and Nb. These results further confirm
481
the acceleration influence of the alloying elements V and Nb, with V being more active than Nb,
482
which when added to Ti weakened its passivity via depassivation (destabilizing the passive oxide
483
film through oxide film thinning/dissolution [43]). This in turn makes the passive film more
484
susceptible to pitting.
485
At the Ea value that is very close to Eb, Fig. 10 (b), j/t curves with three different stages (I-III)
486
were obtained. Similar results were previously obtained in our lab [42,44]. Stage I referred to the
487
passive layer electroformation and growth, as its current falls with time [41,42,44]. This stage,
488
namely stage I ends at a certain time (ti), the incubation time, where stage I's current reached its
489
minimum value; ti is defined as the time the adsorbed aggressive Cl- anions must acquire to locally
490
attack and subsequently remove the passive oxide film [41]. The magnitude of ti, more specifically its
491
reciprocal value (1/ti), denotes the rate of pit initiation and growth [41,42], and measures the
492
susceptibility of the oxide film to breakdown and initiate pit formation and growth.
493
Stage II begins at ti and terminates at another time τ, and its current is termed jpit (pit growth
494
current density). jpit increases from the moment just after ti and continues in growth till τ, suggesting
495
that the pit formation and growth dominate over passivation during this stage. Ultimately, jpit
496
attained a steady-state just after the time τ, denoting the onset of stage III, and continues almost
497
constant till the end of the run. The constancy of the stage III's current was attributed to the
498
hindrance of the current flow (jpit) through the pits sealed off by the pitting corrosion products
499
formed during the events of stage II, namely pit initiation and growth [42,44]. This hindrance in jpit is
500
balanced by a current increase due to metal dissolution, thus yielding an overall steady-state
501
current.
502
Close inspection of Fig. 10 reveals that jpit increases and ti gets shorter, thus referring to
503
accelerated pitting attack, in presence of alloyed V. These results again support the catalytic impact
504
of alloyed V towards pitting corrosion
505
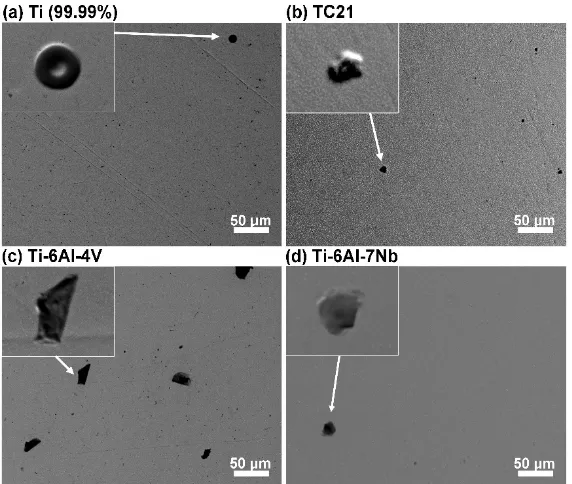
After one-week exposure, investigated samples were reexamined using SEM in order to
507
evaluate the susceptibility to pitting corrosion. This procedure was carried out after rinsing in
508
ethanol using ultrasonic cleaner. The results of the analysis are exhibited on Fig. 11. Defects start to
509
appear at the surface of each analyzed sample throughout the exposure. The micrographs in the
510
inset of Fig. 11 were taken using back-scatter electrons (BSE) in topography mode. This allowed to
511
bring out the geometry of aforementioned defects. As can be seen, each analyzed defect forms shape
512
of a bulge above alloy's surface, testifying for either repassivation once formed shallow corrosion
513
pits or at an early, preliminary stage of passive layer degradation. Ti-6Al-4V sample is characterized
514
with both the highest amount and the largest defects, reaching 30 m in diameter. On the other
515
hand, the surface of pure Ti and Ti-6Al-7Nb appeared the most intact. No real corrosion pits were
516
observed on the surface of either investigated alloy at the end of exposure in 0.9% NaCl solution at
517
37 °C, testifying for the overall high pitting corrosion resistance.
518
519
520
Figure 11 - SEM micrographs taken in secondary electron mode for each investigated sample: (a) pure Ti as a
521
reference, (b) TC21 alloy, (c) Ti-6Al-4V, (d) Ti-6Al-7Nb at the end of one-week long exposure in 0.9% NaCl at
522
37 °C. Magnification ×500. In the inset back-scatter electron topography mode images of selected surface
523
defects. Magnification ×2000.
524
525
Nevertheless, the passive layer must have weakened hence it was possible for corrosion
526
products to adsorb on the metal surface. EDS analysis was carried out for defects observed on each
527
investigated alloy in order to qualify their chemical constitution. The exemplary results, obtained for
528
Ti-6Al-7Nb alloy are summarized on Figure S4 (Supporting Information), while the chemistry of
529
defects observed for each investigated alloy were similar. The defects are primarily composed of
530
carbon and oxygen, most likely forming metal carbonates typical for early pitting corrosion stages
531
[45]. Small amount of chlorine was also recorded within defects. Its low amount is distorted by EDS
532
depth of analysis ranging few microns.
533
The chemistry of the passive layer in each examined case is composed primarily of titanium (IV)
534
oxides, as verified by a strong recorded Ti2p peak doublet, with Ti2p3/2 component located each time at
535
458.6 eV [35,46,47], Fig. 12. Furthermore, there is no sign of titanium oxides at lower oxidation states
536
corroborating the aforementioned result. Besides the titanium, other alloying additives also take part
537
in passivation process. The strongest signal among the alloying additives was recorded for
538
aluminum oxide Al2O3 (Al2p3/2 peak at 74.5 eV), ranging between 3.5 and 3.8 at.% for each sample
539
[48,49]. The contribution of VO2 (V2p3/2 at 516.4 eV) in Ti-Al-V and Nb2O5 (Nb3d5/2 at 207.1 eV) in
540
alloy is naturally more complex. Besides TiO2, it is composed of Al2O3 (3.8 at.%), Nb2O5 (0.3 at.%),
542
ZrO2 (0.4 at.%, Zr3d5/2 at 182.4 eV), Cr2O3 (0.8 at.%, Cr2p3/2 at 576.0 eV), SnO2 (0.1 at.%, Sn3d3/2 at 486.5
543
eV), MoO3 and MoO2 (0.2+0.2 at.%, Mo3d5/2 at 232.9 and 229.2 eV, respectively) [52–55].
544
545
546
Figure 12 – High-resolution XPS spectra recorded in Ti2p, Cl2p and O1s energy range for each
547
investigated alloy after 7 days of exposure to 0.9% NaCl solution at 37 oC.
548
549
The high-resolution spectra analysis carried out in the Cl2p energy range confirms the
550
electrochemical and microscopic studies regarding chloride adsorption on the metal surface as a
551
result of 7-day metal exposure to chloride-containing electrolyte. Full chemical analysis is
552
summarized in Table 8. Metal chlorides were found on the surface of each investigated sample,
553
which confirms metal-chlorine covalent bond formation, testified by a peak doublet: Cl2p3/2 at 198.9
554
eV [35,42,56]. Nevertheless, the amount of adsorbed chlorides is nearly 2.5 times higher for the TC21
555
alloy than pure titanium. The chloride concentration obtained for highly resistant Ti-Al-Nb alloy is
556
nearly on par with Ti sample, and slightly smaller than in the case of Ti-Al-V. An interesting
557
conclusion may be drawn based on O1s peak analysis for each investigated sample. The spectra were
558
conventionally deconvoluted into three components. Two dominant components located at 530.2
559
and 531.6 eV are ascribed to Me-O and Me-OH species, respectively. The second component
560
intensity may be further influenced by presence of C-O bonds in carbonates. Its formation may result
561
from prolonged electrolyte exposure but also adventitious carbon formation due to air exposure
562
[48,51]. The finding regarding carbonates adsorption on the metal surface is further confirmed by
563
third O1s component at 532.8 eV, typical for C=O bonds but also chemisorbed water molecules. For
564
clarity purposes the analysis excluded data recorded for carbon C1s, which was found in large
565
amounts, up to 30 at.%, at binding energies corroborating adventitious carbon and carbonates
566
findings. Importantly, the highest amount of the adsorbed carbonate species was found on Ti-Al-V
567
sample surface, which is in very good agreement with SEM micrographs presented on Fig. 11. The
568
least amount of carbonate species was once more found on the surface of Ti sample.
569
570
Table 8 – XPS deconvolution results carried out in Ti2p, Cl2p and O1s energy range after 7 days of
571
exposure to 0.9% NaCl solution at 37 oC (in at.%).
572
Ti2p other
additives
O1s Cl2p
TiO2 Me-O OH/CO C=O/H2O Me-Cl
BE / eV 458.6 * 530.2 531.6 532.8 198.9
Ti 21.3 -- 37.5 26.2 13.1 1.9
Ti-Al-V 17.4 4.3 28.8 25.7 20.8 3.0
Ti-Al-Nb 17.1 4.4 31.1 27.0 18.2 2.2
4. Conclusions
573
The effect of microstructure on the uniform and pitting corrosion characteristics of Ti-Al-V, and
574
Ti-Al-Nb alloys is presented here. Pure Ti and TC21 alloy were included for comparison.
575
Measurements were conducted in 0.9% NaCl solution at 37 oC employing various electrochemical
576
techniques, and complemented with XRD and SEM/EDS examinations. The obtained results
577
revealed that:
578
1.
The microstructure of the investigated alloys consists of α matrix, which was579
strengthened by β phase in all studied alloys except cp-Ti alloy.
580
2.
The volume fraction of phase in TC21 alloy is higher than in both Ti-Al-V and581
Ti-Al-Nb alloys. In comparison with other alloys, Ti-Al-Nb alloy has the lowest volume
582
fraction of phase.
583
3.
Ti-Al-Nb alloy has the highest corrosion resistance among other alloys where it has the584
lowest corrosion rate.
585
4.
The addition of Nb alloying element at the expense of V in Ti-Al-V alloy decreased the586
volume fraction of phase, which improves the corrosion resistance of Ti based alloy.
587
5.
The XPS results revealed adsorption of chloride and carbonate species on the surface of588
the investigated alloys, which amount is the lowest for cp-Ti and Ti-Al-Nb alloys,
589
affecting the observed corrosion resistance.
590
6.
Corrosion studies revealed that the uniform and pitting corrosion rates increase591
following the sequence: Ti < Ti-Al-Nb < Ti-Al-V < TC21.
592
Supplementary Materials: The following are available online at www.mdpi.com/xxx/s1
593
Author Contributions: conceptualization, M.A. and R.B.; resources, N.E. and S.E.; investigation, S.I and O.A.
594
(XRD), A.F. and M.I. (uniform corrosion), M.A. and G.M (passive layer breakdown), N.E., J.W. and S.E.
595
(microstructure), J.R. (XPS), J.R. and J.W. (EIS); writing – original draft preparation, all authors; writing – review
596
and editing, J.R., M.A. and R.B., project administration M.A.
597
Funding: This study was funded by the Deanship of Scientific Research, Taif University, Saudia Arabia (Project
598
No. 1 – 439 - 6070).
599
Conflicts of Interest: The authors declare no conflict of interest.
600
References
601
1. Assis, S.L. de; Wolynec, S.; Costa, I. Corrosion characterization of titanium alloys by electrochemical
602
techniques. Electrochimica Acta 2006, 51, 1815–1819.
603
2. Geetha, M.; Singh, A.K.; Asokamani, R.; Gogia, A.K. Ti based biomaterials, the ultimate choice for
604
orthopaedic implants – A review. Progress in Materials Science 2009, 54, 397–425.
605
3. Jiang, H. Enhancement of Titanium Alloy Corrosion Resistance via Anodic Oxidation Treatment.
606
International Journal of Electrochemical Science 2018, 3888–3896.
607
4. Moiseyev, V.N. Titanium alloys: Russian aircraft and aerospace applications; Advances in metallic alloys;
608
Taylor & Francis: Boca Raton, 2006; ISBN 978-0-8493-3273-9.
609
5. Titanium and titanium alloys: fundamentals and applications; Leyens, C., Peters, M., Eds.; Wiley-VCH ; John
610
Wiley] (distributor): Weinheim : [Chichester, 2003; ISBN 978-3-527-30534-6.
611
6. Lütjering, G.; Williams, J.C. Titanium: with 51 tables; Springer-Verlag: Berlin, Heidelberg, 2007; ISBN
612
978-3-540-71397-5.
613
7. Oberwinkler, B.; Riedler, M.; Eichlseder, W. Importance of local microstructure for damage tolerant light
614
weight design of Ti–6Al–4V forgings. International Journal of Fatigue 2010, 32, 808–814.
615
8. Knobbe, H.; Köster, P.; Christ, H.-J.; Fritzen, C.-P.; Riedler, M. Initiation and propagation of short fatigue
616
9. Fekry, A.M.; El-Sherif, R.M. Electrochemical corrosion behavior of magnesium and titanium alloys in
618
simulated body fluid. Electrochimica Acta 2009, 54, 7280–7285.
619
10. Whittaker, M. Titanium Alloys. Metals 2015, 5, 1437–1439.
620
11. Mountford Jr., J.A. Titanium - Properties, Advantages and Applications Solving the Corrosion Problems
621
in Marine Service. NACE International 2002.
622
12. Al-Mayouf, A..; Al-Swayih, A..; Al-Mobarak, N..; Al-Jabab, A.. Corrosion behavior of a new titanium
623
alloy for dental implant applications in fluoride media. Materials Chemistry and Physics 2004, 86, 320–329.
624
13. García, C.; Ceré, S.; Durán, A. Bioactive coatings deposited on titanium alloys. Journal of Non-Crystalline
625
Solids 2006, 352, 3488–3495.
626
14. Sharma, A.K. Anodizing titanium for space applications. Thin Solid Films 1992, 208, 48–54.
627
15. Barjaktarević, D.R.; Cvijović-Alagić, I.L.; Dimić, I.D.; Đokić, V.R.; Rakin, M.P. Anodization of Ti-based
628
materials for biomedical applications: A review. Metallurgical and Materials Engineering 2016, 22, 129–144.
629
16. Hines, J.A.; Lutjering, G. Propagation of microcracks at stress amplitudes below the conventional fatigue
630
limit in Ti-6Al-4V. Fatigue <html_ent glyph="@amp;" ascii="&"/> Fracture of Engineering Materials and
631
Structures 1999, 22, 657–665.
632
17. Sieniawski, J.; Ziaja, W.; Kubiak, K.; Motyk, M. Microstructure and Mechanical Properties of High
633
Strength Two-Phase Titanium Alloys. In Titanium Alloys - Advances in Properties Control; Sieniawski, J.,
634
Ed.; InTech, 2013 ISBN 978-953-51-1110-8.
635
18. Gai, X.; Bai, Y.; Li, J.; Li, S.; Hou, W.; Hao, Y.; Zhang, X.; Yang, R.; Misra, R.D.K. Electrochemical
636
behaviour of passive film formed on the surface of Ti-6Al-4V alloys fabricated by electron beam melting.
637
Corrosion Science 2018, 145, 80–89.
638
19. Dadé, M.; Esin, V.A.; Nazé, L.; Sallot, P. Short- and long-term oxidation behaviour of an advanced
639
Ti2AlNb alloy. Corrosion Science 2019, 148, 379–387.
640
20. Reda, R.; Nofal, A.; Hussein, A.-H. Effect of Single and Duplex Stage Heat Treatment on the
641
Microstructure and Mechanical Properties of Cast Ti–6Al–4V Alloy. Metallography, Microstructure, and
642
Analysis 2013, 2, 388–393.
643
21. Nader El-Bagoury*, K.M.I. Microstructure, Phase Transformations And Mechanical Properties Of
644
Solution Treated Bi-Modal Titanium Alloy. International Journal of Engineering Science and Research
645
Technology 2016.
646
22. Zhao, X.; Sun, S.; Wang, L.; Liu, Y.; He, J.; Tu, G. A New Low-Cost β-Type High-Strength Titanium
647
Alloy with Lower Alloying Percentage for Spring Applications. MATERIALS TRANSACTIONS 2014, 55,
648
1455–1459.
649
23. Phukaoluan, A.; Khantachawana, A.; Dechkunakorn, S.; Anuwongnukroh, N.; Santiwong, P.;
650
Kajornchaiyakul, J. Effect of Cu and Co Additions on Corrosion Behavior of NiTi Alloys for Orthodontic
651
Applications. Advanced Materials Research 2011, 378–379, 650–654.
652
24. Lee, C.S.; Won, J.W.; Lee, Y.; Yeom, J.-T.; Lee, G.Y. High Temperature Deformation Behavior and
653
Microstructure Evolution of Ti-4Al-4Fe-0.25Si Alloy. Korean Journal of Metals and Materials 2016, 54,
654
338–346.
655
25. ICDD: PDF 2, Database Sets 1-45; The International Centre for Diffraction Data, PA, USA 1995.
656
26. Lutterotti, L.; Scardi, P. Simultaneous structure and size–strain refinement by the Rietveld method.