Effect of gas expansion on the front shape of a Taylor bubble: an
experimental contribution
Laura Santos1, Teresa Esteves 2 and Nazaré Coelho Pinheiro 1,3 a 1
Departamento de Engenharia Química e Biológica, Instituto Superior de Engenharia do Instituto Politécnico de Coimbra, Rua Pedro Nunes, Quinta da Nora, 3030 – 199 Coimbra, Portugal
2
Departamento de Engenharia Química, Instituto Superior de Engenharia do Instituto Politécnico do Porto, Rua Dr. António Bernardino de Almeida, 4200 – 072 Porto, Portugal
3
Centro de Estudos de Fenómenos de Transporte, Faculdade de Engenharia da Universidade do Porto, Rua Dr. Roberto Frias, 4200 – 465 Porto, Portugal
Abstract. An experimental study where an individual Taylor bubble rises through water with different bubble volume expansion rates is presented with the (front) bubble shape determination as main objective. A combination of two techniques, Particle Image Velocimetry (PIV) and Pulsed Shadowgraphy (PS), was used to collect images for further treatment in order to characterize the liquid flow pattern in front of the bubble and the bubble shape. Processing the images acquired with pulsed illumination from behind the bubble it was possible to define with precision the bubble shape at different stages when it was expanding. The operation conditions used allowed a wide range of volume expansion rates (0 to 28.5 × 10⁻⁶ m3/s) with a significant effect on the Taylor bubble velocity; increases in bubble velocity up to 21% were observed relatively to constant volume system condition. Nevertheless, it seems that the front shape of Taylor bubbles does not change significantly with the upward liquid flow rates induced by gas expansion, at least for the volume expansion rates used in the experiments.
1 Introduction
Slug flow is widely encountered in many practical situations, ranging from industrial purposes to natural phenomena. The motion of the elongated bubbles (Taylor bubbles) rising through the flowing medium separated by liquid regions and the interaction between consecutive bubbles are main issues to be considered for a careful characterization of the flow. In situations of interest high liquid columns of liquid are involved and bubbles expand during the ascension path due to the hydrostatic pressure drop. The expansion of the Taylor bubbles volume corresponds to an additional contribution in the liquid velocity ahead and bubbles rising velocity is increased ([1, 2]).
When a bubble approaches a free liquid surface maintained at a reduced pressure high expansion rates are observed and the upward flow induced in the liquid increases proportionally. As a consequence the Taylor bubble velocity (U) will be greater than when it is rising through a quiescent liquid (U0) and according to Nicklin
et al. [3]
U U0CUL (1)
where UL is the mean liquid velocity and C is a velocity constant whose value depends on the flow regime in the liquid above the bubble. For laminar regime C = 2.0 and for turbulent regime C = 1.2.
In our own previous study ([1]) experiments were performed to monitor a single Taylor bubble rising through water contained in vertical columns with different internal diameters and different reduced pressures. The mean velocity in the liquid induced by gas expansion was calculated predicting the bubble volume increase rate using the ideal gas law. Some important conclusions were pointed out about the effect of gas expansion on bubble velocity which were corroborated later by an experimental work developed with the focus on the liquid velocity field in front of the bubble. The results obtained with a combination of two techniques, Particle Image Velocimetry (PIV) and Pulsed Shadowgraphy (PS), used to characterize the liquid flow pattern ahead the bubbles were submitted for publication ([4]) and the mean liquid velocity was determined by numeric integration of the liquid velocity profiles measured. In both experimental studies and for all gas a
Corresponding author: [email protected] C
expansion rates the Reynolds numbers (calculated with the mean liquid velocity), with values lower than 2100, suggested laminar regime for the liquid flow induced by bubble expansion. However, the values of C obtained from eq. (1) were not equal to 2.0 as expected but ranged between 1.13 and 1.40, depending on the column internal diameter. The continuous gas expansion with increasing rates did not allow to reach a fully-developed parabolic profile in the liquid in front of the Taylor bubbles.
It is known that the front shape of a Taylor bubble depends on the flow conditions at the liquid ahead of it. As indicated by Nogueira et al. [5] when the bubble rises through a co-current flowing liquid (in inertial controlled regime) the curvature radius at the nose is lower for higher bubble velocities. The authors justified this decrease in the curvature radius with the necessity to accommodate the higher liquid flow rates coming downwards (reference frame attached to the bubble).
Dumitrescu [6] was one of the first authors to study an individual Taylor bubble rising through a stagnant liquid in a vertical column. Applying the potential flow theory, Dumitrescu obtained the Taylor bubble shape for the air-water system, which agreed very well with the experimental observations. He divided the bubble shape profile in two regions, the nose region (z/D 0.25) and the film region (z/D > 0.25) and presented the following equations:
(2)
(3)
where r is the radial distance, z is the axial distance measured from the bubble nose and D is the column diameter.
The purpose of this work is to present and discuss the effect of the volume expansion rate due to the gas decompression during the bubble rise on the bubble shape and on the liquid flow ahead of it. The bubble contour at the upper region (the nose) was obtained at different levels during the rising path in the vertical column to which correspond different expansion rates.
2 Experimental set-up and techniques
2.1 Introduction to measurement techniques
To better understand the contribution of gas expansion on Taylor bubbles velocity during their rise an experimental study with individual bubbles ascending (in inertial controlled regime) through a vertical column filled with water was implemented. Different pressure conditions (atmospheric pressure and reduced pressures) above the free surface of the water were maintained in order to have bubble volume expansion rates with different magnitudes. A combination of PIV and PS techniques
was used to measure the liquid velocity profile around the bubble front and simultaneously to obtain a well defined contour of the Taylor bubble.
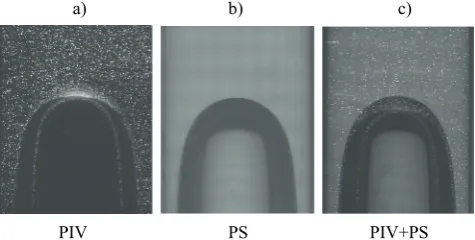
Using PIV alone the bubble contour in the images is not well defined due to intense scattered light emitted from the fluorescent particles and reflected on the gas/liquid surface (Figure 1a). The PS technique uses a (back) light positioned behind the visualization area and in front of the camera. With this technique it is possible to increase the contrast of the interface gas/liquid and make the contour of the Taylor bubble well defined (Figure 1b). From the images recorded using both techniques simultaneously (Figure 1c) it is possible to obtain the liquid flow field ahead the bubble and to have the interface gas/liquid clearly defined. The PIV+PS combined the laser beam with the back light, both pulsed and synchronized by a trigger with the camera. This camera records the images in the same frame, allowing simultaneous identification of the seeds particles and the bubble contour. The rigorous location of the tip of the Taylor bubble in the image is very important to measure the bubble velocity [4].
a) b) c)
25 0 0615 0 1 250 0 25 0 667 2 1 1 141 0 5 0 2 2 2 . . . . . . . ! » » » ¼ º « « « ¬ ª ¸¸ ¸ ¹ · ¨¨ ¨ © § ¸ ¹ · ¨ © § d °¿ ° ¾ ½ °¯ ° ® » ¼ º « ¬ ª ¸ ¹ · ¨ © § ¸ ¹ · ¨ © § D z D z D r D z D z D r
PIV PS PIV+PS
Figure 1. Image of a Taylor bubble rising through water
acquired with: a) PIV; b) PS and c) with both techniques (PIV+PS).
Processing the acquired images with the pulsed illumination from behind it was possible to define with precision the bubble shape at different stages when it was expanding. Applying the procedure for all pressure conditions used in the experiments the Taylor bubble contour was obtained for a wide range of volume expansion rates.
In order to obtain the bubble contour from the digital images a series of treatments with specific software was implemented, as will be described in 2.3.
2.2 Experimental set-up and procedure
techniques
The experiments have been performed in a vertical acrylic column with an internal diameter of 0.032 m and 4 m high. Distilled water at ambient temperature was used in the experiments performed with three different pressure conditions at the free liquid surface: atmospheric pressure, 33.3 kN/m2 and 20.0 kN/m2. For the conditions used in the experiments the inertial effects are dominant with > 300 and Eo > 70; and Eo are dimensionless numbers, respectively the inverse viscosity
f
number (Nf g12D32U P) and Eötvös number (Eo UgD2 V ), where g is the acceleration due to gravity, UP and V are the density, viscosity and surface tension of the liquid. The gas (air) was injected at the bottom of the column as described in [1]. The volume of the system for gas injection was chosen to originate bubbles long enough to have a stabilized liquid film flowing around the lateral bubble surface for all operating pressures.
An acrylic box (0.400 m × 0.130 m × 0.115 m) was positioned around the column at the measuring sections and filled with distilled water to reduce the refraction light effects at the curved column wall. Four measuring sections were chosen to determine the evolution of the bubble contour during the ascending path along the column. The distances between gas injection and measuring sections were 1.39 m (section 1), 1.86 m (section 2), 2.39 m (section 3) and 2.79 m (section 4). The experiments at atmospheric pressure were made with the column open and completely filled with water and also with a closed ball valve at the top in order to have a system with constant volume. The experiments with reduced pressure were carried out using two different heights of water in the column. This procedure allows to modify the bubble volume expansion rate at a given measuring section using the same pressure condition at the free surface of the liquid.
The PIV+PS experiments were repeated 15 times to have representative vector maps in the liquid. The PS experiments were repeated 3 to 5 times for each experimental condition which represents 2 × 3 to 2 × 5 images recorded for posterior treatment and determination of the bubble contour. The results and conclusions obtained from the measurements performed using both techniques in order to characterize the liquid flow pattern in front of the bubbles and simultaneously determine the bubble velocity were submitted for publication ([4]), as referred before. For that reason, only the conditions and procedures used with the PS technique to determine the bubble shape will be described here.
The PS technique used a camera and a LED’s (Light Emitting Diodes) array positioned in front of each other with the column in between. To have a diffuse illumination an opaque film was placed on the LED’s board surface. The bubble was illuminated from behind with a uniformly distributed pulsed high power LED’s at 630 nm with an illuminated area of 0.259 × 0.168 m2. A controller was used to provide timing and intensity to the LED’s array. A synchronizing device, a timer box 80N77 from Dantec, ensures that camera and LED’s board were synchronized correctly.
An external trigger was used to master the system and ensure that the camera records images with the nose and a great portion of the bubble front. A set of a laser diode and an optical sensor with a connection to the timer box constituted the external trigger. The set was placed in a support and attached to the column and when the bubble passes in front of the laser diode the light beam does not reach the optical sensor which interrupts a circuit of 5 V. This voltage drop (5 V to 0 V) was used to trigger a pulse
generator connected to the timer box, initiating all the devices that were ready for acquisition and starting the LED’s array flashing.
The images were acquired with a HiSense MK II CCD camera with a long pass filter mounted which has a blocking range limit of 570 nm. This filter is used to increase the quality of the PIV+PS images recorded. The HiSense MK II camera as 1344 × 1024 active pixels (4096 gray levels) and records the images with a double frame acquisition frequency of 6.1 Hz. The camera was fitted with an AF Micro-Nikon 60 mm f/2.8D lens.
2.3 Image processing
The digital images acquired were processed using the software Dynamics Studio v 2.30 from Dantec.
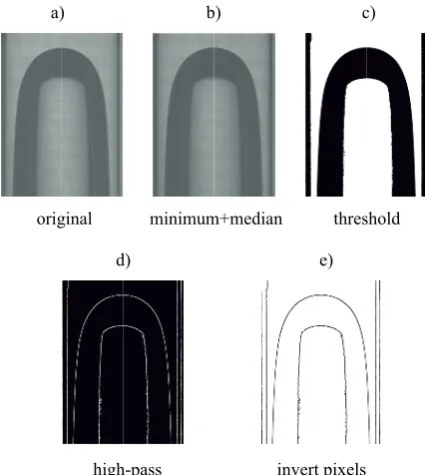
To obtain the contour of the bubbles each image recorded (one example is in Figure 2a) is processed using a sequence of treatments applying several filters. First, two low-pass filters (minimum and median filter) are applied to smooth the original images and enhance the contrast removing high frequency noises (Figure 2b). Secondly, a threshold was used to remove outliers setting the upper and lower limits of the accepted grayscale values in the image (Figure 2c). The grayscale values outside the specified limits were set to the maximum and minimum value supported by the 12-bit image (i.e, 0 or 4095). After that, a high-pass filter was applied for edge identification (Figure 2d) and finally the pixels were inverted to obtain a black contour of the bubble on a white background (Figure 2e).
a) b) c)
original minimum+median threshold
d) e)
high-pass invert pixels
Figure 2. Sequence of treatments applied to an original image
with the software Dynamics Studio v 2.30 in order to have the Taylor bubble contour. The original image (a) and the result after applying: (b) low-pass filters (minimum and median); (c) threshold; (d) high-pass filter and (e) after pixel inversion.
not part of the bubble contour are removed, like the wall of the column and some noise inside the bubble. Then, the images undergo a process of binarization (Figure 3a) to ensure that all is black and white, followed by skeletonization to remove pixels from the edges of objects until they are reduced to a single pixel wide shape (Figure 3b). Finally, the xy coordinates of the bubble contour are exported to an excel file for further representation. Figure 4 shows the superposition of Figure 2a and Figure 3b (with 100% of transparency) in order to illustrate that the contour extracted from the images represents the real shape of the Taylor bubble recorded at the original images.
a) b)
binarization skeletonization
Figure 3. Sequence of treatments applied to the image shown in
Figure 2e with the software ImageJ 1.46r in order to refine the Taylor bubble contour: (a) after cleaning the undesired elements
Figure 4. Superposition of the contour obtained (in white) with
and binarization; (b) after applying the tool skeletonize.
e original image.
were also treated using the MATLAB Image Processing Toolbox Functions for confirmation and
nd Discussion
s used in the a wide range of
expansion.
d the height of water in the column. Open symbols and full symbols represent different heights of water in the column.
th
Some images
no significant differences were observed in the final bubble contour obtained from both methodology. Care was taken to acquire some images without bubble in order to have a representative background to be subtracted from the images recorded for bubble contour determination. Removing the background from the images did not affect the determination of the Taylor bubble shape.
3
Results a
With the different operation condition experiments it was possible to have
bubble volume expansion rates at the measured sections distributed along the column. In fact, when a Taylor bubble rises through the water it is under a pressure field (P) due to the hydrostatic pressure variation according to P = Ps + Ug h, where Ps is the pressure at the free liquid surface and h is the liquid depth. At sufficiently reduced pressure conditions when the bubble approaches the free liquid surface the pressure decrease resulting from the weight contribution of the liquid column above the bubble (Ug h) becomes a great contribution to P. As a result, the gas pressure diminishes significantly and the bubble volume increase rapidly near the levels of the free surface of the water. Figure 5 shows the bubble volume expansion rates obtained from measuring section 1 through measuring section 4 for all the pressure conditions used. The null expansion rates indicated in the figure correspond to the experiments performed at atmospheric pressure with the column completely filled with water and closed at the top where changes of the system volume were not allowed. It is clear from Figure 5 the effect of modifying the local pressure (either by changing the operating pressure or the height of water in the column) on the bubble volume expansion rate, which is more pronounced at levels near the top of the column. The volume expansion rates presented in this figure were calculated considering behaviour of ideal gas for the Taylor bubble as described by Santos et al. ([1]). The Taylor bubble volume at a specified location was obtained by integration of the shape profile equations (eqs 2 and 3) presented by Dumitrescu. The upper limit used at the integration was the length of the Taylor bubble which was measured through the PIV+PS images. The depth of water above the bubble nose (h) used to calculate the real local pressure was corrected taking into account the change of level of the free liquid surface due to the volume of gas injected into the column and its
Figure 5. Range of bubble volume expansion rates obtained at
the measuring sections modifying the operation pressure conditions an
measuring section
1 2 3
ex
pans
ion r
at
e
u 10
6 (m 3 /s
)
4 0
5 10 15 20 25 30
Ps = 20.0 kN/m2
Ps = 33.3 kN/m2
Ps = 101.3 kN/m2
died authors and the results and conclusions were inc
exh bited by Taylor bubbles rising in downward liquid flo
ed were also compared with the the
a)
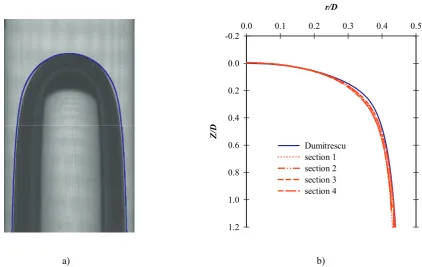
Figure 7. Taylor bubbles rising without gas expansion: a) image acquired with the Dumitrescus’ profile and b) bubble contours (right
side) obtained at the 4 measuring sections distributed along the column. During the bubble expansion the liquid in front of it is displaced inducing an upward flow in the water and according to Nicklin’s equation (eq. 1) the bubble velocity increases. This subject has already been stu by the
w that it has a significant effect on their velocity. However, when the bubble rises through an upward water flow Griffith and Wallis [7], Nicklin et al. [3], Bendiksen [10] referred that the instabilities are almost inexistent and the behaviour of the bubble is similar to that in a stagnant liquid. Nogueira et al. [5] reported the results obtained in experiments performed with water and also with aqueous glycerol solutions with viscosities ranging from 10-3 Pa s to 1.5 Pa s in stagnant conditions and co-current flow. From the results obtained comparing the shape of bubbles rising through two different aqueous glycerol solutions (in inertial flow regime) flowing upward (UL / U0 up to 0.46) the authors concluded that the curvature radius in the nose region is lower for the higher bubble velocities. They argued that this happens in order to accommodate the higher liquid flow rates coming downwards (reference frame attached to the bubble). The authors compared also the bubble shape obtained for stagnant conditions with the theoretical profile due to Dumitrescu (eqs 2 and 3). They concluded that as expected the agreement with the bubble shape obtained when it ascends through water is excellent and deviates progressively as the aqueous glycerol solution becomes more concentrated because the curvature radius at the bubble nose diminished due to the increase of the viscous effects.
In this study the bubble contours obtained from the images process
luded in the manuscript submitted for publication [4]. In Figure 6 is represented the increase in bubble velocity (U – U0) as a function of the bubble volume expansion rate. For the highest expansion rate the increase in the Taylor bubble velocity corresponds to 21% of U0. In opposition, for the lowest values observed at atmospheric pressure conditions the effect on the bubble velocity is negligible.
expansion rate u 106 (m3/s)
0 5 10 15 20 25 30
Figure 6. Increase of Taylor bubble velocity against the bubble
volume expansion rate. Open symbols and full symbols represent different heights of water in the column.
Some authors (for example, [7-9]) refer instabilities i
oretical predictions due to Dumitrescu. Figure 7 represents the results for a Taylor bubble rising through a constant volume system (without gas expansion). Figure 7a shows one image acquired with an overlay of the Dumitrescus’ profile and as can be seen a very good agreement was obtained. In Figure 7b is represented
b)
U - U0
(m/s)
-0.01 0.00 0.01 0.02 0.03 0.04
0.05 Ps= 20.0 kN/m2
Ps= 33.3 kN/m2 Ps= 101.3 kN/m2
r/D
0.0 0.1 0.2 0.3 0.4 0.5
Z/
D
-0.2
0.0
0.2
0.4
0.6
0.8
1.0
1.2
a)
Figure 8. Taylor bubbles rising with gas expansion: a) image acqu
obtained at the highest bubble volume expansion rates.
the right side of the bubble contours obtained at the 4
pected, e bubble contours extracted from Taylor bubbles at
to the Taylor bubble expansion corresponds to
UL / U0 = 0.16 for the highest bubble volume expansion rate (28.5 × 10⁻⁶ m3/s) used
f liquid and values of UL / U0 up to 0.46 were obtained. However, in the present study the upward water flow rate
echnique a considerable increase in bubble velocity is obtained when
igh. This is the consequence of the d by gas expansion.
b)
ired with Dumitrescus’ profile and b) bubble contours (right side)
measuring sections distributed along the column. Each in this study. Nogueira et al. bub le contour shown resulted from averaging all the
contours extracted from processing various images obtained at similar conditions (more than 6). As ex
[5] in the experiments used a peristaltic pump with variable speed to have different upward flow rates o b
th
different levels along their rising path are coincident and in good agreement with theoretical predictions because the bubbles rise steadily maintaining their volume. However, a slightly deviation from the Dumitrescus’ profile is noticed between z / D# 0.2 and z / D# 0.4.
Figure 8 represents results obtained from Taylor bubbles rising through water for reduced pressure conditions. When the Dumitrescus’ profile is superposed over an image acquired with a Taylor bubble expanding at a volume expansion rate of 28.5 × 10⁻⁶ m3/s (see Figure 8a) it seems that a not so good agreement is now obtained, with the bubble slightly more pointed near the nose region. In general, from all the conditions studied the curvature of the bubble nose seems to decrease for higher volume expansion rates although not significantly. For the sake of illustration, in Figure 8b the contours extracted from bubbles expanding at rates of 21.1 × 10⁻⁶ and 28.5 × 10⁻⁶ m3/s are represented; the contours shown are the result of averaging 6 or 8 contours extracted from images acquired at similar conditions. As can be seen from the figure the difference between both contours is very little and care must be taken to draw conclusions as this could be comparable to inaccuracies in the contour extraction from the images processed.
The experimental study presented does not allow to confirm with confidence the conclusions of Nogueira et al. [5] but it should be strengthened that the magnitude of the upward liquid flow in both studies is different. The upward flow resulting from the liquid displacement due
is only due to bubble expansion and to increase the ratio UL / U0 the reduced pressure at the free liquid surface must be lowered beyond 20.0 kN/m . In this case, care 2 must be taken because the gas volume expands so fast that instabilities at the bubble could happen.
4 Conclusions
The present study describes experiments performed with Taylor bubbles rising through water in a vertical column where the bubble expands at different rates due to gas decompression. Some experiments with the volume of the system constant were also made to have conditions with no gas expansion for comparison. Two techniques (PIV and PS) applied simultaneously allowed the characterization of the liquid flow ahead the bubble and also the bubble shape.
From the liquid flow pattern characterization above the bubble obtained with the PIV t
the bubble growth is h liquid flow rate induce
The methodology applied during the processing of the images acquired with the PS technique gave contours that represented accurately the bubbles shape. This is shown with the superposition of the contour extracted and the bubble at the original image (before processing).
Comparing the contour extracted from the images with the theoretical Taylor bubble profile proposed by
0.0 0.1 0.2
Z/
D
0.3 0.4 0.5
-0.2
0.0
0.2
0.4
0.6
0.8
1.0
1.2
28.5 u 10-6 m3/s
Dumitrescu a very good agreement was obtained for the conditions where the gas does not expand. When a red
e the bubble con
schrift fur Angewandte Mathematik und Mechanik 23, 10 (1943)
. Wallis, Two-phase slug flow. J. Heat 14 (1961)
)
uced pressure was used above the free liquid surface it seems that the curvature of the bubble nose decreases slightly for the highest bubble volume expansion rates. A rigorous error analysis associated to the methodology implemented in images processing to hav
tour must be done to confirm that this small change in the bubble shape results from the upward liquid flow induced by bubble expansion.
References
1. L. Santos, M.T. Sena Esteves, M.N. Coelho Pinheiro, Chem Eng Sci 63, 10 (2008)
2. R.G. Sousa, A.M.F.R. Pinto, J.B.L.M. Campos, Int. J. Multiphase Flow 32, 9 (2006)
3. D.J. Nicklin, J.O. Wilkes, J.F. Davidson, Trans Instn Chem Engrs 40, 8 (1962)
4. L. Santos, M.N. Coelho Pinheiro, Int. J. Multiphase Flow (submited)
5. S. Nogueira, M.L. Riethmuller, J.B.L.M. Campos, A.M.F.R Pinto, Chem Eng Sci 61, 13 (2006)
6. D.T. Dumitrescu, Zeit
7. P. Griffith, G Transfer 83,
8. S. Polonsky, D. Barnea, L. Shemer, Int. J. Multiphase Flow 25, 18 (1999
9. X. Lu and A. Prosperetti, J. Fluid Mech. 568, 11 (2006)