Article
A new fuzzy rule-based model to partition a complex
urban system in homogeneous urban contexts
Barbara Cardone1 and Ferdinando Di Martino1,2,*
1 Università degli Studi di Napoli Federico II, Dipartimento di Architettura, Via Toledo 402, 80134 Napoli, Italy, email [email protected], [email protected]
2 Università degli Studi di Napoli Federico II, Centro Interdipartimentale di Ricerca A. Calza Bini, via Toledo 402, Napoli, Italy
* Correspondence: [email protected]; Tel.: +39-081-552-2538904
Abstract: We present a new unsupervised method aimed to obtain a partition of a complex urban system in homogenous urban areas, called urban contexts. The area of study is initially partitioned in microzones, homogeneous portion of the urban system, that are the atomic reference elements for the census data. With the contribution of domain experts, we identify the physical, morphological, environmental and socio-economic indicators need to identify synthetic characteristics of urban contexts and create the fuzzy rule set necessary to determine the type of urban context. We implement the set of spatial analysis processes necessary to calculate the indicators for microzone and apply a Mamdani fuzzy rule system to classify the microzones. Finally, the partition of the area of study in urban contexts is obtained by dissolving continuous microzones belonging to the same type of urban context. Tests are performed on the Municipality of Pozzuoli (Naples - Italy); the reliability of out model is measured by comparing the results with the ones obtained by detailed analysis.
Keywords: urban system; urban context; microzone, fuzzy rule set; Mamdani fuzzy system; spatial database; GIS
1. Introduction
An urban system is a complex entity, composed of various elements with physical, morphological, environmental and socio-economic characteristics, related to each other. Often, in order to analyze the area of study related to urban analysis problems, is useful partition it in a set of areas homogeneous with respect to specific characteristics. In literature there are various studies in which unsupervised methods are proposed to segment the area of study in homogeneous zones in order to analyze specific problems. Various authors propose automatic classification methods to partition urban areas and elements from raster remote sensing data. In [19] a genetic algorithm is applied in order to extract automatically classification rules of urban areas from remote sensing data. In [9] a is applied a framework modeling the expert knowledge in order to segment coastal areas in raster remote sensing data. In [12] a new method based on unsupervised change detection focused on individual buildings is applied to very-high resolution remote sensing imageres to extract elements in urban systems. In [4] a hierarchical object-oriented model is proposed to classify objects in an urban area from high resolution satellite images. In [8] a multiple-kernel learning model is proposed to classify urban areas from spectral and LiDAR raster data. A review of classification methods proposed to classify urban land cover by using raster LiDAR remote sensing images is presented in [19].
Recently, the aviability of various thematic data at different scales from different institutional sources together with the use of socio-demographic census data, allows to implement methods for the unsupervised classification of urban systems that take into consideration the knowledge of the urban system and the expert knowledge of the analyzed problem. In [5] the area of study is partitioned in homogeneous zones based to morphological and soil characteristics in order to analyze
the vulnerability of aquifer to pollution; a fuzzy algebraic structure is applied in order to assess the aquifer vulnerability in any zone. In [15] a multiple level association rule mining method is applied on spatiotemporal socio-economic and land cover datasets based on a hierarchical classification scheme to extract relations between objects in the area of study and classify them.
In [3] a simulated annealing method is applied to partition an area of study in homogeneous zones based on socioeconomic characteristics. In [6] a partition of the urban system in census zones is performed in order to study the spatial distribution of socioeconomic characteristics. In [1] a multi-objective approach is applied in order to partition into microregions the municipalities of the region of Parana in Brazil; this approach maximize the population homogeneity and the medical procedure used in any microregion and minimize inter-microregion traveling.
In this research we propose a novel model based on a Mamdani fuzzy rule system [13,14] aimed to partition an urban system in homogeneous zones, called urban contexts; each urban context is labeled with a specific urban class based on a specific taxonomy related to the studied problem.
Our approach is independent of the analyzed problem; initially we partition the area of study in homogeneous zones given by census atomic elements called microzones. We follow the Italian Presidential Decree n. 138 of 1998 that in the Article 1 defines a microzone as a homogeneous portion of the urban system, which may include one municipality, a portion thereof, or groups of municipalities, characterized by similar environmental and socio-economic characteristics. The microzone represents a portion of the municipality or, in the case of areas consisting of groups of municipalities, an entire municipal territory homogeneous in terms of urban, historical-environmental and socio-economic characteristics, as well as in the provision of urban services and infrastructure. For example, in each microzone buildings are predominantly uniform for construction features, construction period and residential/industrial/commercial use.
The first step of our method concerns the acquisition of different not normalized thematic data from various institutional sources, including of the last microzone census database.
Subsequently, a homogeneous knowledge base of the analyzed urban system is created, in order to extract a set of synthetic indicators representing characteristics of the urban system related to the analyzed problem. These indicators express the input variables of a fuzzy rule set extracted by domain experts in which the output variable expresses an urban class.
A Mamdani fuzzy rule system is applied to classify the microzones assigning them a specific class; finally, a dissolve spatial operator is used to aggregate microzones spatially contiguous classified in the same urban class in urban contexts; in addition, we assess a membership degree of each urban context to its class, given by a weighted average of the membership degrees to this category calculated in any microzone include in the urban context. This membership degree represents the uncertainty in the attribution of the urban context to its urban class and provides an evaluation of the reliability of the classification.
The main advantages of the proposed model are the independence of it from the analyzed problem and its usability. In fact, our framework can be applied to any type of problems involved analysis of urban systems and streamlines and make more efficient the construction of the knowledge transferred by the domain experts. Finally, the assessment of the membership degree of the urban contexts to their urban classes allows the analyst to evaluate the reliability of the resultant partition. In next section is described in detail the proposed model; in order to show the ways in which the components of our model are applied, a case study concerned with partitioning an urban system in contexts in which urban classes are typified by different residential density is explored.
In section 3 are described the area of study and the institutional datasets used in our experiments; in section 4 are shown the results of our experiments. Final considerations are reported in section 5.
2. The proposed model
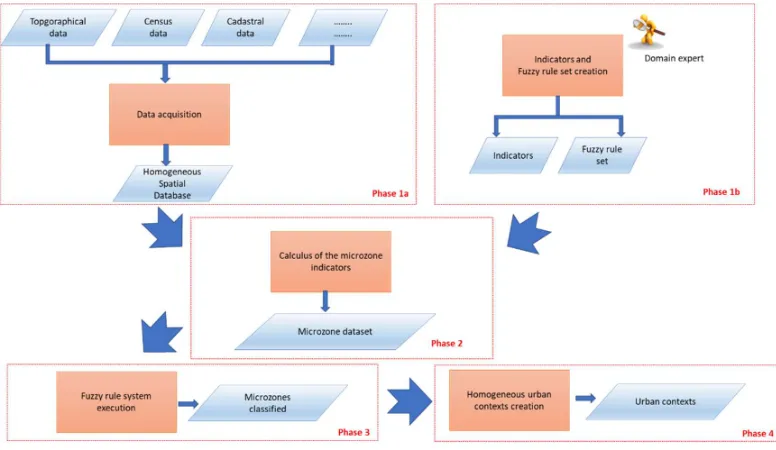
Figure 1. Scheme of the phases of the model.
The phases 1a and 1b are executable in parallel.
The phase 1a (Data acquisition) concerns with the acquisition of the datasets from Institutional sources. A set of staging procedures are necessary to provide the reconciliation of these inhomogeneous data (for example, to carry out the transformation and conversions of spatial data in a unique coordinate system and to correct spatial topological errors) and the creations of relations between the various datasets. Output of this phase is given by the homogeneous spatial database of the area od study.
In the phase 1b (Indicators and fuzzy rule set creation) are defined the various physical, environmental and socio-economic indicators and is created the fuzzy rule set; this phase is executed with the contribution of domain experts. To model the expert knowledge and construct the fuzzy rules, we create a fuzzy partition of the domain of each indicator in which any fuzzy set is assigned by using a triangular or semi-trapezoidal fuzzy number and is titled with a linguistic label assigned by the domain expert.
In the phase 2 (Calculus of the microzone indicators) are implemented the spatial analysis processes need to calculate the indicators. Each indicator represents a summarize of specific characteristics of the microzone; it is calculated by applying the formulas created in the phase 1b and by using a set of geoprocessing and statistical operators applied on entities and characteristics in the spatial database.
In the phase 3 (Fuzzy rule system execution) for each microzone is executed the Mamdani fuzzy rule system in order to assign the microzone to a specific urban class. The indicators are fuzzified by a fuzzification component; then the fuzzy inference component is applied by using the Mamdani min and max operators; the urban class assigned to the microzone is given by the consequent of the fuzzy rule with greatest strength.
In the phase 4 (Homogeneous urban contexts creation) the adjoining microzones belonging to the same urban class are dissolved and is created the thematic map of the urban contexts of the area of study.
2.1. Phase 1.a - Data acquisition
indicators, related to different information layers as population, buildings, roads, urban green, schools, infrastructures.
A set of geo-processing activities are necessary in order to normalize the spatial datasets; all datasets must be converted in a unique coordinate system and a topological check it needs to verify the integrity of the dataset. Other geoprocessing activities could be carried out to extract and normalize the thematic data, as, for examples:
- extracting themes from a dataset in various format;
- merge of datasets correspondent to a theme and distributed per tiles and clipping it on the area of study;
- apply spatial operators to relate to any feature of the theme information inserted as annotation texts (for example the road name to assign to any polyline of a road network). A data cleaning activity on the data fields it needs in order to verify their integrity and accuracy, to delete outliers and correct inconsistent data and redundancies.
Finally, all themes and tables are imported in a spatial database and the relation between them are created.
2.2. Phase 1b. – Indicators and fuzzy rule set creation
The indicators need to classify the microzones are evaluated by domain experts. In our experimentation the experts consider 14 indicators related to various thematic layers that characterize the area of study and are necessary to evaluate to which urban class the microzone belongs. In Tab. 1 are described all the indicators; to each indicator is assigned an identify and are reported the type of indicator, i.e. the thematic layer to whom it is referred, a brief description and its unit of measure.
Table 1. Indicators used to classify the microzones of the area of study
Indicator Type Description Unit of measure
I1 buildings Mean square meters of residential buildings
for resident Square meters
I2 buildings Percent of industrial areas with respect to
total built areas Percent
I3 urban green Mean square meters of green areas for resident
Square meters
I4 urban green Percent of green areas with respect to area
of the microzone Percent
I5 roads Percent of the overall length of district urban roads1 with respect to the overall length of roads in the microzone
Percent
I6 roads Percent of overall length of the district urban roads with width less than 7 m. with respect to the overall length of all district urban roads in the microzone
Percent
I7 population Number of residents per square kilometer (Square kilometers)-1 I8 buildings Percent of the number of residential
buildings built before 1945 with respect to all residential buildings
Percent
I9 buildings Mean number of dwellings with at least one resident in the residential buildings
I10 buildings Percent of residential buildings with at least 16 dwellings with respect to all residential buildings
Percent
I11 schools Accessibility and proximity of schools in the
microzone Percent
I12 public
transportation Usability of public transport networks Percent
I13 coastal/marine
zone Coastal/marine area Percent
I14 large public infrastructure
Presence of large public infrastructures Percent
After defining the indicators, the domain experts create a fuzzy partition of any indicator by using triangular and semi-trapezoidal fuzzy numbers to create the fuzzy sets. The fuzzy partitions of the indicators in Tab.1 are shown in Tab.2. in which are reported the identifier of the indicator, a label assigned to any fuzzy sets, the inf, mean and sup values of the fuzzy number and the type of fuzzy set (ST = Semi-Trapezoidal, TR = Triangular).
Table 2. Fuzzy partitions of the indicators
Indicator Label inf mean sup Type of fuzzy set
I1
Scanty 0 10 30 ST
Mean 20 30 50 TR
Discrete 40 60 80 TR
High 70 100 ∞ ST
I2
Null 0 10 20 ST
Mean 10 30 50 TR
Discrete 40 50 70 TR
High 60 70 100 ST
I3
Scanty 0 10 40 ST
Mean 30 50 70 TR
Discrete 60 80 90 TR
High 90 200 ∞ ST
I4
Null 0 10 30 ST
Mean 10 30 50 TR
Discrete 30 50 70 TR
High 50 70 100 ST
I5
Null 0 20 30 ST
Mean 15 40 50 TR
Discrete 40 50 70 TR
High 60 70 100 ST
I6
Null 0 10 20 ST
Mean 10 30 50 TR
Discrete 40 50 70 TR
High 60 70 100 ST
I7
Scanty 0 100 1000 ST
Mean 100 1000 5000 TR
Discrete 1000 5000 10000 TR
High 5000 10000 ∞ ST
I8 Null 0 10 20 ST
Discrete 40 50 70 TR
High 60 80 100 ST
I9
Scanty 0 5 10 ST
Mean 5 20 30 TR
Discrete 30 40 60 TR
High 40 60 ∞ ST
I10
Null 0 10 20 ST
Mean 10 30 50 TR
Discrete 40 60 80 TR
High 60 80 100 ST
I11
Null 0 10 20 ST
Mean 10 30 50 TR
Discrete 50 70 90 TR
High 70 90 100 ST
I12
Null 0 10 20 ST
Mean 10 30 50 TR
Discrete 40 50 70 TR
High 60 70 100 ST
I13
Null 0 10 30 ST
Mean 30 50 70 TR
High 60 90 100 ST
I14
Null 0 10 20 ST
Mean 10 50 70 TR
Discrete 50 80 90 TR
High 60 90 100 ST
In order to extract the fuzzy rules, the experts define the taxonomy of the urban area classes. In our experimentation are considered the following set of urban area classes in which any class characterize a type of residential or rural zone of the urban system.
Table 3. Urban area classes
Urban area class Description
Residential old town Residential agglomeration of ancient or recent formation characterized by historical, artistic and environmental goods even if tampered with or degraded or not present at the same time
Comfortable residential zone
Dwelling place equipped with comfortable and modern/contemporary dwellings, infrastructures, sports facilities and green spaces
Downtrodden residential
zone Dwelling place equipped with uncomfortable dwellings and poor of infrastructures, sports facilities and green spaces Industrial zone Zone with prevalent or mixed industrial areas
Coastal residential zone Area inclusive of a border with sea or great lakes with mainly maritime services Fragmented
Rural/wooded zone Area mainly rural or wooded with reduced settlement development Sprawl Informal modern/contemporary urban settlement
Each class in Tab. 3 is correspondent to a fuzzy set of an output linguistic variable Z defined in the domain [0,1] and representing, following an increasing order from 0 to 1, the impact of residential settlements to the area. The first fuzzy set is a semi-trapezoidal fuzzy set representing a predominantly rural or wooded area; the last fuzzy set is a semi-trapezoidal fuzzy set representing a compact residential old town. The intermediate fuzzy sets are triangular. These fuzzy sets are defined in tab 4 and are graphically shown in fig. 2.
Table 4. Fuzzy partitions of the urban area classes
Fragmented rural/wooded zone 0 0.2 0.3 ST
Industrial zone 0.2 0.3 0.4 TR
Sprawl 0.3 0.4 0.5 TR
Coastal residential zone 0.4 0.5 0.6 TR
Comfortable residential zone 0.5 0.6 0.7 TR
Downtrodden residential zone 0.6 0.7 0.8 TR
Residential old town 0.7 0.8 1 ST
Figure 2. Plotting of the output variable fuzzy sets.
Based on their knowledges, the experts extract the set of fuzzy rules need to evaluate the urban class to whom belongs any microzone. In our experimentation the 14 indicators are used as input variables in the antecedent of each rule and the output variable Z is used in the consequent, labeled as in tab. 3. The fuzzy rule set is composed by fuzzy rules extracted by the experts written in the form: Rk: IF (I1 = I1k) Δ1 (I2 = I2k) Δ2 … Δn (In = Ink) THEN (Z = Zk) (1)
where I1, I2, In, are input variables given by the linguistic labels of the fuzzy sets of the
indicators and Z is the output variable. The operator Δi (i=1,…,n) is given by an AND or an OR
connectives. We construct the fuzzy rule set considering only AND connectives, splitting rules in which there are OR connectives in the antecedent. To show the splitting process of the rules, we take into consideration the following subset of fuzzy rules created by the experts.
IF (I4 == Null) AND (I6 == Discrete OR I6 == High) AND (I7 == High) THEN Z == Residential old town IF (I1 == Discrete OR I1 == High) AND (I3 == Discrete OR I3 == High) AND (I8 == Null) AND (I12 == High) THEN
Z == Comfortable residential zone
IF (I2 == Null) AND (I7 == Scanty OR I7 == Mean) AND (I12 == High) AND (I14 == Discrete OR I14 == High) THEN Z == Comfortable residential zone
IF (I2 == Discrete OR I2 == High) AND (I6 == Null) AND (I7 == Scanty) THEN Z == Industrial zone
After the rule splitting process we obtain the following final fuzzy rules:
R1: IF (I4 == Null) AND (I6 == Discrete OR I6 == High) AND (I7 == High) THEN Z == Residential old town R2: IF (I4 == Null) AND (I6 == High) AND (I7 == High) THEN Z == Residential old town
R4: IF (I1 == High) AND (I3 == Discrete) AND (I8 == Null) AND (I12 == High) THEN Z == Comfortable residential zone
R5: IF (I1 == Discrete) AND (I3 == High) AND (I8 == Null) AND (I12 == High) THEN Z == Comfortable residential zone
R6: IF (I1 == High) AND (I3 == High) AND (I8 == Null) AND (I12 == High) THEN Z == Comfortable residential zone
R7: IF (I2 == Null) AND (I7 == Scanty) AND (I12 == High) AND (I14 == Discrete) THEN Z == Comfortable residential zone
R8: IF (I2 == Null) AND (I7 == Mean) AND (I12 == High) AND (I14 == Discrete) THEN Z == Comfortable residential zone
R9: IF (I2 == Null) AND (I7 == Scanty) AND (I12 == High) AND (I14 == High) THEN Z == Comfortable residential zone
R10: IF (I2 == Null) AND (I7 == Mean) AND (I12 == High) AND (I14 == High) THEN Z == Comfortable residential zone
R11: IF (I2 == Discrete) AND (I6 == Null) AND (I7 == Scanty) THEN Z == Industrial zone R12: IF (I2 == High) AND (I6 == Null) AND (I7 == Scanty) THEN Z == Industrial zone
2.3. Phase 2. – Calculus of the microzone indicators
To calculate the indicators in any microzone are applied specific spatial analysis functions. For example, the indicator I1 in Tab. 1 is calculated by selecting the residential buildings in the area of
study and extracting the total surface area covered by residential buildings and the number of residents per microzone. Finally, for any microzone the ratio between this total surface area and the number of residents is calculated.
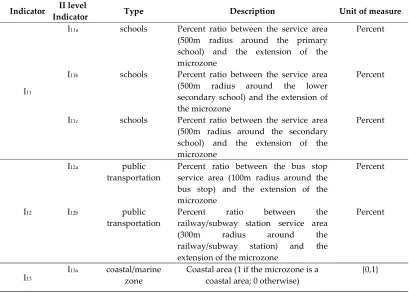
A hierarchy of spatial analysis processes could be need in order to calculate the value of an indicator. In our experiment, to calculate the indicators I11, I12, I13 and I14 is necessary to calculate
further parameters, labeled II level indicators, described in the following table.
Table 5. II level Indicators used to classify the microzones of the area of study
Indicator Indicator II level Type Description Unit of measure
I11
I11a schools Percent ratio between the service area (500m radius around the primary school) and the extension of the microzone
Percent
I11b schools Percent ratio between the service area (500m radius around the lower secondary school) and the extension of the microzone
Percent
I11c schools Percent ratio between the service area (500m radius around the secondary school) and the extension of the microzone
Percent
I12
I12a public
transportation Percent ratio between the bus stop service area (100m radius around the bus stop) and the extension of the microzone
Percent
I12b public transportation
Percent ratio between the railway/subway station service area (300m radius around the railway/subway station) and the extension of the microzone
Percent
I13 I
13a coastal/marine
I13b coastal/marine
zone Maritime terminal (1 if it is present in the microzone; 0 otherwise) {0,1}
I14
I14a large public
infrastructures (1 if large sports facilities are present in Presence of public large sport facilities the microzone; 0 otherwise)
{0,1}
I14b large public
infrastructures hospitals are present in the microzone; Presence of public hospitals (1 if it 0 otherwise)
{0,1}
The indicator I11 is obtained as a weighted mean of the indicators I11a, I11b and I11b where the
weights, are, respectively, the residents with age between 5 and 9 years, the residents with age between 10 and 14 years and the residents with age between 15 and 19 years.
Formally, let n5-9 be the number of residents in the microzone with age in the range 5-9 years, n 10-14 the number of residents in the microzone with age in the range 10-14 years and n15-19 the number of
residents in the microzone with age in the range 15-19 years. The indicator I11 is given by the formula:
11 5 9 11 10 14 11 15 19
11
5 9 10 14 15 19
a b c
I n I n I n
I
n n n
(2)
The indicator I12 is obtained as a weighted mean of the indicators I12a and I12b.
12 12 12 12
12
12 12
a a b b
a b
I w I w
I
w w
(3)
where w12a and w12b are the weights assigned, respectively to the indicators I11a and I11b. The
experts set w12a = 3 and w12b = 7 considering the influence of railway/subway station servicesto be
greater than the bus services one. The indicator I13 is calculated as:
13a
13 13a 13b
13a 13b
0% IF I = 0
50% IF I = 1 AND I = 0 100% IF I = 1 AND I = 1 I (4)
The indicator I14 is calculated as:
14a 14b
14a 14b
14
14a 14b
14a 14b
0% IF I = 0 AND I = 0 50% IF I = 1 AND I = 0 80% IF I = 0 AND I = 1 100% IF I = 1 AND I = 1 I (5)
2.4. Phase 3. – Fuzzy rule system execution
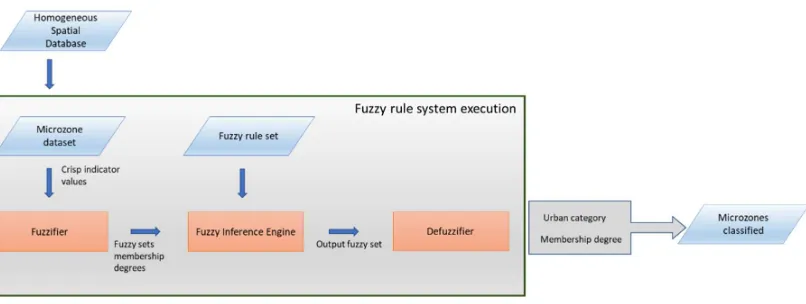
Figure 3. Scheme of the fuzzy rule based system
From the spatial database constructed in the previous phase is extracted the microzone dataset containing the crisp values of the indicators calculated for any microzone. The Fuzzifier component imports these indicator values and assign to any indicator the membership degrees to its fuzzy sets. Then, the Fuzzy Inference Engine component reads the membership degree of the fuzzy sets related to any indicator and performs the inference process calculating the strength of any fuzzy rule in the fuzzy rule set.
The min operator is applied to the AND connectives in the antecedent of the fuzzy rule to calculate its strength. The Fuzzy Inference Engine realizes the aggregation process to construct the output final fuzzy set. Aggregation is the process by which the truncated output fuzzy sets in each rule are combined into a single fuzzy set that represents the output aggregated fuzzy set.
In order to show the aggregation process, we consider a system formed by two fuzzy rules in the form:
1 1 1 2 1 1
2 1 2 2 2 2
: IF is A AND is B is C : IF is A AND is B is C
R I I THEN Z
R I I THEN Z
(6)
where A1 and A2 are two fuzzy sets of the linguistic input variable I1, B1 and B2 are two fuzzy
sets of the input linguistic variable I2 and C1 and C2 are two Fuzzy sets of the output variable Z.
Now suppose that, after the fuzzification process, we obtain the following membership degree for the input variables: A1 = 0.3, B1 = 0.5, A2 = 0.7, B1 = 0.8.
The strength of the two rules are given by:
S(R1) = min(0.3, 0.5) = 0.3 S(R2) = min(0.7, 0.8) = 0.7.
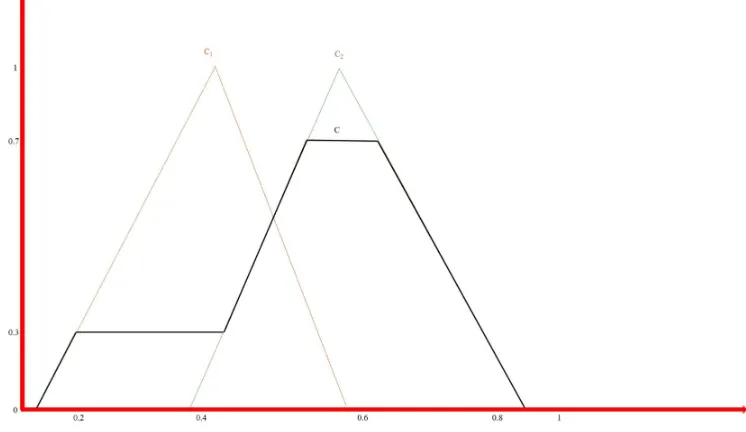
In the aggregation process we construct the output fuzzy set given by:
1 1 2 2
C( ) max minZ C Z( ),S R ,minC( ),Z S R (7)
Figure 4. Example of construction of the output fuzzy set in the aggregation process
The defuzzification process of the output fuzzy set is carried out via the discrete Center of Gravity (CoG) method by the formula:
1
0 1
0 ( ) ˆ
( ) Z C Z dZ Z
C Z dZ
(7)where the two integrals are extended in the range [0,1] which is the domain of the output variable Z.
We classify the microzone assigning it to urban class label of the output variable fuzzy set with greater membership degree in the point
Z
ˆ
; the membership degree of the microzone to this class is given by the membership degree of the output variable to C in the pointZ
ˆ
.In Fig. 5 is show the result of the defuzzification process. As
C Z
1
ˆ
is greater theC Z
2
ˆ
, weFigure 5. Results of the defuzzification process
2.5. Phase 4. – Homogeneous urban contexts creation
In this phase the area of study is partitioned in urban contexts. Each urban context is obtained dissolving adjoining microzones belonging to the same urban class; then, is realized the thematic map of the urban contexts of the area of study.
A weighted mean of the membership degree of the microzones forming an urban context is calculated, to extract the reliability of the urban context; the weight is given by the area of the microzone as the greater the surface of a micro-zone included in a context greater is its impact on the reliability of the classification of the context.
3. Application on an area of study
We test our model applying it on an urban system in order to partition the area of study in urban contexts by considering the taxonomy of the urban area classes in Tab. 3.
3.1. The area of study
The area of study is given by the Municipality of Pozzuoli (Naples - Italy). The municipality of Pozzuoli shows a multiplicity of urban area classes; it contains industrial areas, modern residential zones, a dense hold town and high uncultivated/wooded green areas. In [7] historical land use, photogrammetric and airborne LiDAR data are used to detect buried landfill sites in the area of Campi Flegrei, that contains the municipality of Pozzuoli; this study shows that in this area are present modifications of the landscape associated with the urban development and quarrying activity. The presence of volcanic hills within the municipal area has allowed an urban development mainly below them and towards the coastal areas. A survey on the seismic activities produced by the Campi Flegrei caldera in densely inhabited areas and the consequent risk for the population was carried out in [11] and recently in [17]. A study of all the different cultural resources presents in the Municipality of Pozzuoli performed by using GIS technologies is presented in [10].
It is interesting to study how are distributed the various contexts in the municipality in relation to its different natural, social and urban characteristics. We apply our model to obtain a partition of the municipality in these different contexts.
Figure 6. The microzones of the municipality of Pozzuoli.
3.2. Spatial data sources
The microzone dataset collected for the study were provided by the ISTAT Italian National Statistical Institute, the Italian public research body that deals with censuses and surveys their social and economic characteristics.
The geo-topographic dataset used to extract the base theme of the municipality is the topographical database provided by the Campania Region in 1: 5000 scale, from which it was possible to extract information on buildings and their intended use, presence of urban green, presence of infrastructure such as hospitals, schools. The area under study is a municipality bordering the sea, it was necessary, to make some indicators of our set, to identify the coastal microzones.
The datasets necessary to calculate the 14 indicators are extracted from four institutional data source: the regional geo-topographic database in scale 1:5000, the census database provided with the last Italian census data per microzone, the aero-photogrammetric spatial database provided by the Municipality of Pozzuoli and the free spatial database provided by the Open StreetMap community.
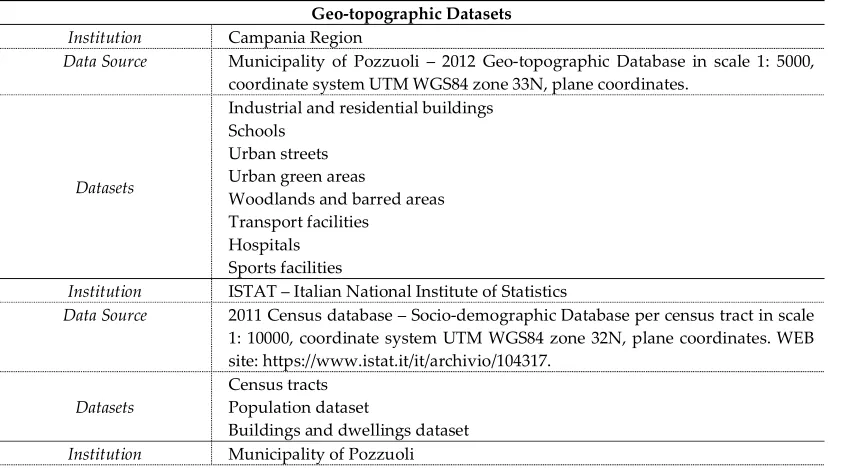
The datasets are extracted limited to the extension of the municipality of Pozzuoli. In the following table are described all the data sources used in our tests.
Table 6. Data sources and dataset used in the tests
Geo-topographic Datasets Institution Campania Region
Data Source Municipality of Pozzuoli – 2012 Geo-topographic Database in scale 1: 5000, coordinate system UTM WGS84 zone 33N, plane coordinates.
Datasets
Industrial and residential buildings Schools
Urban streets Urban green areas
Woodlands and barred areas Transport facilities
Hospitals Sports facilities
Institution ISTAT – Italian National Institute of Statistics
Data Source 2011 Census database – Socio-demographic Database per census tract in scale 1: 10000, coordinate system UTM WGS84 zone 32N, plane coordinates. WEB site: https://www.istat.it/it/archivio/104317.
Datasets Census tracts Population dataset
Data Source Municipality spatial database, coordinate system UTM WGS84 zone 33N, scale 1: 4000, coordinate system UTM WGS84 zone 33N, plane coordinates. Datasets Municipality Ortho images Road networkRailway network
Institution Open StreetMap (OSM) community
Data Source Open StreetMap spatial database, coordinate system UTM WGS84 zone 32N, coordinate system UTM WGS84 zone 33N, plane coordinates. Web site: http://download.geofabrik.de/osm-data
Datasets
Road network Schools
Transport facilities Bus and railway stops
The polygonal census tracts dataset provided from the ISTAT institute was used as base dataset to calculate the indicators; the census tracts corresponds to the microzones used in our model. The municipality of Pozzuoli is partitioned in 283 microzones. For each microzone we extract the population dataset, composed of data concerning with various sections of residents as the number of residents in a specific age range, and the building dataset composed of data related to the number of buildings and dwellings with specific characteristics, as the number of buildings built in a period, the mean number of housings in any residential buildings, etc.
The polygonal buildings theme was acquired from the 2011 geo-topographic database in scale 1:5000, distributed by the Campania Region in an Italian National geo-topographic structure following the InSpire GeoUML data model [2, 16].
Other dataset concerning streets, infrastructures and schools, where extracted from the aero-photogrammetric municipality data in scale 1:4000 provided from the municipality of Pozzuoli and from the Open StreetMap community spatial database.
All the datasets were converted in the plane coordinate system UTM WGS84 zone 33N. The same data layers providing from different data source were normalized and integrated.
4. Test results
We test our framework on a Pentium I7 dual core platform by using the tool GIS ESRI ArcGIS 10.5; all the spatial analysis processes are implemented as functions in the tool GIS; the fuzzy inference system is implemented in C++ language and incapsulated in the tool GIS.
In order to calculate the indicators needed to test our model a set of spatial operators as spatial intersects and spatial joins were used to summarize per census tract data assigned to features belonging to the various spatial datasets. Next are synthetized the processes applied to extract the indicators.
To calculate the indicators I1 and I2 the polygonal buildings dataset was partitioned in residential
and industrial buildings in order to extract, respectively the area covered by residential and industrial building per microzone.
The indicator I3, given by the mean square meters of green areas for resident, is calculated by
selecting the urban green areas and calculating the sum of urban green areas covering any microzone. Finally, this area is divided by the number of residents in the microzone.
The indicator I4 is calculated by dividing the sum of green areas in the microzone by the area of
the microzone.
To calculate the indicators I5 the district urban roads are selected from the road network layer
and the sum of the lengths of the selected arcs falling in every microzone is calculated; finally, this value is divided by the sum of the length of all the road arcs falling in the microzone. The indicator I6 is calculated by selecting the district urban roads with a width less than 7 m and dividing the sum
of the selected arcs fallings in any microzone by the sum of the district urban road arcs falling in the microzone.
The indicator I7 is calculated by dividing the number of residents in any microzone by the area
To calculate the indicators I8, I9 and I10 the Buildings and dwellings census dataset is used,
extracting for any microzone, respectively, the number of residential buildings built before 1945, the number of dwellings with at least one resident and the number of residential buildings with at least 16 dwellings, and dividing them, respectively by the number of residential buildings, the number of dwellings and the number of residential buildings in the microzone.
The II level indicators I11a, I11b and I11c are calculated extracting from the point school layer,
respectively, the primary, low secondary and secondary schools and constructing circular buffer areas with a radius of 500 meters centered in any school. Then, for any type of school, the area of the microzone covered by the calculated buffer areas is extracted and divided by the area of the microzone.
The II level indicators I12a and I12b are calculated extracting from the point Transport facilitiy
layers, respectively, the bus stops and the railway’s stops and constructing circular buffer areas with a radius of, respectively, 100 and 300 centered in any stop. Then, for any type of stop, the area of the microzone covered by the calculated buffer areas is extracted and divided by the area of the microzone.
The II level indicators I13a and I13b are calculated selecting, respectively, microzones including
coastal areas, and containing a maritime terminal.
The II level indicators I14a and I14b are calculated extracting respectively, the polygon Hospitals
and Sports facilities layers and selecting the microzones including the selected elements.
For brevity we show the thematic maps obtained for the indicators I2 (Fig. 7) and I4 (Fig. 8) in
which an equal interval classification method of the indicator is applied.
Figure 8. Thematic map of the indicator I4 – Percent of green areas with respect to area of the microzone
After calculating the crisp values of any indicators, we apply the fuzzification process executing the fuzzifier component of the fuzzy rule system.
In Fig. 9 and 10 are shown two thematic maps of, respectively, the indicators I2 and I4in which
to any microzone is assigned the label of the fuzzy set to whom the microzone belongs with the highest membership degree.
Figure 10.Thematic map of the indicator I4 in which any microzone is classified assigning it the label of the fuzzy sets to whom it belongs with highest membership degree
The two maps in Figs. 9 and 10 are obtained after the fuzzification process and highlight the microzones characterized by the indicator. In fig. 9 the microzone classified as High (in red) are characterized by a strong presence of industrial areas. In fig. 10 the microzone classified as High (in dark green) are largely covered by urban or overgrown green.
After the fuzzification process the fuzzy inference engine component is started; a set of about 100 fuzzy rules created by the domain experts is used. Finally, the defuzzification process is executed and the appropriated urban area class is assigned to any microzone.
The thematic map in fig. 11 show the classification results. In this map the urban area classification of the microzone is shown.
Figure 11.Thematic map of the microzones classified by urban area.
calculate the accuracy, precision and recall (or sensitivity) indexes. This calculus is performed by extracting from the confusion matrix the TP, TN, FP and FN parameters, where:
TP (True Positive) is the number of microzones correctly assigned to the class; TN (True Negative) is the number of microzones correctly not assigned to the class; FP (False Positive) is the number of microzones wrongly assigned to the class; FN (False Negative) is the number of microzones wrongly not assigned to the class.
The three indexes are given by:
TP+TN
accuracy= ×100 TP+TN+FP+FN
TP precision= ×100
TP+FP TP recall= ×100
TP+FN
(6)
Table 7 show the classification results; the three indexes are calculated for any class.
Table 7. Classification results obtained comparing the urban area classifications of the microzone obtained by applying or method with the supervised classification performed by the experts.
Urban area class Accuracy Precision Recall
Fragmented rural/wooded zone 99.29% 100.00% 88.89%
Industrial zone 100.00% 100.00% 100.00%
Sprawl 100.00% 84.62% 100.00%
Coastal residential zone 100.00% 100.00% 100.00%
Comfortable residential zone 100.00% 100.00% 100.00%
Downtrodden residential zone 100.00% 100.00% 100.00%
Residential old town 100.00% 100.00% 100.00%
These results show that the classification of the microzones obtained by applying our model is almost similar to that supervised one attributed by the experts. The only deviations are present in the class Fragmented rural/wooded zone and Sprawl; two of the 18 microzones classified by the experts as Fragmented rural/wooded zone by using our model are classified as Sprawl.
Figure 12.Thematic map of the urban contexts.
The only urban context classified as Residential old town (in magenta) is an area including the historical center of Pozzuoli. The urban contexts classified as Coastal residential zone (in light blue) area residential coastal areas. The other coastal areas are, respectively, the maritime industrial area, classified as Industrial zone, and an area given by a maritime not residential microzone, classified as Fragmented rural/wooded zone since it is not a residential zone and a high percentage of this zone is covered by vegetation. All the contexts classified as Industrial zone (in red) are areas where most of the buildings are industrial buildings or warehouses. The contexts classified as Downtrodden residential zone (in orange) are residential areas with a high density of residential real estates for building and with a high population density. The other on average residential contexts are classified as Comfortable residential zone (in light green); in these zones the population density and the number of dwellings per residential building are not high; in addition, these zones are almost covered by transportation services and schools and in them there are public green areas. The contexts classified as Sprawl (in brown)are areas where the density of residential buildings is sparse; they are probably urban agglomerations in recent, slow and unplanned expansion. Finally, the contexts classified as Fragmented rural/wooded zone (in green) are areas predominantly or completely covered with vegetation.
Figure 13.Thematic map of the reliability of the urban contexts.
There are four contexts with a low reliability, in the range 0.2-0.4: three of these contexts are classified as Sprawl and the last as Downtrodden residential zone. In all these contexts are included microzones with a not high membership degree to their urban area class, meanly under the value 0.4. These results suggest the need of a finer classification of urban areas that for the urban contexts with a low reliability. In fact, in microzones classified as a specified urban area with a low membership degree probably there are different types of urban areas; a finer classification could also take into account classes of urban area to which microzones belong to a slightly lower degree of membership. For example, the context with low reliability classified as Downtrodden residential zone is given by a microzone classified as Downtrodden residential zone with a membership degree 0.36 and belonging to the class Industrial zone with a membership degree 0.31; this microzone are included a densely populated residential area and a non-residential areas with industrial premises; a finer classification of this microzone could consider both this class in order to characterize in greater detail the type of urban area that it represents.
5. Final considerations
We present a new model based on a Mamdani fuzzy rule system to partition an urban system in homogeneous urban contexts. We implement our model in a GIS platform and construct the urban contexts by considering initially the urban system partitioned in microzones. A set of indicators are defined to characterize urban areas; these indicators are fuzzified and used as variables in a fuzzy rule set used to classify the microzones; the urban contexts are obtained dissolving adjoining microzones belonging to the same urban area class. We assess the reliability of our classification assigning to any urban context the weighted average of the membership degree of the microzones within in it where the weight is given by the area of the microzone.
We test our model applying it to the Municipality of Pozzuoli (Italy) in order to partition the municipality in context classified based to the type of residential or rural area.
Author Contributions: The two authors participated equally in writing all the sections of this article and in the research activities necessary for the design, implementation and testing of the proposed model.
Funding: This research received no external funding.
Acknowledgments: We thank the references of the Office 5: "Urban Planning - Government of the Territory" of the municipality of Pozzuoli, and its manager, Arch. Agostino Di Lorenzo, for their support and the provision of all the data available at the Municipality used in the research
Conflicts of Interest: The authors declare no conflict of interest.
References
1. Arns Steiner M. T.; Datta D.; Steiner Neto P. J.; Scarpin C. T.; Figueira J. R. Multi-objective optimization in partitioning the healthcare system of Parana State in Brazil, Omega 2015, 52, 53-64, DOI: 10.1016/j.omega.2014.10.005.
2. Belussi A.; Negri M.; Pelagatti G. GeoUML: A Geographic Conceptual Model Defined Through Specialization Of Iso Tc211 Standards, 10th EC GI & GIS Workshop of ESDI State the Art, Waslaw, Ponland - 23-25 June 2004, 2004, 10 pp.
3. Bernábe M. B. L.; 1, Duque J. C.; Ramirez J. R.; Osorio M. A. L. Classification Over Geographical Zones: A Combinatorial Optimization Approach to the Regional Partitioning Problem, in 18th International Conference on Electronics, Communications and Computers, IEEE Computer Society, 2008, pp. 70-74, DOI: 10.1109/CONIELECOMP.2008.41.
4. Chen Y.; Su W.; Li J.; Sung Z., Hierarchical object-oriented classification using very high-resolution imagery and LIDAR data over urban areas. Advances in Space Research 2009, 43, 1101-1110, DOI: 10.1016/j.asr.2008.11.008.
5. Di Martino F.; Loia V.; Sessa S. A fuzzy-based tool for modelization and analysis of the vulnerability of aquifers: A case study. International Journal of Approximate Reasoning 2005, 38 (1), 99-111, DOI: 10.1016/j.ijar.2004.05.001.
6. Di Martino F.; Sessa S. Spatial analysis and fuzzy relation equations. Advances in Fuzzy Systems 2011, 2011 Article number 429498 14 pp., DOI: 10.1155/2011/429498.
7. Esposito G.; Matano F.; Sacchi M., Detection and Geometrical Characterization of a Buried Landfill Site by Integrating Land Use Historical Analysis, Digital Photogrammetry and Airborne Lidar Data. Geosciences 2018, 8 (9), 348, 14 pp, DOI: 10.3390/geosciences8090348.
8. Gu Y.; Wang Q.; Jia X.; Benediktsson J. A., A Novel MKL Model of Integrating LiDAR Data and MSI for Urban Area Classification. IEEE Transactions on Geoscience and Remote Sensing, 2015, 53 (10), 5312-5326, DOI: 10.1109/TGRS.2015.2421051.
9. Forestier G.; Wemmert C.; Puissant A., Coastal image interpretation using background knowledge and semantics. Computer & Geosciences 2013, 54, 89-96, DOI: 10.1016/j.cageo.2012.11.023.
10. [Gerundo C..; Adad G. N. Promoting Cultural Resources Integration Using GIS. The Case Study of Pozzuoli. In: Calabrò F., Della Spina L., Bevilacqua C. (eds) New Metropolitan Perspectives. ISHT 2018. Smart Innovation, Systems and Technologies, 2018, vol 100. Springer, Cham 182-188., DOI: 10.1007/978-3-319-92099-3_22.
11. Judenherc S.; Zollo A. The Bay of Naples (Southern Italy): Constraints on the volcanic structures inferred from a dense seismic survey. Journal of Geophysical Research Atmospheres 2004, 109 (B101312), DOI: 10.1029/2003JB002876.
12. Leichtle T.; Geiß C.; Wurm M.; Lakes T.; Taubenböck H. Unsupervised change detection in VHR remote sensing imagery – an object-based clustering approach in a dynamic urban environment. International Journal of Applied Earth Observation and Geoinformation 2013, 2017, 15-27, DOI: 10.1016/j.jag.2016.08.010. 13. Mamdani E. H.; Assilian S. An experiment in linguistic synthesis with a fuzzy logic controller. International
Journal of Man-Machine Studies 1975, 7 (1), 1-13, DOI: 10.1016/S0020-7373(75)80002-2.
14. Mamdani E. H., Application of fuzzy logic to approximate reasoning using linguistic synthesis. IEEE Transactions on Computers 1977, 26 (12), 1182–1191, DOI: 10.1109/TC.1977.1674779.
16. Pelagatti G.; Belussi A.; Negri M. GeoUML Methodology e Tools An Overview , Spatial DB Group Politecnico di Milano - Comitato di Progetto e Struttura tecnica di supporto CISISCPSG, 2011, 85 pp., web site: http://geo.spatialdbgroup.polimi.it/index.php?eID=tx_nawsecuredl&u=0&g=0&t=1537364338&hash=b63e 5a9996cfe7f7afffed72ff1dbb2223ee5f9f&file=fileadmin/download/geo/docs/en/GeoUML-Int.pdf .
17. Petrosino S.; Cusano P.; Madonia P. Tidal and hydrological periodicities of seismicity reveal new risk scenarios at Campi Flegrei caldera. Scientific REPORTS (2018) 8:13808, DOI:10.1038/s41598-018-31760- 18. Sheeren D.; Quirin A.; Puissant A.; Gançarski P.; Weber C. Discovering rules with genetic algorithms to classify
urban remotely sensed data, in 2006 IEEE International Symposium on Geoscience and Remote Sensing, 31 July-4 Aug. 2006, 2006, 3902-3905, DOI: 10.1109/IGARSS.2006.1005.