Algorithm to Determine the Safest Route
Sarang Tarlekar1, Asmita Bhat2, Suhas Pandhe3, Tejaswini Halarnkar4
1
Electronics and Telecommunications Department, Shrimati Kashibai Navale College of Engineering Pune, India
2,3
Computer Engineering Department, Pune Institute of Computer Technology Pune, India
4
Computer Engineering Department, Vishwakarma Institute of Technology Pune, India
Abstract— As a result of the increasing occurrences of criminal activities, it has become vital to ensure the safety of people to the best possible extent. Road safety, in particular, is of tremendous importance as people need to travel on a daily basis to places, known or unknown. Most of the criminal activities occur when the person is in transit be it any mode of transport: walking, public transport vehicles, personal vehicles, auto rickshaws or cabs. In this paper, we attempt to mine the records of 12 years based on geographical locations to determine the safest route amongst all possible routes for given source and destination at a particular time. We use the ID3 decision tree algorithm and determine the risk involved for the streets within a given route. Also, based on the gender and the age of the people involved, the safest route is suggested so as to provide safety while travelling. This paper discusses the dataset used, the ID3 algorithm and the results. This algorithm can be used for varied applications such as area wise crime analysis, criminal profiling and assisting in real estate for prospective buyers.
Keywords—Data mining, Location based service, ID3 Decision tree, Safest Route.
I. INTRODUCTION
Criminal incidents are on a rise all over the world. With the advancement in technology and the easily available data related to crime, it is possible to analyze this data to increase the awareness and safety of citizens. We use the dataset of San Francisco to propose a model for determining the safest path from one location to other.
A. Dataset Description
Dataset contains criminal incidents over 12 years that have occurred in San Francisco. The parameters considered are date of the incidence, the time and address of occurrence of the crime, the description of the crime, the category of the crime, action taken against the crime and geographical location of the occurrence of the incidence.
The dataset consists of all the crimes that have occurred within 12 years. These crimes range from petty traffic violations to assault and attempt to murder. Each incident within the city that occurred within the period of 12 years is considered in the dataset.
II. RELATED WORK
A group created a mining model to find a decision tree
based on attributes from criminal cases. [6] This application
can be used to find likelihood of involvement of particular suspects with similar criminal activities, by making decision rules from this tree. The main focus in this method is on criminal profiling.
Another group put forth an algorithm that detects patterns of crime committed by the history sheeters. They proposed this by successively adding crimes to patterns
based on likeness of attributes of the crimes. [2]
One other application was presented in which the likelihood of future occurrence of residential burglary was
determined. [7] The authors attempted to use various
classification techniques to determine the best suited attributes for considering the likelihood.
All the works focus on using either grid based spatio temporal analysis or criminal profiling using classification techniques.
III. PROPOSED APPROACH TO SAFEST PATH
A. Data Preprocessing
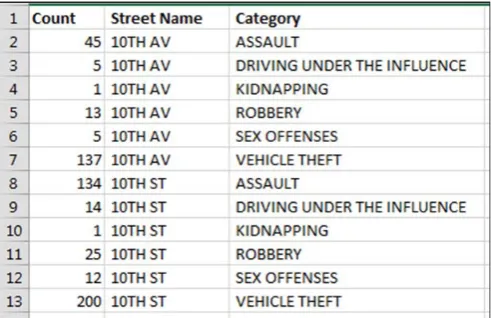
The dataset consists of various fields such as the address of the place where the incident occurred, the geographical location of the incident, the type of the crime, the category of the crime, the action taken against it, the time of occurrence of the crime, etc. This dataset is tailored to suit our needs. For this, the data is extracted and presented in such a way as to suit the need of application. The street names are extracted from the address field of the crime. Street profiles are created for each street.
Fig. 1 Sample of street profiles extracted from the dataset
B. Input for Safest Route
An android application will be used to take the address of the place as the input from user. In addition, the age and gender of the user will be also taken as input. Also, the time will be taken as input from the android application. User will provide input in the form of two locations A and B respectively. From A to B there maybe multiple possible
routes. Let routei be ith route between A and B. Each route
will have the precise navigation information as the street name and the distance to be travelled on that street. Each
route may consist of one or more streets. For a routei, let jth
street on the routei be labelled as streetij. Multiple possible
paths will be analyzed for safety.
C. Analysis of Safety of Each Route
A route may consist of one or more streets. Each street within the route will be compared to the dataset and the count for each crime will be considered. For each street, value of the offence is considered. The values of offences will be such that the age and the gender of the user and the time will be considered. The dataset will be filtered for age specific and gender specific crimes. Only the data applicable to that particular user will be considered. Each
streetij has its profile fed to the ID3 classifier. The ID3
classifier will return the safety of that particular street. For each routei,the safety of each of its streetij will be calculated
in terms of “Yes” or “No”. This information will be further analyzed to find the safest route.
D. Building the Classifier
Local crime control experts such as police officers and other law enforcers will look at some of the street profiles and decide if the street is safe or not. This data by the local experts will be used for building a classifier. The classifier output will be of type “Yes” or “No” which answers whether a street is safe or not.
E. Evaluating the Safest Route
The safest route can be determined from the safety of all of its streets. The unsafe streets in that route will be analyzed further for risk weight. Risk weight is the risk involved in a particular street. Risk weight for a street is
calculated by summing up the multiplication of the count of
occurrences of nth crime with the crime factor for that
crime. By intuitive notion, crime factor is proportional to the punishment prescribed for the crime. More heinous the crime higher is the crime factor.
Crime factor of crime ∝ Sentence served for that crime.
The risk for a routei is the summation of the product of
the risk weight of streetijk and the distance of the streetijk
where streetijk is the kth unsafe streetij for a routei. Only the
streets with safety values as “No” will evaluated.
1) Calculation of risk weight of streetij:
Risk weight of street count ∗ risk factor
Where,
Total = the number of types of crimes
Count = the count of criminal incidents for crimen
for streetij
Crime factor = the intensity of the crime
2) Calculation of risk of a routei:
Risk of route Risk wieght of street ∗ distance
Where,
tu = total number of unsafe streets on that routei.
The route with the minimum amount of risk will be the safest route. The user will have the option to share the safest route on social media to let well-wishers know the route he will be taking.
IV.IMPLEMENTATION
In paper, crime is defined to be any incident or activity that may affect the safety of a person traveling through a region. Pertaining to this work, we have considered incidents that have relevant criminal activity (compared to irrelevant incidents such as cybercrimes or felony).
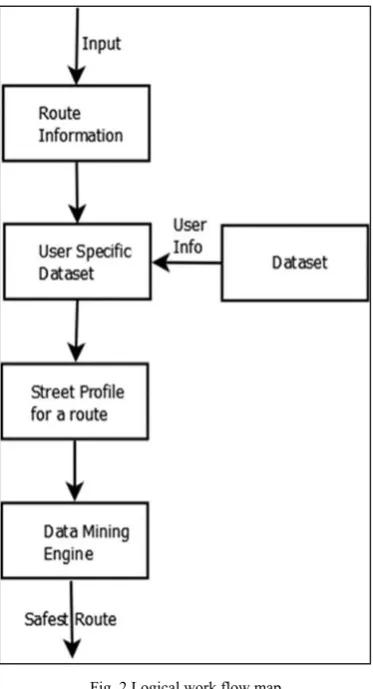
The logical work flow map is as shown in Fig. 2. Initially, the input provided will be processed and route information will be obtained. The route information will comprise of the street(s) contained in the routes. The dataset relevant to the user will be filtered out of the main dataset. Street profiles for all the routes will be obtained. The street profiles will be fed to the data mining engine. The data mining engine will consist of two parts.
1) ID3 decision tree classifier: The ID3 classifier will
check the safety of all the streets in a route. Similarly, other routes and their constituent streets will also be analyzed. The street profiles will be considered with a safety value of “Yes” or “No” determined from the ID3 decision tree.
2) Safest route determination: The streets of a route
Fig. 2 Logical work flow map
V. ID3 DECISION TREE ALGORITHM
Iterative Dichotomiser 3 or ID3 is an algorithm which is used to generate decision tree. First a table is created which contains street number versus all the categories of crimes for a training data set. The basic step in constructing ID3 decision tree is attribute selection. The two mathematical
terms used to process attribute selection are Entropy [3] and
Information Gain [3]. These 2 terms will be used by the ID3
algorithm to determine which attribute will be selected to become a node of decision tree. All the records in the table are referred as the Collection(c).
Calculation of Entropy: Entropy is defined as the average
amount of the information contained in the event, sample or record.
1 ∗ log
p (I) refers to the proportion of S belonging to class I. ∑ is over c i.e. summation of all the classifier items.
,
∑ | | | |⁄ ∗
Where,
S is the total collection of the records.
A is the attribute for which gain will be calculated.
v is all the possible of the attribute A
Sv is the number of elements for each v for instance
∑ is the summation of ((|Sv|/|S|) * Entropy (Sv)) for
all the items from the set of v.
VI.RESULTS
For the above application, ID3 decision tree is constructed. After executing the ID3 algorithm the results shown in Fig. 3 were obtained. The input to the application is a file containing streets with their corresponding profiles, i.e. the count of different categories of crimes for the street. The count values are compared to a threshold value to determine if the value of the crime is “High” or “Low”.
The training dataset is subjected to calculation of information gain for each attribute. After calculating the information gain for all the attributes, the information gain for Drunken Driving comes out to be the highest. Hence, Drunken Driving forms the root node. For every successive node the information gain is calculated recursively till all the leaf nodes are reached.
When Table 1, which is a sample of the training dataset, is given to the ID3 algorithm it produces the decision tree as shown in Fig 4.
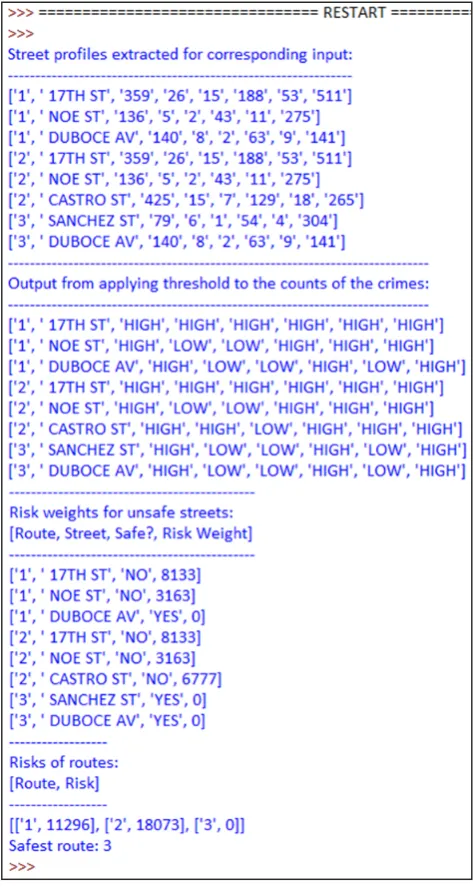
Fig 5 shows the output from the application of a pair of source and destination. The source and destination have 3 possible routes, each of which consist of multiple streets.
For given source and destination, the application gave 3 possible routes and their constituent streets. From amongst the 3 routes, the safest route was determined and displayed in the application.
TABLE I SAMPLE OF TRAINING DATASET
Street Assault Sexual
Offences
Driving under the
influence Kidnapping Robbery
Vehicle
theft Safety
1 HIGH HIGH HIGH LOW LOW HIGH NO
2 LOW HIGH HIGH LOW HIGH LOW NO
3 LOW LOW LOW HIGH HIGH LOW YES
4 HIGH LOW LOW HIGH HIGH HIGH YES
5 HIGH LOW LOW HIGH LOW LOW YES
Fig. 3 Results produced by ID3 Decision tree when Table 1 is given as input
The decision tree in Fig 4 is used to find the safest route from multiple possible routes.
When the 3 routes and their constituent streets were given to the application, it generated the street profiles for each street within each route. The street profiles were extracted from the original dataset that consists of street profiles for all the streets within the city. The values, i.e. the count of crimes, within the street profiles are each considered for thresholds to determine if the value is “high” or “low”. These values are used as input for the decision tree, shown in Fig. 4.
Fig. 4 Representation of Fig. 3 in the form of decision tree
As each street profile was fed to the decision tree, the decision tree determined the safety of a street. Only for unsafe streets, the risk factors of those streets were considered. After summing up all the risk factors within a route, risk for each route was calculated. The route with
Fig. 5 The analysis of unsafe streets and the final safest route
Using ID3 decision tree, highly accurate results are obtained. The contributions to this high accuracy are the two mathematical terms Entropy and Information Gain. On an average an accuracy of 86% is achieved which is relatively high compared to neural networks and other classification algorithms.
VII. CONCLUSION AND FUTURE SCOPE
An application of data mining, which will determine the safest route from source to destination based on ID3 decision tree algorithm, has been presented. The safety of the user can be assured if this application is used. The application minimizes the risk involved while travelling through a particular area. Social support through social media or messaging will also be provided to ensure that close ones know where the particular user will travel from.
be done too. For this, repetitive offenders can be mapped to their corresponding categories of crimes or their areas of activity to help solve future cases. In addition, safer areas from real estate perspective can be determined. Also, verified users can travel together for common destinations.
REFERENCES
[1] C.-H. Yu, M. W. Ward, M. Morabito, and W. Ding, “Crime Forecasting Using Data Mining Techniques,” 2011 IEEE 11th Int. Conf. Data Min. Work., pp. 779–786, 2011.
[2] TongWang1, Cynthia Rudin1, DanielWagner, and Rich Sevieri. Learning to detect patterns of crime. JECET, 1:124{131, 2012. [3] J. Han, M. Kamber, and A. K. H. Tung, “Spatial Clustering Methods
in Data Mining: A Survey,” Geogr. Data Min. Knowl. Discov. vol. 2, 2001.
[4] S. Deerwester, S. Dumais, T. Landauer, G. Furnas, and R. Harshman, “Indexing by Latent Semantic Analysis,” J. Am. Soc. Inf. Sci., vol. 41, no. 6, pp. 391–407, 1990.
[5] J. R. Quinlan, “Induction of Decision Trees,” Mach. Learn., vol. 1, no. 1, pp. 81–106, 1986.
[6] Ruijuan Hu. Data mining in the application of criminal cases based on decision tree. International Journal of Engineering Sciences, 2:24–27, 2013.