1
Wheat varietal differences in below ground biomass revealed by a
1semi-quantitative estimation of wheat root DNA in soil samples
23
Huw Jones1, Steven Bentley1, Lydia Smith1, Alison Karley2, Tracy Valentine2, Charlotte
4
White3, Rhys Ashton4, Lesley Boyd1
5 6
1NIAB, Huntingdon Road, Cambridge, CB3 0LE, UK
7
2James Hutton Institute, Invergowrie, Dundee, DD2 5DA, Scotland, UK
8
3ADAS Gleadthorpe, Meden Vale, Mansfield, Nottinghamshire, NG20 9PD, UK
9
4Rothamsted Research, Harpenden, AL5 2JQ, UK
10 11 12
Corresponding author: Huw Jones ([email protected])
13 14 15
Abstract
16 17
Root research on field grown crops is hindered by the difficulty of estimating root biomass in
18
soil. Root washing, the current standard method is laborious and expensive. Biochemical
19
methods to quantify root biomass in soil, targeting species-specific DNA, have potential as a
20
more efficient assay. We combined an efficient DNA extraction method, designed
21
specifically to extract DNA from soil, with well-established quantitative PCR methods to
22
estimate the root biomass of twenty-two wheat varieties grown in field trials over two
23
seasons. We also developed an assay for estimating root biomass for black-grass, a common
24
weed of wheat cultivation.
25
Two robust qPCR assays were developed to estimate the quantity of plant root DNA in soil
26
samples, one specific to wheat and barley, and a second specific to black-grass. The DNA
27
qPCR method was comparable, with high correlations, with the results of root washing from
28
soil cores taken from winter wheat field trials. The DNA qPCR assay showed both variety
29
and depth as significant factors in the distribution of root biomass in replicated field trials.
30
The results suggest that these DNA qPCR assays are a useful, high throughput tool for
31
investigating the genetic basis of wheat root biomass distribution in field grown crops, and
32
the impact of black-grass root systems on crop production.
33
Keywords: Root biomass, wheat, field crops, black-grass, high-throughput
34
2
1.
Introduction
35 36
In the UK wheat is the single largest cereal crop, nationally accounting for 65% of total
37
cereal production (DEFRA, 2017). The increasing global demand for wheat means that plant
38
breeders are faced with the challenge of improving grain production against a scenario of
39
changing environmental conditions, rising costs and dwindling resources. These
40
considerations drive global agriculture towards reduced input regimes, particularly a
41
decreased dependence upon nitrogen-phosphorus-potassium (NPK) fertilisers. While,
42
historically, wheat breeding has focussed on the impact of above ground plant characteristics
43
on yield, these challenges now increase the need to understand how root growth and root
44
interactions with the soil environment; biological, chemical and physical, work together to
45
influence yield (den Herder et al., 2010). Plant architecture genes such as Rht (reduced
46
height) increase grain yield through a repartitioning of biomass to the grain, increasing the
47
harvest index, but their effect on partitioning of biomass between roots and shoots is less well
48
understood. In addition to genetic differences, many agronomic practices are known to
49
influence root establishment and biomass development, e.g. position in a crop rotation,
50
nitrogen application and timing, cultivation type, seed rate, sowing date and plant growth
51
regulator applications (Hoad, 2001; Bayles et al., 2002).
52
Root phenotyping is a rapidly developing field (George et al., 2014) with particular attention
53
paid to traits that may influence drought resistance (Wasaya et al., 2018) and nitrogen use
54
efficiency (Rosolem et al., 2017). Field observations in trench walls are laborious (Carter et
55
al., 2019) and observations through buried tubes (mini rhizotrons) require site preparation
56
and complex calibrations (Postic et al., 2019). The current standard method of quantify root
57
biomass is to wash roots free from the soil and quantify as root length per unit volume of soil
58
(White et al., 2015). Image analysis methods aid data capture (Zhu et al., 2011; Bauhus &
59
Messier, 1999), but the washing process is laborious, time consuming and hence expensive.
60
The results obtained by these methods are informative with regards the proportions of fine to
61
coarse roots, but results may not be transferable between different soil types (Kücke et al.,
62
1995). Field root phenotyping of wheat, using a ‘core break – root count’ method, showed
63
considerable variation for deep root traits (Wasson et al., 2014). Non-invasive geophysical
64
methods, such as ground penetrating radar and electrical resistivity tomography, have been
65
successful in measuring large tree roots (Butnor et al., 2001, Paglis, 2013). However, these
66
procedures are currently less informative for plants with fine root structures, where the root
67
dimensions are similar to those of soil aggregates and pores (Amato et al., 2009). However
3
root electrical capacitance has been shown to correlate with root mass for barley in
69
glasshouse experiments (Dietrich et al., 2013) and electrical resistance tomography has been
70
used to measure soil profile drying which is, in turn, a proxy for root activity (Whalley et al.,
71
2017).
72
The use of rhizotron-based systems for root characterisation are well established (James et
73
al., 1985), and being amenable to automation allow for repeated measurements during plant
74
development (Lobet & Draye, 2013). However rhizotrons, being artificial environments, are
75
somewhat removed from the field environment. Root biomass correlations between rhizotron
76
and field were found to be high during the vegetative growth phases, but low during the
77
reproductive growth phases (Watt et al., 2013). Allied to rhizotrons are X-ray computed
78
tomography (CT) systems capable of visualising detailed root structures in soil. Industrial
79
micro-CT systems with resolutions of 500 nm or less (Mooney et al., 2012; Xu et al.,2018),
80
coupled with automated systems for sample presentation and data processing (Mairhofer et
81
al., 2012), are also a valuable tool for root phenotyping in rhizotrons.
82
Quantitative, species-specific DNA detection methods, coupled with robust soil extraction
83
techniques, have been deployed to identify and quantify roots in soil. Real-time PCR has
84
been used to differentiate between grassland species in mixtures of roots washed from soil
85
(Mommer et al., 2008), to quantify root ratios (Zhang et al., 2014) and to measure roots from
86
a mixed population of meadow grasses (Riley et al., 2010, Haling et al., 2011; Haling et al.,
87
2012). Detecting roots by DNA-based methods is however not straightforward (Mommer et
88
al., 2011): soil contains humic acids that are known to inhibit PCR by binding MgCl2, so
89
appropriate modification of DNA extraction methods is required. The concentration of plant
90
DNA in soil has been shown to decline rapidly after plant death (Riley et al., 2010; Bithell et
91
al., 2015; Pierre et al., 2018), therefore the plant DNA in soil samples is largely derived from
92
live roots. As roots comprise a small part of the total soil volume the most suitable PCR
93
targets are those present at high copy number in the plant genome, e.g. ribosomal DNA
94
internal transcribed spacer (rDNA ITS) regions. DNA-based assays targeting rDNA ITS were
95
successfully used to assess root development under drought-conditions in Australian wheat
96
varieties (Huang et al., 2013), assessing the root health of sugar-cane ratoons (Pierre et al.,
97
2018) and investigating root responses to phosphorous fertility status (McDonald et al., 2017)
98
Black-grass (Alopecurus myosuroides. Huds) is an annual weed which presents a major
99
problem to European cereal growers. Relatively low populations of 8-12 plants m-2 have been
4
shown to have a significant impact on wheat grain yields (Naylor, 2008). An efficient method
101
by which to measure root development of the crop and the weed is required to understand
102
competition for water and nutrients in the field. While partitioning of total root biomass
103
between weed and crop species in washed roots can be carried out using a variety of
104
techniques (Mommer et al., 2011), including visual observation (Zhang et al., 2018),
infra-105
red spectroscopy (Meinen & Rauber, 2015) and biochemical analysis of plant waxes (Dawson
106
et al., 2000), species can only be reliably distinguished by sequencing the rDNA ITS region
107
(Linder et al, 2000). Species-specific quantitative PCR has been used to quantify root
108
biomass of a single species in perennial grass swards (Haling et al, 2012) and to determine
109
the ratio of different species within mixed sward samples (Haling et al., 2011).
110
In this study we have developed semi-quantitative DNA-based assays able to estimate root
111
biomass of field grown wheat varieties and black-grass using root DNA extracted from soil
112
core samples. We compared this qPCR assay to the results obtained with standard root
113
washing procedures for estimating root biomass from soil cores. The qPCR-assay was then
114
used to compare differences in root biomass between wheat varieties, at different depths in
115
field trials grown over two seasons. We discuss the power and limitations of this method, and
116
outline the potential of this technology as a tool for plant breeders, agronomists and root
117
biologists.
5
2.
Results
120
2.1 Development of wheat and black-grass specific qPCR assays for soil extracted DNA
121
The soils for which DNA extraction methods were developed had textures described as sandy
122
loam, sandy silt loam, silt loam, silty-clay loam, clay loam and fine loam over clay. We found
123
the PowerSoil DNA extraction kit yielded DNA of sufficient quantity and quality to carry out
124
qPCR, however, the DNA yield was not sufficient to assess DNA concentration or quality on
125
an agarose gel. Single copy gene targets did not give reliable PCR results using genomic
126
DNA (data not shown), however when PCR was carried out using primers targeting the
127
ribosomal internally transcribed spacer (ITS) region amplification products were obtained for
128
the majority of soil samples tested. The calibration of the qPCR system showed the expected
129
log – linear response between concentration and Ct (cycle threshold). Amplification
130
efficiencies were between 0.982 - 1.135 across all plates, with correlation coefficients in the
131
range 0.981 – 0.995 over a five decade range of 1000 µg/µl to 0.1 µg/µl. An analysis of
132
variance of RBD values obtained from the technical, DNA replications showed no significant
133
difference between RBD values (F= 0.13, p = 0.722).
134
Wheat primers were tested for specificity against a range of field crops grown in the UK.
135
Amplicons were obtained for wheat and barley DNA, but there was no reaction with maize,
136
oilseed rape or faba bean DNA. The wheat primers were also tested against black-grass and
137
found to produce no amplification. With the black-grass primers amplicons were obtained
138
only with black-grass DNA, there was no amplification with wheat and barley DNA. Soil
139
extracts for cores taken from an area of bare soil within the 2012 trial site gave no PCR
140
amplification with wheat ITS primers.
141
2.2 Comparison between the DNA-based and root washing assays
142
Root biomass, as measured by the DNA-based PCR assay (RBD; µg dry roots / g air dried
143
soil) was compared to root length density (RLD: cm/cm3) at the 4 depths taken through the
144
soil profile in the 2012 and 2014 trials (Figure 1; Table 1). High Pearson correlations were
145
found in both the 2012 (r = 0.7947; df = 10; p = 0.002) and the 2014 (r = 0.674; df = 22; p <
146
0.001) trials, while combining the data from the two seasons gave a value of r = 0.702 (df =
147
34, p < 0.001). Examining the wheat varieties independently also showed good correlations
148
between RBD and RLD measurements; Alchemy r = 0.918 (df = 2, p = 0.082), Glasgow r =
149
0.762 (df =10, p = 0.004), Oakley r = 0.735 (df = 14, p < 0.001) and Viscount r = 0.992 (df =
6
2, p = 0.007). The DNA qPCR method therefore provided a good estimate of root biomass,
151
even at the lower depths where lower RLDs were found.
152
2.3 Comparison of root biomass between wheat varieties and soil depth in the 2012 pilot trial
153
A one-way ANOVA of the 2012 RLD data indicated that differences in root content by depth
154
were highly significant (F = 182.9; p < 0.001), with RLD values decreasing with soil depth,
155
but that differences between varieties were not significant (F = 0.17; p = 0.846). A one-way
156
ANOVA of the 2012 RBD data also highlighted significant differences in root biomass by
157
depth (F = 6.83; p < 0.003), but not between varieties (F = 1.03; p = 0.375). However, the
158
low p value for RBD (p = 0.360) compared to RLD (p = 0.839) suggests that RBD
159
measurements on a series of larger field trials might offer a better prospect of discriminating
160
among wheat varieties than RLD.
161
2.4 Comparison of root biomass between wheat varieties and soil depth in the 2014 and 2015
162
trials
163
For soil cores sampled from the 2014 and 2015 trials a linear mixed model analysis of RBD
164
showed highly significant differences between varieties, depths and the interactions between
165
varieties x depth, but no significant difference between years (Table 2). However, a variety x
166
year effect was seen, indicating that the root biomass produced by each wheat variety differed
167
between the 2014 and 2015 field trials.
168
In general, the highest RBD values were found in the upper soil profiles and the lowest
169
values at depth, with all 22 wheat varieties tested (Figure 2, Supplementary Table 2). At each
170
depth RBD varied between 0.7-721 µg /g (0-250 mm), 0.9 - 394 µg /g (250-500 mm), 0.0 -
171
119 µg /g (500-750 mm) and 0.0 - 42.3 µg /g (750-1000 mm). More than 50% of the
172
measured RBD was in the upper 500 mm of the soil profile in all, but two of the plots
173
sampled in each field trial (data not shown). The proportion of RBD in the upper 500 mm of
174
the soil profile averaged 79% in 2014 and 88% in 2015. Regression analysis showed that a
175
quadratic fit best described the variation in RBD with depth, for all varieties. The regression
176
equations were integrated and used to calculate D50 and D95 by the method of Schenk and
177
Jackson, (2005). The values for D50 had a range of 274-620 mm below the soil surface, with a
178
mean of 459 mm. The values for D95 had a range of 695-976 mm below the soil surface, with
179
a mean of 876 mm. The mean results over two years are shown in Table 3 and the full results
180
are given in Supplementary Table 3. The values for D50 and D95 allow rapid identification of
7
shallow rooting and deep rooting varieties, and indicate that varieties Norman and SHW Xi19
182
/ (Xi19 // SHW-218) >18 are shallow rooting, while varieties Cadenza and Xi 19 are deep
183
rooting.
184
In the 2014 trial RLD data was only obtained for two of the 22 wheat varieties. Therefore an
185
analysis of variation between wheat varieties using the RLD data was not undertaken.
186
2.5 Influence of key genetic traits on RDB values
187
The varieties under test varied in their seasonal growth habit, in their status at the
semi-188
dwarfing, Rht loci, the photoperiod response, Ppd loci and the presence/ absence of the rye
189
translocation (1B/1R) (Supplementary Table 1). Highly significant differences (F= 18.67, p <
190
0.001) were found in RBD values between varieties with different seasonal growth habits,
191
with spring types having the greater average RBD within the soil profile, followed by
192
alternative and winter types. Variation at the Rht loci was also associated with variation in the
193
RBD phenotype (F= 2.71, p < 0.050), with Rht showing a significant interaction with trial
194
year (F = 3.61, p = 0.013). No significant variation in the RBD values was accounted for by
195
the presence or absence of the rye translocation (F = 0.47, p = 0.506), or variation at the Ppd
196
loci (F = 1.73, p=0.096).
197
The variation in RBD values associated with the Rht loci was significant in 2014 (p < 0.001),
198
but not in 2015 (p =0.128). In 2014, wheat varieties harbouring wild type alleles and Rht2
199
had greater average RBD throughout the soil profile than those harbouring Rht1 and Rht8;
200
this trend was not observed in the 2015 data. These observations may be linked to differences
201
in the weather conditions at the 2014 and 2015 test sites. In 2014 the winter and spring
202
temperatures were uncharacteristically high (anomaly 1.8ºC and 1.6 ºC) relative to the thirty
203
year average (1981-2010), while conditions in 2015 were closer to the thirty year average
204
(anomaly 0.3ºC and 0.2ºC) (http://www.metoffice.gov.uk/climate/uk/summaries/)
205
(Supplementary Table 4).
206
2.6 Heritability of the RBD phenotype
207
Broad sense heritability for total RBD in the soil profile was calculated as 0.16, while the
208
heritability of RBD was 0.11 in the upper 250 mm of the soil profile, 0.21 in the profile at
209
250-500 mm depth, 0.00 in the profile at 500-750 mm depth and 0.43 in the profile at
8
1000 mm depth. These results suggest that RBD, particularly RBD at depth should be
211
amenable to selection by plant breeders.
212
2.7 Black-grass observations
213
In 2015 soil cores were taken within the wheat trial from areas with ‘low’, ‘moderate’ and
214
‘high’ black-grass. Black-grass RBD values were 0.0 µg/ g dry soil in ‘low’ black-grass areas
215
(no discernible black-grass foliage observed), between 0.0 and 2.5 µg/ g dry soil in
216
‘moderate’ black-grass areas (50 black-grass heads m-2) and between 1.9 and 18.2 µg/ g dry
217
soil in ‘high’ black-grass (300 black-grass heads m-2) areas (Table 4). The RBD of wheat
218
roots in these soil cores was also measured, being similar to the RBD values obtained in the
219
full 2015 wheat variety trial. In the soil cores taken from the ‘high’ density black-grass area,
220
over 70% of the black-grass root RBD was in the top 250 mm of the soil profile, while in the
221
‘moderate’ density black-grass area, over 90% of the root biomass was in this upper profile.
222
Three observations do not allow any conclusions to be drawn on whether ‘high’ black-grass
223
densities inhibit wheat root development, but our results show that this technique could be of
224
value in larger, crop-weed competition studies.
225
3.
Discussion
226Traditional root washing methods used to assess root development in field experiments are
227
both time consuming and costly. In this study we have developed a robust, semi-quantitative
228
PCR method to reliably measure root biomass of wheat and the major weed of cereal crops,
229
black-grass, down to soil depths of 1 metre. We show that the qPCR assay can distinguish
230
wheat from among most other major agricultural crops, and from black-grass. The ability to
231
exclude weed roots from the total root density represents an advance over conventional root
232
washing methods, while the ability to quantify black-grass root biomass relative to wheat root
233
biomass will be useful in competition experiments to determine the impact of weeds on wheat
234
production.
235
Despite the inherent variation present within the PCR technology (Karlen et al., 2014), the
236
estimate of root biomass as determined by RBD correlated extremely well with classical root
237
washing RLD measurements in both the 2012 and 2014 field trials. In general root density
238
decreased with soil depth. However the RBD assay did identify distinct differences between
239
wheat varieties in root distribution through the soil profile, some varieties from the 22 tested
9
being better at producing roots at depth, with a significant interaction between varieties and
241
depth being observed in both the 2014 and 2015 field trials. A variety x year effect was also
242
observed, indicating that root production was significantly influenced by the different
243
climatic and environmental growing conditions prevalent in the 2014 (Burkees Field, silty
244
clay loam) and 2015 (Willow Tree Field, silt loam / sandy silt loam) trials.
245
Compared with current methods we can see that the RBD assay has both strengths and
246
weaknesses. Cores can be taken at any point in the growing season, allowing root biomass
247
accumulation in the field to be assessed through-out the growing season. The soils assayed in
248
this study had textures described as sandy loam, sandy silt loam, silt loam, silty clay loam,
249
clay loam and fine loam over clay, with RBD working equally as well in all these soil types.
250
Basically the method can be implemented in any soil that can pass through a mill. Removal
251
of roots by washing from heavy soils requires prolonged sample pre-treatment with sodium
252
hexametaphosphate solution and use of a hydropneumatic elutriation system (Thivierge et al.,
253
2015).
254
The RBD assay makes the assumption that the ratio of ribosomal DNA to genomic DNA
255
does not differ between wheat varieties or the developmental stage of the plant (Huang et al.,
256
2013). For example, in older roots the cortex dies leaving only the stele, thus older, larger
257
roots may be under-represented by the RBD assay. Conversely, very fine roots, which are
258
difficult to wash from soil samples, may be under-represented in the RLD assay (Sierra et al.,
259
2003). Clearly the RBD method does not allow a detailed dissection of root architecture; for
260
example rooting angles or the ratio of fine to coarse roots. However, the DNA based method
261
does allow root development to be studied in field situations through-out the growing season,
262
with processing time being less than that required for soil washing assays.
263
Despite the limitations, the RBD assay would allow cost effective (Supplementary Material
264
part 5) estimation of root biomass within the soil profile, supporting studies of rooting
265
behaviour between different wheat genotypes and an exploration of the effects of differing
266
agricultural practices on root development. In developing this RBD assay as a standard
267
method to be adopted by the research community we would seek to develop standardised
268
calibration materials and agreement on the basis by which results are declared, that would
269
allow comparable results to be shared by the root research community.
10
4.
Materials and methods
272 273
4.1 Wheat variety trial root-soil core sampling
274
Soil samples were collected from wheat variety field trials over three growing seasons, soil
275
cores being taken from within each variety plot (Table 5). In 2012 a three variety trial was
276
grown with one plot per variety. In 2014 and 2015, eighteen wheat varieties and four
277
breeders’ lines were grown, with three replicate plots per genotype. The varieties grown in
278
each trial are given in Supplementary Table 1. The wheat varieties were planted in a
279
randomised complete block field trials design (Supplementary Materials Part 3). In 2012 soil
280
cores were also taken from adjacent, uncultivated areas of the site. Soil data for each site was
281
taken from the LANDIS Land information system (Landis, 2014; Supplementary Materials
282
Part 2).
283
Ten soil cores, measuring 1 m depth x 30 mm diameter, were sampled from each 10 x 2 m
284
plot in accordance with standardised methods (White et al. 2015). The soil cores were
285
sampled when the wheat crop had reached growth stage (GS) 51-65 (Zadoks et al., 1974).
286
Five cores were sampled within the rows and five were taken between the rows, in
287
accordance with the spatial sampling as proposed by Bengough et al. (2000). The cores were
288
divided into four portions, representing 250 mm depth intervals in the soil profile. The four
289
sections from the ten plot cores were bulked into a single sample representing a depth
290
interval, giving one sample at each of four depths per plot.
291
Soil cores were taken in the 2012 pilot trial and a subset of the 2014 trial for both root
292
washing estimates of root length density (RLD) and for root biomass DNA (RBD)
293
estimations using a semi-quantitative PCR assay developed in this study. Soil cores were
294
taken in the 2014 and 2015 trial for RBD analyses. In the 2012 trial, cores were taken for
295
RBD and RLD analysis from one replicate plot of each of three varieties; Alchemy, Oakley
296
and Viscount, while in the 2014 trials cores were taken from three replicate plots of two
297
varieties; Glasgow and Oakley. To assess black-grass root biomass additional cores were
298
taken in the 2015 trial from three areas in the ‘discard’ crop surrounding the trial (variety
299
Crusoe). These areas were judged by visual inspection as having high, moderate and low
300
density black-grass populations: the black-grass population was estimated by counting the
301
number of individuals within four quarter m2 quadrats.
302
4.2 Wheat varieties assessed for root biomass
11
The wheat varieties grown in the 2014 and 2015 trials were selected based on genotypic
304
diversity and phenotypic information from rhizotube experiments undertaken on a collection
305
of 100 wheat varieties and breeders lines (Greenland et al., 2017). In addition, the two
306
breeders lines SHW Xi19 / (Xi19 // SHW-218)>18 and SHW Xi19 / (Xi19 // SHW-218)>19
307
were included. These backcross-derived lines from the cross (Xi19 / (Xi19 // SHW-218))
308
were each descended from different BC1 plants (plants XS-218>18 and XS218>19,
309
respectively). SHW-218 is a synthetic hexaploid wheat supplied by CIMMYT, with the
310
published pedigree Ceta / Ae squarrosa (895) (Gosman et al., 2014). Two near-isogenic lines
311
(NIL) that harboured variation at the Rht (reduced height) locus in the background of variety
312
Mercia were supplied by the Genetic Resources Unit, Norwich, UK. Additional data
313
(including seasonality, Rht, presence or absence of the rye translocation 1B/1R and the
314
predicted photoperiod response) on these varieties is provided by Alison Bentley (pers.
315
Comm; Supplementary Table 1).
316
4.3 Extraction of roots from soil samples by root washing
317
RLD were carried out at ADAS, Gleadthorpe on the cores sampled in the 2012 field trial, and
318
at Rothamsted Research (RRes) on a subset of cores sampled in the 2014 field trial. RLD was
319
not measured on the 2015 soil cores. The roots were extracted from the soil cores using a
320
standard root washing system (Delta-T Devices Ltd, Burwell, Cambridge) and collected on a
321
550 μm wire mesh filter (ADAS) or 500 μm sieve (RRes). Root length was assessed using
322
WinRHIZO software (Regent Instruments Inc. Sainte Foy, Qc, Canada) (White et al., 2015).
323
Root biomass determined by soil washing were expressed as root length density (RLD),
324
expressed as the length of roots recovered per volume of soil (cm/cm3).
325
4.4 Extraction of DNA from soil samples
326
Soil samples were frozen within three hours of collection and stored at -18°C. Samples were
327
dried at 30°C in a re-circulating oven for a minimum of 72 hours. The dried soil was milled
328
using a Humboldt H4199.5F soil mill fitted with a 2 mm screen. The milled soil was
sub-329
sampled by quartering to yield a laboratory sample. DNA was extracted from two 0.25 g
330
portions of soil using a PowerSoil DNA extraction kit (MO BIO Laboratories, Inc., Carlsbad,
331
USA.) in accordance with the manufacturer’s protocols; thus technical, DNA duplicates were
332
obtained for each milled soil sample. The PowerSoil DNA extraction kit has been reliably
333
reported to achieve DNA yields from soil equivalent to methods used in a commercial testing
12
laboratory (Haling et al., 2011). While weighing the 0.25g portions of soil we noted the
335
presence of a small number of visible, but not necessarily evenly distributed, root fibres of up
336
to 5mm within the milled soil.
337
4.5 Preparation of root DNA calibration materials
338
We calibrated our RBD assay using DNA taken from lypholised roots of wheat variety Xi19
339
grown in horticultural sand and harvested at growth stage 20-23 (Zadoks et al., 1974). Root
340
material was washed free of sand, rapidly frozen on ‘dry ice’, freeze dried, milled to a
341
powder in a domestic coffee mill and stored at -18oC. DNA was extracted from 100 mg of
342
dried root using the modified Tanksely method (Fulton et al., 1995) and re-suspended in 100
343
µl Tris – EDTA, pH8.0 at 1mg/µl. DNA standards were prepared from this reference DNA as
344
a series of ten-fold dilutions, allowing calibration in a five decade range of 1000 µg/µl to 0.1
345
µg/µl. Black-grass calibration standards were prepared in the same way.
346
4.6 PCR quantification of root DNA in soil samples
347
Primers and fluorescent reporter probes were designed that targeted the wheat internal
348
transcribed spacer region within the 5.8S ribosomal RNA gene (Table 6). The target sequence
349
was acquired from NCBI Genbank AF438186.1 Triticum aestivum (Sharma et al., 2002), and
350
the primers and fluorescent reporter probes were designed using Primer3 (Untergrasser et al.,
351
2012). The primers were tested for specificity by PCR using DNA extracted from wheat,
352
barley, faba bean, maize, oilseed rape and black-grass. The PCR products were visualised on
353
a 1% agarose gel containing ethidium bromide (0.1µg ethidium bromide/ml of gel solution).
354
A black-grass target sequence was acquired from NCBI Genbank KM523760.1 (Soreng et
355
al., 2015), and primers and fluorescent reporter probes designed using Primer3 (Table 6). The
356
black-grass primers and fluorescent reporter probes were tested for specificity using DNA
357
extracted from black-grass, wheat and barley.
358
Wheat root DNA from soil extracts was quantified by real time PCR using an ABI 7900,
359
running triplicate 6 µl reactions comprising 1.0 µl template DNA, 0.5 µl primers-probe
360
solution, with primers and fluorescent reporter probes at 5 mM, 2.5 µl Thermo Fisher
361
Scientific ABsolute Blue qPCR ROX Mix and 2.0 µl water (Thermo Fisher Scientific, 2014).
362
Amplification was carried out using 10 min activation at 95°C, followed by 40 cycles of
363
15sec at 95°C and 60sec at 60°C, monitoring fluorescence at each cycle. The soil DNA
364
extracts were quantified in a series of 15 PCR batches (384 well). The quantity of wheat root
13
in each extract was calculated using SDS software (version 2.2, Applied Biosystems) with
366
reference to serial dilutions of the reference DNA standard included with every batch. Soil
367
DNA extracts were allocated to plates in plot number order, such that all technical
368
replications of all soil depth samples from a plot were allocated before including extracts
369
from the next plot. The quantity of root DNA (Root Biomass DNA – RBD) in each sample
370
was expressed as wheat root dry weight (μg) per weight of air dried soil (g), rather than
371
describing roots by reference to a quantity of DNA per unit mass of soil.
372
4.7 Data analysis
373
All qPCR data were processed using Applied Biosystems SDS 2.2, and the results collated
374
and analysed in Microsoft Excel. Analysis of variance (ANOVA) was carried out using
375
Genstat 12.1.0.3338, and correlations and regressions using R-stat (version 3.0.1). All
376
statistical analyses were carried out on original data, without prior averaging of technical
377
duplicates. As part of the data quality control process we inspected the technical DNA
378
duplicates for gross errors likely to have arisen from sampling large root fibres in one of the
379
two technical duplicates. Three measurements (out of 1056) were removed that had RBD
380
values greater than 500 µg/g, being at least ten-fold higher than their paired DNA technical
381
replicate sample.
382
Where comparisons were made between estimates of RLD and RBD, correlations were
383
calculated in R-stat. Data from the 2014 and 2015 wheat variety trials were subject to
384
analysis by REML linear mixed model implemented in Genstat using a model:
385
𝑅𝐵𝐷𝑖𝑗𝑘𝑙= µ + 𝑣𝑖+ 𝑑𝑗+ 𝑦𝑘+ 𝑣𝑑𝑖𝑗 + 𝑣𝑦𝑖𝑘+ 𝑑𝑦𝑗𝑘+ 𝑣𝑑𝑦𝑖𝑗𝑘 + 𝑟𝑗𝑘+ 𝑡𝑗𝑘𝑙+ 𝑝𝑚+ 𝑒𝑖𝑗𝑘𝑙𝑚
Where 𝐵𝑖𝑗𝑘𝑙 is The RBD of the ith variety in the jth year in the kth field replication in the lth technical replication; variety, depth and year were treated as fixed effects while field and technical replication and plate allocation were treated as random effects
When the model was amended to include additional data (a) (e.g. seasonality, Rht etc) the
386
variety term was nested within additional data.
387
𝑅𝐵𝐷𝑖𝑗𝑘𝑙 = µ + 𝑎ℎ+ 𝑎ℎ𝑣𝑖 + 𝑑𝑗 + 𝑦𝑘+ 𝑎𝑑ℎ𝑗+ 𝑎𝑦ℎ𝑘+ 𝑑𝑦𝑗𝑘+ 𝑎𝑑𝑦ℎ𝑗𝑘+ 𝑎𝑣𝑦ℎ𝑖𝑘+ 𝑎𝑣𝑑ℎ𝑖𝑗
+ 𝑎𝑣𝑑𝑦ℎ𝑖𝑗𝑘 + 𝑟𝑗𝑘+ 𝑡𝑗𝑘𝑙+ 𝑝𝑚+ 𝑒ℎ𝑖𝑗𝑘𝑙𝑚
Where 𝐵𝑖𝑗𝑘𝑙 is The RBD of the ith variety in the jth year in the kth field replication in the lth
14
effects while field and technical replication and PCR batch were treated as random effects
388
The RBD data was regressed against the root depth for each variety profile and modelled for
389
the best fit using the ‘poly’ function in R, applying linear, quadratic or cubic models, and
390
selecting the model yielding the lowest residual as the best fit. The coefficients calculated
391
from the results of these regressions were used to generate equations to predict RBD at depth.
392
Integration of these equations allowed calculation of the proportion of RBD within a defined
393
range of soil depths, which in turn allowed prediction of the soil depth containing 50% and
394
95% of all roots (D50 and D95) (Schenk and Jackson, 2005) using ‘solver’ in Microsoft Excel.
395
Estimates of variance were obtained by fitting a linear mixed model in R using the lme4
396
package (Bates et al, 2015) and the model:
397
𝑅𝐵𝐷𝑖𝑗𝑘𝑙 = µ + 𝑣𝑖 + 𝑦𝑗 + 𝑣𝑦𝑖𝑗+ 𝑟𝑗𝑘+ 𝑡𝑗𝑘𝑙 + 𝑒𝑖𝑗𝑘𝑙𝑚
Where 𝑅𝐵𝐷𝑖𝑗𝑘𝑙 is The RBD of the ith variety in the jth year in the kth field replication in the
lth technical replication
398
All effects, apart from the mean (µ) were treated as random effects. Variance components
399
associated with the random effects (variety, v; year, y; field replicate, r; technical replicate, t
400
and the error term, e) were estimated using REML as implemented in the lmer function.
401
Broad sense heritabilities were calculated using equations 1 and 2 from Piepho and Möhring
402
(2007):
403
𝐻2 = 𝑣 𝑣
(𝑣𝑣+
𝑣𝑣𝑦
2 + 𝑣𝑣𝑦𝑟
6 +
𝑣𝑣𝑦𝑟𝑡(𝑏𝑎𝑠𝑒 𝑒𝑟𝑟𝑜𝑟)
12 )
⁄
404
15
Acknowledgements
:406
We are grateful for funding from the Biotechnology and Biological Sciences Research
407
Council under grant BB/H014381/1, Agriculture and Horticulture Development Board under
408
reference AHDB RD-2008-3575: “New wheat root ideotypes for improved resource use
409
efficiency and yield performance in reduced input agriculture” and funding through the
410
strategic research programme funded by the Scottish Government’s Rural and Environment
411
Science and Analytical Services Division.
412
References
413414
Amato M, Bitella G, Rossia R, Gómezc JA, Lovelli S, Gomes JJF (2009) Multi-electrode
415
3D resistivity imaging of alfalfa root zone. European Journal of Agronomy 31:213–222
416
Bates D, Maechler M, Bolker B, Walker S (2015). Fitting Linear Mixed-Effects Models
417
Using lme4. Journal of Statistical Software, 67: 1-48.<doi:10.18637/jss.v067.i01>
418
Bayles RA, Napier BAS, Leaper D (2002). Variety as a factor in the response of winter wheat
419
to silthiopham seed treatment. Proceedings of BCPC Conference Pests and Diseases 2002,
420
515 -520
421
Bauhus J. & Messier C. (1999). Evaluation of Fine Root Length and Diameter Measurements
422
Obtained Using RHIZO Image Analysis. Agronomy Journal 91: 142-147.
423
Bengough AG, Castrignano A, Pages L, van Noordwijk M. (2000) Sampling strategies,
424
scaling, and statistics. in Root Methods: A Handbook Smit AL, Bengough AG, Engels C,
425
van Noordwijk M, Pellerin S . van de Geijn SC Editors, Springer
426
Bithell SL, Tran-Nguyen LTT, Hearnden MN, Hartley DM. (2015) DNA analysis of soil
427
extracts can be used to investigate fine root depth distribution of trees. Annals of Biology
428
Plants 7:plu091. doi:10.1093/aobpla/plu091.
429
Butnor JR, Doolittle JA . Kress L, Cohen S, Johnsen KH. (2001). Use of ground-penetrating
430
radar to study tree roots in the southeastern United States. Tree Physiology 21:1269–1278
431
Dawson LA, Mayes RW, Elston DA, Smart TS (2000) Root hydrocarbons as potential
432
markers for determining species composition. Plant Cell Environment 23:743–750
433
den Herder G, van Isterdael G, Beeckman T, De Smet I. (2010) The roots of a new green
434
revolution. Trends in Plant Science 15:600-7.
435
DEFRA (2017) Farming Statistics: Final crop areas, yields, livestock populations and
436
agricultural workforce. Published December 2017 by Farming Statistics, Department for
437
Environment, Food and Rural Affairs, London, UK.
438
Dietrich RC, Bengough AG, Jones HG, White PJ. (2013) Can root electrical capacitance be
439
used to predict root mass in soil? Annals of Botany 112: 457–464
440
Fulton T.M, Chunwongse J, and Tanksley SD. (1995) Microprep protocol for extraction of
441
DNA from tomato and other herbaceous plants. Plant Molecular Biology Reports 13: 207–
442
209.
443
George TS, Hawes C, Newton AC, McKenzie BM, Hallett PD. Valentine TA (2014). Field
444
Phenotyping and Long-Term Platforms to Characterise How Crop Genotypes Interact with
445
Soil Processes and the Environment. Agronomy 4:242-278;
446
doi:10.3390/agronomy4020242
447
Gosman N, Bentley AR, Horsnell R, Rose GA, Barber T, Howell _P, GriffithsS, Laurie DA,
448
Turner Greenland AG. (2014) HGCA Project Report 534 Delivery of Ppd1 tools novel
16
allelic effects useful to UK / EU wheat improvement.
450
http://cereals.ahdb.org.uk/publications/2014/october/20/delivery-of-ppd1-tools-novel-451
allelic-effects-useful-to-ukeu-wheat-improvement.aspx
452
Greenland AG, Bentley S, Jones H, Karley A, Lee D, Sherlock D, Valentine T, White C,
453
Young P. (2017) New wheat root ideotypes for improved resource use efficiency and yield
454
performance in reduced input agriculture. AHDB project report reference RD-2008-3575
455
Haling RE, Simpson RJ, McKay AC, Hartley D, Lambers H, Ophel-Keller K, Wiebkin S
456
Herdina, Riley IT, Richardson AE. (2011) Direct measurement of roots in soil for single
457
and mixed species using a quantitative DNA-based method. Plant and Soil 348:123–137
458
Haling RE, Simpson RJ, Culvenor RA, Lambers H, Richardson AE. (2012) Field application
459
of a DNA-based assay to the measurement of roots of perennial grasses Plant and Soil
460
358:183–199
461
Hoad SP, Russell G, Lucas ME, Bingham IJ (2001) The management of wheat, barley, and
462
oat root systems. Advances in Agronomy 74:193–246
463
Huang CY, Kuchel H, Edwards J, Hall S, Parent B, Eckermann P, Herdina, Hartley DM,
464
Langridge P, McKay AC. (2013) A DNA-based method for studying root responses to
465
drought in field-grown wheat genotypes. Scientific Reports 12;3:3194. doi:
466
10.1038/srep03194.
467
James BR, Bartlett RJ, Amadon JF. (1985) A root observation and sampling chamber
468
(rhizotron) for pot studies. Plant and Soil 85:291-293
469
Karlen, Y, McNair, A Perseguers, S, Mazza, C, Mermod, N (2007) Statistical significance of
470
quantitative PCR. BMC Bioinformatics :8: 1471-2105
http://dx.doi.org/10.1186/1471-471
2105-8-131
472
Kücke M, Schmid H, Spiess A. (1995). A comparison of four methods for measuring roots
473
of field crops in three contrasting soils. Plant and Soil 172:63-71
474
Landis: Cranfield University 2014. The Soils Guide. Available: www.landis.org.uk. Cranfield
475
University, UK. Last accessed January 2016
476
Linder CR, Moore A, Jackson RB (2000) A universal molecular method for identifying
477
underground plant parts to species Molecular Ecology 9:1549-1559
478
Lobet G, Draye X. (2013) Novel scanning procedure enabling the vectorization of entire
479
rhizotron-grown root systems. Plant Methods, 9:1 doi:10.1186/1746-4811-9-1
480
Mairhofer S, Zappala S, Tracy SR, Sturrock C, Bennett M, Mooney SJ, Pridmore T. (2012)
481
RooTrak: Automated Recovery of Three-Dimensional Plant Root Architecture in Soil
482
from X-Ray Microcomputed Tomography Images Using Visual Tracking. Plant
483
Physiology. 158:561–569
484
McDonald GK, McKay A, Huang C, Bovil B. (2017) Using root DNA to assess responses to
485
phosphorus by surface roots in wheat and barley. Plant Soil 421:505.
486
https://doi.org/10.1007/s11104-017-3468-6
487
Meinen C, Rauber R. (2015) Root discrimination of closely related crop and weed species
488
using FT MIR-ATR spectroscopy. Frontiers in Plant Science; 6: 765.
489
Mommer L, Wagemaker N, de Kroon H, Ouborg NJ (2008) Unravelling belowground plant
490
distributions: a real time PCR method for quantifying species proportions in mixed root
491
samples. Molecular Ecology Notes 8:947–953
492
Mommer L, Dumbrell AJ, Wagemaker CAM, Ouborg NJ. (2011). Below ground
DNA-493
based techniques: untangling the network of plant root interactions. Plant and Soil
494
348:115–121 DOI 10.1007/s11104-011-0962-0
495
Mooney SJ, Pridmore TP, Helliwell J, Bennett MJ. (2012) Developing X-ray Computed
496
Tomography to non-invasively image 3-D root systems architecture in soil .Plant and Soil
497
352: 1-22
498
Naylor REL. (2008) Weed Management Handbook. John Wiley & Sons
17
Paglis CM. (2013) Application of Electrical Resistivity Tomography for Detecting Root
500
Biomass in Coffee Trees. International Journal of Geophysics
501
http://dx.doi.org/10.1155/2013/383261
502
Piepho HP and Mohring J (2007) Computing Heritability and Selection Response From
503
Unbalanced Plant Breeding Trials. Genetics 177: 1881–1888
504
Pierre JS, Giblot-Ducray D, McKay AC, Hartley DM, Perroux JM, Rae AL (2018) DNA
505
based diagnostic for the quantification of sugarcane root DNA in the field. Scientific
506
Reports 8:16720 https://doi.org/10.1038/s41598-018-34844-3
507
Postic F, Beauchêne K, Gouache D and Doussan C. (2019) Scanner-Based Minirhizotrons
508
Help to Highlight Relations between Deep Roots and Yield in Various Wheat Cultivars
509
under Combined Water and Nitrogen Deficit Conditions. Agronomy 9:297;
510
doi:10.3390/agronomy9060297
511
Riley IT, Wiebkin S, Hartley D, McKay AC (2010) Quantification of roots and seeds in soil
512
with real-time PCR. Plant and Soil 331:151-163
513
Rosolem CA, Ritz K, Cantarella H, Hawkesford MJ, Whalley WR and Mooney SJ. (2017)
514
Enhanced Plant Rooting and Crop System Management for Improved N Use Efficiency.
515
in: Sparks, D. L. (ed.) Advances in Agronomy Vol.146 Academic Press Inc Elsevier
516
Science.
517
Sharma SK, Rustgi SK, Balyan HS Gupta,PK. (2002) Intraspecific sequence variation in the
518
internal transcribed spacer (ITS) region of ribosomal DNA in common wheat and wild
519
barley. Barley Genetics Newletter 32:38-45
520
Schenk HJ, Jackson RB (2005) Mapping the global distribution of deep roots in relation to
521
climate and soil characteristics. Geoderma 126:129–140
522
Sierra CA, Del Valle JI, Orrego SA (2003) Accounting for Fine Root Mass Sample Losses in
523
the Washing Process: A Case Study from a Tropical Montane Forest of Colombia. Journal
524
of Tropical Ecology 19:599-601
525
Soreng RJ, Gillespie LJ, Koba H, Boudko K, Bull RD (2015) Molecular and morphological
526
evidence for a new grass genus, Dupontiopsis (Poaceae tribe Poeae subtribe Poinae s.l.),
527
endemic to alpine Japan, and implications for the reticulate origin of Dupontia and
528
Arctophila within Poinae s.l Journal of Systematic Evolution 53: 138-162
529
Thermo Fisher Scientific (2014) Product Information, Thermo Scientific ABsolute Blue
530
qPCR ROX Mix
531
Thivierge M-N, Angers D, Chantigny MH, Seguin P, Vanasse A. (2015) Root Traits and
532
Carbon Input in Field-Grown Sweet Pearl Millet, Sweet Sorghum, and Grain Corn.
533
Agronomy Journal 108:459-471
534
Untergrasser A, Cutcutache I, Koressaar T, Ye J, Faircloth BC, Remm M, Rozen SG (2012)
535
Primer3 - new capabilities and interfaces. Nucleic Acids Research 40:e115
536
Wasayah A, Zhang X, Fang Q, Yan Z. (2018) Root Phenotyping for Drought Tolerance: A
537
Review Agronomy 8:241; doi:10.3390/agronomy8110241
538
Wasson AP, Rebetzke GJ, Kirkegaard JA, Christopher J, Richards RA, Watt M. (2014) Soil
539
coring at multiple field environments can directly quantify variation in deep root traits to
540
select wheat genotypes for breeding. Journal of Experimental Botany 65: 6231–6249
541
doi:10.1093/jxb/eru250
542
Watt M, Moosavi S, Cunningham SC, Kirkegaard JA, Rebetzke GJ, Richards RA. (2013) A
543
rapid, controlled-environment seedling root screen for wheat correlates well with rooting
544
depths at vegetative, but not reproductive, stages at two field sites. Annals of Botany 112:
545
447–455
546
Whalley WR, Binley A, Watts CW, Shanahan P, Dodd IC, Ober ES, Ashton RW, Webster
547
CP, White RP and Hawkesford MJ. (2017) Methods to estimate changes in soil water for
548
phenotyping root activity in the field. Plant and Soil 415:407-422.
18
White CA, Sylvester-Bradley R, Berry PM (2015) Root length densities of UK wheat and
550
oilseed rape crops with implications for water capture and yield. Journal of Experimental
551
Botany. 66:2293-303 doi: 10.1093/jxb/erv077
552
Xu Z, Valdes C, Clarke J. (2018) Existing and Potential Statistical and Computational
553
Approaches for the Analysis of 3D CT Images of Plant Roots. Agronomy 8:71;
554
doi:10.3390/agronomy8050071
555
Zadoks JC, Chang TT, Konzak CF (1974) EUCARPIA Bulletin No. 7. European Association
556
for Research on Plant Breeding, EUCARPIA Secretariat, Agricultural Research Institute
557
of the Hungarian Academy of Sciences, 2462 Martonvásár, Brunszvik u. 2., Hungary
558
Zhang C, Postma JA, York LM, Lynch JP. (2014). Root foraging elicits niche
559
complementarity-dependent yield advantage in the ancient "three sisters" (maize / bean /
560
squash) polyculture. Annals of Botany, 114, 1719-1733. doi:10.1093/aob/mcu191
561
Zhang T, Fan B, Wang P (2018) Barnyardgrass Root Recognition Behaviour for Rice
562
Allelopathy. Agronomy 8:39; doi:10.3390/agronomy8040039
563
Zhu J, Ingram PA, Benfey PN, Elich T. (2011) From lab to field, new approaches to
564
phenotyping root system architecture. Current Opinion in Plant Biology 14:310–317
19 Table 1: DNA-based (RBD; µg dry roots / g air dried soil) and root washing assays (RLD: 567
cm/cm3) for wheat varieties in 2012 and 2014 field trials. (Pearson’s correlation between 568
RBD and RLD for all varieties is 0.702 (df = 34, p-value = <0.001)) 569
Trial Rep Depth Variety RBD RLD
Te rr in gto n 2012 Pil o t e xp eri me n t
A 0-250 Alchemy 41.2 3.2 A 250-500 Alchemy 8.4 2.1 A 500-750 Alchemy 5.3 1.4 A 750-1000 Alchemy 0.2 0.6 A 0-250 Oakley 9.1 3.0 A 250-500 Oakley 6.1 1.7 A 500-750 Oakley 1.2 0.9 A 750-1000 Oakley 9.1 0.6 A 0-250 Viscount 40.8 3.2 A 250-500 Viscount 13.2 1.8 A 500-750 Viscount 6.1 1.1 A 750-1000 Viscount 0.9 1.0
Te rr in gto n 2014
A 0-250 Glasgow 62.8 6.5 A 250-500 Glasgow 27.4 3.4 A 500-750 Glasgow 7.1 1.1 A 750-1000 Glasgow 2.1 1.1 B 0-250 Glasgow 7.7 4.5 B 250-500 Glasgow 4.6 2.6 B 500-750 Glasgow 3.1 1.3 B 750-1000 Glasgow 5.8 0.8 C 0-250 Glasgow 12.0 4.9 C 250-500 Glasgow 10.4 3.1 C 500-750 Glasgow 2.6 1.6 C 750-1000 Glasgow 2.7 0.8 A 0-250 Oakley 49.4 5.5 A 250-500 Oakley 12.4 2.1 A 500-750 Oakley 26.8 0.9 A 750-1000 Oakley 34.5 0.4 B 0-250 Oakley 54.5 5.9 B 250-500 Oakley 5.6 2.6 B 500-750 Oakley 2.7 1.5 B 750-1000 Oakley 9.4 0.7 C 0-250 Oakley 79.0 5.4 C 250-500 Oakley 52.5 2.5 C 500-750 Oakley 13.2 1.2 C 750-1000 Oakley 1.4 0.5 570
Table 2: Effects of experimental terms on RBD (µg dry roots / g air dried soil) among 22 wheat varieties over two trial
571
years, shown by linear mixed model analysis implemented in REML (d.f. = degress of freedom, F pr, F-statistic
572
probability)
573
Fixed term Wald statistic d.f. F statistic F pr
20
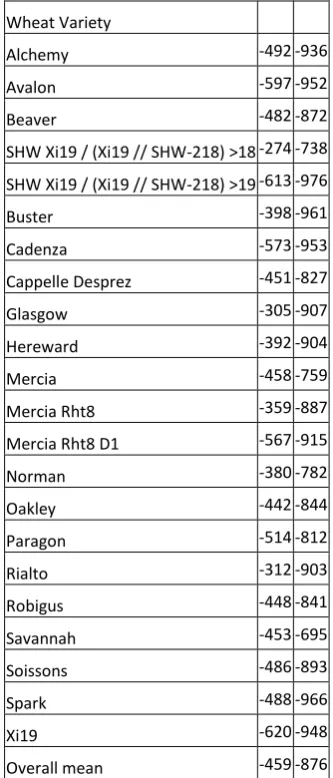
Table 3: Estimates of the soil depths (mm) containing 50% and 95% of all roots (D50 and D95) for each variety. (A table of
575
D50 and D95 for each year is given in Supplementary Table 4)
576
Depth (mm) D50 D95
Wheat Variety
Alchemy -492 -936
Avalon -597 -952
Beaver -482 -872
SHW Xi19 / (Xi19 // SHW-218) >18 -274 -738
SHW Xi19 / (Xi19 // SHW-218) >19 -613 -976
Buster -398 -961
Cadenza -573 -953
Cappelle Desprez -451 -827
Glasgow -305 -907
Hereward -392 -904
Mercia -458 -759
Mercia Rht8 -359 -887
Mercia Rht8 D1 -567 -915
Norman -380 -782
Oakley -442 -844
Paragon -514 -812
Rialto -312 -903
Robigus -448 -841
Savannah -453 -695
Soissons -486 -893
Spark -488 -966
Xi19 -620 -948
Overall mean -459 -876 577
21
Table 4: The biomass of wheat and black-grass roots measured at four different depths in the soil profile using the
DNA-579
based assay (RDB), sampled from three black-grass population densities
580
Black-grass population Depth Black-grass Wheat
(mm) µg/ g soil µg/ g soil
Low black-grass infestation 0 heads per m2
0-250 0.0 98.9 250-500 0.0 77.9 500-750 0.0 69.3
750-1000 0.0 21.8
Medium black-grass infestation 50 heads per m2
0-250 2.5 32.5 250-500 0.1 16.5 500-750 0.0 49.9
750-1000 0.0 21.5
High black-grass infestation 300 heads per m2
0-250 18.2 42.7 250-500 1.9 8.9 500-750 2.1 3.8
750-1000 2.4 4.8 581
582
Table 5: Wheat field trials sampled for root quantification
583
Site Year Trial design Grid reference Soil series Soil texture
Terrington St Clement, Norfolk (Pilot expt.)
2012 Three varieties in one field replication
TF 496 226 Wisbech Coarse Silt
Burkees Field, Eastland Bank, Walpole St Andrew, Norfolk
2014 Eighteen varieties and four breeders’ lines in three field replications
TF 500 184 Blacktoft Silty Clay loam
Willow Tree Field, Burman Farm, Terrington St Clement, Norfolk
2015 Eighteen varieties and four breeders’ lines in three field replications
TF 537 239 Wisbech Silt loam / sandy silt loam
584
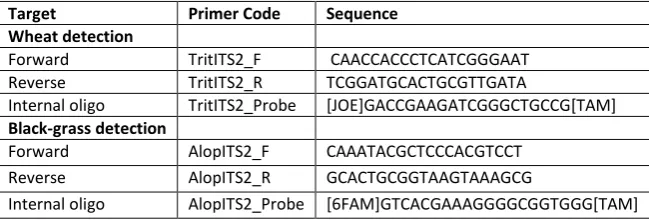
Table 6: Primers and fluorescent reporter probe designed for wheat and black-grass semi-quantitative PCR assay
585
Target Primer Code Sequence
Wheat detection
Forward TritITS2_F CAACCACCCTCATCGGGAAT Reverse TritITS2_R TCGGATGCACTGCGTTGATA
Internal oligo TritITS2_Probe [JOE]GACCGAAGATCGGGCTGCCG[TAM]
Black-grass detection
Forward AlopITS2_F CAAATACGCTCCCACGTCCT Reverse AlopITS2_R GCACTGCGGTAAGTAAAGCG
Internal oligo AlopITS2_Probe [6FAM]GTCACGAAAGGGGCGGTGGG[TAM] 586
22 588
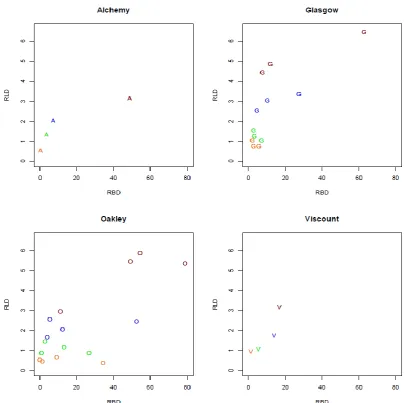
Figure 1: Correlations between root washing (RLD) and DNA based assay (RBD) showing
589
varieties as letters and depths by colours. Depth represented in order dark red (0 – 250) > 590
blue (250 – 500) > green (500 – 750) >orange (750 – 1000). 591
23 593
24 595
25 597
598
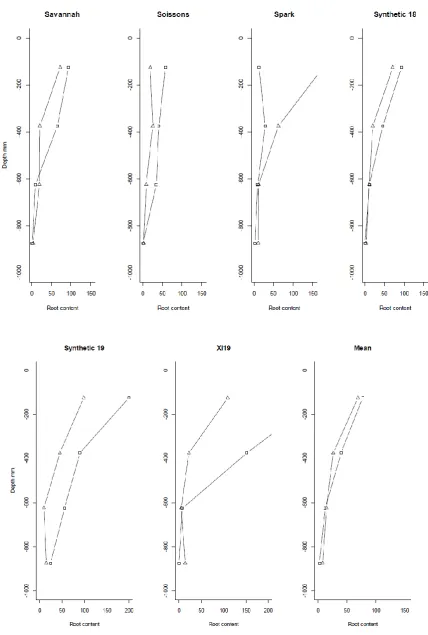
Figure 2: The distribution of root biomass (μg /g roots in dry soil) for varieties by depth in 599
26 SHW-218) >18, ‘Synthetic 19’ = SHW Xi19 / (Xi19 // SHW-218) >19 (A table of means for 601