† Corresponding author
DOI: 10.18488/journal.2/2015.5.11/2.11.499.512 ISSN(e): 2223-1331/ISSN(p): 2226-5724 © 2015 AESS Publications. All Rights Reserved.
499
LOAD SETTLEMENT BEHAVIOUR OF SANDY SOIL BLENDED WITH
COARSE AGGREGATE
Kesharwani R.S.1† --- Sahu A. K.2 --- Khan N.U.3
1,3
Department of Civil Engineering, Jamia Milia Islamia, New Delhi India 2Department of Civil Engineering, Delhi Technological University, Delhi, India
ABSTRACT
The structures of every kind rest on the soil under laying them. The stability of these structures
depends upon the load carrying capacity of the soil. The bearing capacity of soil also depends
upon the quantum of coarser particles presents in it. The plate load test is used for the design of
footing. Therefore, in the present investigation, the plate load tests were conducted to study the
sand blended with coarse aggregate of various sizes and proportions. To strengthen the sub soil
strata, coarse aggregates of 10mm and 20mm sizes were mixed in the sand in various proportions.
The soil samples were prepared and tested first without mixing coarse aggregates, then by mixing
coarse aggregates in varying percentages by weight starting from 5% to 30%. The plate load tests
were conducted on 100mm, 150mm and 200mm diameters mild steel plates which indicates that
with the increase in the size of the bearing plate, the bearing capacity of soil decreases (for plate
settlement of 25 mm )and there is reduction in the footing settlement with the percentage increase
of coarse aggregate. The improvement in the bearing capacity is represented by bearing capacity
improvement factor (BCIF).The BCIF of 328 & 247; 307 & 293 and 174 & 185 were achieved with
the inclusion of 10mm and 20mm coarse aggregates respectively for the said plate sizes.
© 2015 AESS Publications. All Rights Reserved.
Keywords:
Sand, Coarse aggregate, Plate load test, Bearing capacity improvement factor (BCIF), Settlement reduction factor (SRF), Blending, Plate sizes.Contribution/ Originality
In the plate load tests, the sand is blended with different sizes and proportions of aggregates to
simulate the conditions of Himalayan rivers basin. The test data is to be analyzed to determine the
optimal sizes of plates to be used for maximum aggregate size present in the sand mass.
Journal of Asian Scientific Research
ISSN(e): 2223-1331/ISSN(p): 2226-5724
© 2015 AESS Publications. All Rights Reserved.
500
1. INTRODUCTION
The structure of all types i.e. buildings/bridges/highways etc. rest directly on the soil beneath
them. The safety of these structures depends upon the strength/bearing capacity of the soil over
which these are constructed. Therefore, a proper analysis of the soil properties and the design of
their foundations become necessary to ensure that these structures remain stable and are safe
against collapse or unequal settlements.
In the upper region of Himalayan rivers, the large size pebbles exist in the soil. The particle
sizes of the soil reduces when the river flows in the downstream. This happens due to mechanical
weathering of the soil .However, in the upper reach of the river basin, the bearing capacity of the
soil may vary due to variation of particle sizes. Therefore, in the present study, plate load tests were
performed on the sand blended with coarse aggregates of 20 mm and 10 mm sizes in various
proportions. Bearing capacity is a parameter, evaluated by conducting plate load test for
determining the suitability of any soil type for the use as bearing material. It is generally
determined in case of structure for which either spread or isolated footing is proposed. The soil
should have a bearing capacity greater than the load of the structure to which it is subjected so that
the soil should not fail in shear and the settlement should remain within the permissible limits. The
dimensions of the proposed footing also depend upon the bearing capacity of the soil. It will be
large in cases the soils have low value of bearing capacity. The size of footing reduces considerably
if the soils have a high value of bearing capacity. To enhance the strength of foundation soil,
several techniques like compaction, mechanical/electrical/thermal stabilization, addition of
geo-textile, geo-synthetic, fly ash or randomly distributed discrete fibers are used.
To simulate the existing condition of the soil in the upper region of Himalayan river, the sand
blended with coarse aggregates of various sizes and in different proportions is prepared. The coarse
aggregates are the rock fragments usually restricted to round or sub rounded particles
The main aim of the present study is to enhance the strength/bearing capacity of the soil upon
which different types of structures rests. With the addition of 10mm and 20mm sized coarse
aggregates. If the bearing capacity of the foundation soil is comparatively lower then a massive
foundation is required to be provided for the stability of the structures constructed over it which
proves to be uneconomical. The review of literature was carried out for the improvement in bearing
capacity of the sub soil system by various technique.
Som and Sahu [1] evaluated the effect of deformation on the improvement of reinforced sand
bed using nonwoven and woven type of geo-textile at the compacted fill, artificially consolidated
keolinite bed interface and concluded that there is practically no improvement in load carrying
capacity with the inclusion of geo-textile till 10mm settlement beyond which the rate of
deformation for unreinforced bed is much higher than the reinforced one. Consoli, et al. [2]
proposed a method of interpretation which involves a comparison of measured load test response
with the numerically derived curves for shallow foundations on cemented soils. To determine the
effects of footing size and shape on the settlement and the bearing capacity of vertically loaded
shallow foundations resting on an uniform layers of lightly cemented residual soil with basalt, a
© 2015 AESS Publications. All Rights Reserved.
501 circular steel plates of diameters 0.3m to 0.6m and square concrete footing of 0.4m to 1.0m. For a
homogeneous soil, the effect of size of the loaded area on the measured settlement and bearing
capacity was shown as negligible. For the initial stages of loading the circular and the square
footings exhibits similar behavior, but for larger strains near the ultimate bearing capacity, small
differences were observed.
Alawaji [3] investigated the potential benefits of geogrid reinforced sand over collapsible soil
to control wetting induced collapse settlement by conducting load tests using a circular aluminum
plate and Tenser SS2 geogrid. The parameters viz. width and depth of the geogrid were varied and
concluded that there is significant increase in the load carrying capacity and decrease in the wetting
induced collapse settlement of sand pad over the weak and collapsible soil with a recommended
depth of reinforcing geogrid as 10% of the diameter of the loaded area and the recommended width
as the greater than or equal to four times the diameter of the loaded area. To improve the strength
of low shear strength and highly compressible kaolin soil, Chakrabarti, et al. [4] added jute textile.
The biodegraded jute was cut into pieces having thickness 1.25mm and was placed over the soft
bed of kaolin soil consolidated to 1KN/m3. The results showed that the load carrying capacity of
kaolin bed with biodegraded jute textile improved by 25% thereby causing considerable reduction
in the pavement thickness. To improve the strength of the silty soil, Shukla [5] used bamboo sheets.
Unconfined compression tests were carried out on unreinforced and reinforced soil samples
prepared at maximum dry density corresponding to optimum moisture content. Based upon the data
obtained, it was concluded that the strength of the soil sample increases with the increase in the
number of reinforcing bamboo sheets when placed in horizontal position. The strength of soil
decreases even less than the unreinforced case, if the reinforcing bamboo sheets were placed in
inclined position, i.e.30o to 45o to the horizontal. Trivedi and Sud [6] conducted plate load tests on
the two types of ashes compacted at varying degree of compactness to evaluate their settlement
characteristics. A relationship between the settlement and the foundation size has been proposed at
varying compactions to obtain settlement of the compacted ash.
Teodoru and Toma [7] has performed plate load test on the soil to study the size effect on
settlements and desired values of geotechnical parameters. It is revealed that the subgrade reaction
co-efficient is strictly dependent on parameter like size of the loaded area and loading magnitude
and thus completely general and generic and not a fundamental material property of soil that can
somehow be determined rationally.
Mohite and Admane [8] has proposed a test similar to plate load test and compared the results
obtained. The laboratory plate load test on undisturbed soil samples in the model box is carried out.
The SPT was also performed in the box and results so obtained were compared with field results.
He concluded that the results of field tests and model test in laboratory were comparable.
A review of the literature reveals that most of the work has been done using either fly
ash/geotextile/lime or rice husk ash as a reinforcing material to enhance the strength/bearing
capacity of the soil and vary few or none studies have been carried out using coarse aggregates as a
reinforcing material in the soil to enhance its properties. Hence study is needed to evaluate addition
© 2015 AESS Publications. All Rights Reserved.
502 procuring of other reinforcing materials proves to be uneconomical. Therefore, it is needed to study
the effects of coarse aggregates on the strength of soil.
2. MATERIALS & METHODOLOGY USED
2.1. Sandy Soil
The sandy soil used in the study is procured from river basin. The geotechnical properties of
soil are determined as per IS codes (9,10,11,12,13&14) and summarized in Table-1. The particle
size distribution curve is shown in Fig.-1.
Table-1. GeotechnicalProperties of Soil.
Particulars Values
Natural Moisture Content 4.26%
Bulk Density (KN/m3) 17.2
Specific Gravity 2.65
Uniformity Coefficient (Cu) 2
Coefficient of Curvature (Cc) 1.14
Maximum Dry Density (MDD) (KN/m3) 17.7
Optimum Moisture Content (OMC) 9.41%
Cohesion 0.0
Angle of internal friction 320
Classification of soil SP
Source: Experimental Result as per IS codes
2.2. Coarse Aggregates
The coarse aggregates obtained in the study are the same as used for making plain cement
concrete. The different physical properties of the coarse aggregates were determined as per IS
codes(16,17,18&20) and summarized in Table-2.
© 2015 AESS Publications. All Rights Reserved.
503 Table-2. Physical Properties of Coarse aggregates.
Particulars Values
Aggregate Crushing Value (ACV) 11.21%
Aggregate Impact Value (AIV) 9.86%
Specific Gravity (G) 2.64
Water Absorption 2.36%
Fineness Modulus 7.36
(Source: Experimental Result)
2.3. Water
The, water used for mixing during the preparation of the samples is taken as available in the
laboratory which is an ordinary tap water. The various physical properties of water used are
determined as per IS codes (19) and given in Table-3.
3. EXPERIMENTAL INVESTIGATIONS
3.1. Introduction
The bulk quantity of sand and aggregates of 20 mm & 10 mm nominal sizes are procured in
the laboratory and stored properly. The collected sample of sand and coarse aggregate were
characterized in the laboratory. The tests were carried out to determine the physical and chemical
properties of the material. The Proctor compaction test was performed on the sand to determine the
optimum moisture content and maximum dry density of the sand .The coarse aggregate of the 20
mm & 10 mm sizes in various proportions (5% to 30% by weight) is mixed with the sand and the
plate load tests of each mixes were determined under optimum moisture condition.
Table-3. Physical and Chemical Properties of Water.
Particulars Values
pH value 6.87
Dissolved Solids 32.00 mg/l
Suspended Solids 144.00 mg/l
Sulphates 86.00 mg/l
Chlorides 128.00 mg/l
Turbidity * 3.50 NTU
Alkalinity 25.00 mg/l
Hardness 74.00 mg/l
(Source: Experimental Result)
3.2. Details of Test Conducted
The details of experimental programs are summarized in Table-4. The tests were performed
© 2015 AESS Publications. All Rights Reserved.
504 Table-4. Experimental Program me
Material Details Of The Experiments
Sandy Soil Natural Moisture Contents ,.Bulk Density, Specific Gravity,
Grain size distribution and Compaction Characteristics,
Aggregates Aggregate Crushing Value, Aggregate Impact Values, Specific
Gravity , Water Absorption and Fineness Modulus
Water pH, Dissolved Solids, Suspended Solids, Sulphates, Chloride,
Turbidity, Alkalinity and Hardness
Sand mix with aggregates Plate Load Tests as per IS code(15)
(Source: Experimental Programme)
3.3. Plate Load Test
In order to evaluate the load settlement behavior, model load tests were conducted in a
Rectangular tank having internal sizes as 1.50 mX1.5m X0.75m consisting of mild steel plates
havingthickness25.4 mm. The size of the tank is selected keeping in view the sizes of the test plates
such that the size of the test tank should be at least five times the size of the largest test plate. Three
sizes viz. 100mm, 150mm, 200mm of model test footing have been used.
The size of the smallest plate is so selected such that it should be larger than four times the size
of the largest soil particle. The load is applied through a manually operated hydraulic jack of
500KN capacity supported against a load reaction truss. The applied load was recorded using a
pressure gauge mounted on the hydraulic jack. The settlement of the model test footing was
observed using dial gauges mounted against the reference beams.
Fig-2.Experimental Setup for Plate Load Test. (Source: IS code (15)
3.4. Results and Discussion
3.4.1. Geotechnical Properties of Soil
The particle size distribution curve obtained by plotting the result of sieve analysis indicates
that the soil contains nearly 96.40% particles passing through 4.75 mm IS sieve and coarser than 75
© 2015 AESS Publications. All Rights Reserved.
505 coefficient is 2.1 and the coefficient of curvature is 1.18, therefore the soil is designated as S.P. (i.e.
the poorly graded sand). The moisture content-dry density curve revealed that due to addition of
water the dry density increases uniformly to a maximum value of 17.70 KN/m3 at 9.41% moisture
content thereafter the curve shows a declining behavior. On the basis of the results obtained from
direct shear test, the angle of internal friction is 32o which shows that there is better mobilization of
shear strength through interlocking of soil particles and the soil will fail by local shear failure.
Since the value of cohesion is zero, the shear strength in the soil will result from the inter granular
friction alone. The geotechnical properties of the soil under investigation are presented in Table – 1
3.4.2. Physical Properties of Coarse Aggregates
The results of sieve analysis of coarse aggregates indicate that about 60% of coarse aggregates
passes through 20mm IS sieve and the fineness modulus of these is 7.36. Therefore, average
particle size of the coarse aggregates is 10 mm. Aggregates having impact value 9.86% and
crushing value as 9.21 % shows that the coarse aggregates collected can withstand relatively larger
heavy loads. The physical properties of coarse aggregates are shown in Table – 2.
3.4.3. Physical& Chemical Properties of Water
The pH value of the water obtained is 7.24 which is greater than 7, therefore, it is alkaline. The
presence of sulphate in water affects the durability and strength of mix and chlorides produces
efflorescence. The tests on water indicate that the sulphate content in water is 86 mg per liter and
chlorides 128.00 mg per liter, which are in acceptable limits. Table – 3 shows the properties of
water being used in the study. These properties of water show that the water is potable and is fit for
drinking purposes and hence can be used for the present experimentation.
3.4.4. Plate Load Test Results
The plate load tests have been carried out on the soil samples, at OMC, first without adding
coarse aggregates in it and then by adding coarse aggregates in varying percentages ranging from
0% to 30% by weight of the dry soil at a constant optimum moisture content of 9.41%. The results
obtained are presented in graphical form.
3.4.5. Pressure Settlement Behavior
In all, 42 Nos tests has been performed under optimum moisture condition (O.M.C.)on
© 2015 AESS Publications. All Rights Reserved.
506 Fig–3. Pressure Settlement curve for 100 mm plate with various percentages of 10 mm coarse
aggregates mixed by Weight. (Source: Experimental Result)
Fig–4. Pressure Settlement curve for 150 mm plate with various percentages of 10 mm coarse aggregates mixed by Weight.
(Source: Experimental Result)
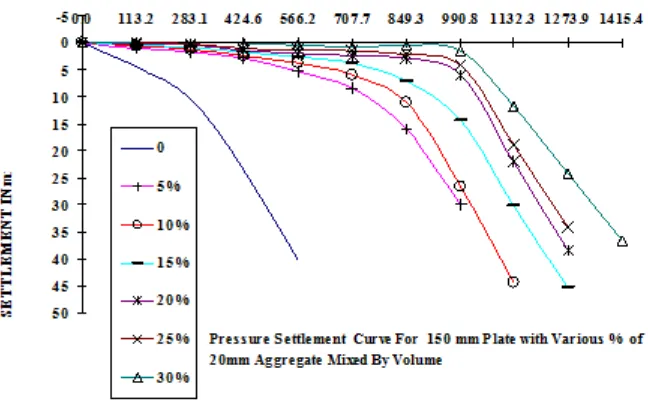
The circular plates of diameters 100 mm, 150 mm & 200 mm have been used as modeled
footings. On the basis of the results obtained from the experimental work, the pressure settlement
curves have been plotted as shown in the Fig. 3 to Fig. 8. The pressure settlements trends of the
sand bed blended with or without coarse aggregates are similar. With the increases in the applied
pressure the rate of deformation in the sand bed without coarse aggregates is much higher in
comparison with the sand bed with coarse aggregates. At higher applied pressures the sand bed
© 2015 AESS Publications. All Rights Reserved.
507 aggregates. This improvement in the performance is due to the increased stiffness and the shearing
resistance of the sand bed with the inclusion of the coarse aggregates.
Fig–5. Pressure Settlement curve for 200 mm plate with various percentages of 10 mm coarse aggregates mixed by Weight.
(Source: Experimental Result)
Fig–6. Pressure Settlement curve for 100 mm plate with various percentages of 20 mm coarse aggregates mixed by Weight.
(Source: Experimental Result)
3.4.6. Settlement of Modeled Footing
It is observed that inclusion of coarse aggregates improves the performance of the soil bed.
Therefore, reinforcement in the form of coarse aggregates is provided to control settlement and for
higher allowable bearing pressure. Fig. 3 to 8 shows that the settlement decreases with the increase
in the coarse aggregate percentage. The settlement reduction factor (SRF) is defined as the
percentage reduction in settlement of the sand bed with coarse aggregates relative to the settlement
© 2015 AESS Publications. All Rights Reserved.
508 Fig–7. Pressure Settlement curve for 150 mm plate with various percentages of 20 mm coarse
aggregates mixed by Weight. (Source: Experimental Result)
Fig–8. Pressure Settlement curve for 200 mm plate with various percentages of 20 mm coarse aggregates mixed by Weight.
(Source: Experimental Result)
Fig. 9 shows the variation of SRF, evaluated under the corresponding failure bearing pressures,
with various coarse aggregate percentages. It is observed that about 100% SRF is achieved at 30%
inclusion of coarse aggregates. It is further observed that the increase in settlement reduction factor
is greater with 20mm size of coarse aggregates than that of 10mm coarse aggregates. For 200mm,
150mm and 100mm size plates it is 97, 99 and 91 for 20mm coarse aggregates compared to 93, 96
© 2015 AESS Publications. All Rights Reserved.
509 3.4.7. Bearing Capacity
As the bearing capacity is controlled by the settlement for a particular sand bed, therefore, to
control settlement coarse aggregates are mixed. For comparison the bearing capacity is calculated
in this study as the pressure corresponding to the failure settlement of 25mm of the modeled
footing.
The bearing capacity improvement factor (BCIF) is defined as the ratio of the bearing pressure
of sand bed with coarse aggregates to the bearing pressure of sand bed without coarse aggregates
evaluated at a constant bearing pressure corresponding to the failure settlement of 25mm of the
modeled footing. Fig.-10 shows the bearing pressure at failure, settlement of 25 mm for various
percentages of the coarse aggregates mixes. It is observed that the bearing pressure increases with
the increase in the plate diameter and no maximum value is attained over the range of coarse
aggregate percentages used. Fig.-11 shows the variation of BCIF.
Fig–9. Variation of Settlement Reduction Factor with Coarse aggregate Percentage. (Source: Experimental Result)
It is concluded that the improvement is almost equal for 10mm as well as 20mm size coarse
aggregates mixed though it is greater for 20 mm coarse aggregates in comparison to 10mm coarse
aggregates. It is further observed that the improvement for 150mm dia plate is largest and for
200mm plate it is least in both the cases. Bearing capacity improvement factor is 293 & 307 for
150mm plate while it is 174 &185 for 200 mm plate at 10mm and 20mm coarse aggregates
respectively . Fig.-10 shows the variation of bearing capacity improvement factor with the varying
percent of coarse aggregate. From this it is observed that the improvement in bearing capacity is
more at higher percentage of coarse aggregate mix than at smaller ones and the gain is highest
© 2015 AESS Publications. All Rights Reserved.
510 3.4.8. Reinforcement Mechanism
Reinforcement mechanism is derived mainly through the friction between the particles of sand
and the coarse aggregates. When the sand bed is compacted, while mixed with coarse aggregates, a
bond action of sand particles with the rough surfaces of coarse aggregates takes place. This enables
the coarse aggregates to resist shear stresses from the loaded modeled footings, thereby mobilizing
the maximum bearing capacity of the subsoil. On the other hand this bond creates a flexural stiff
platform which distributes the vertical pressure evenly, thereby reducing the settlement. This bond
between the particles of sand and coarse aggregates also prevents lateral and vertical displacements
near the edges of plate.
Fig–10. Variation of Bearing Capacity with varying % of Coarse aggregate Mix. (Source: Experimental Result)
Fig-11. Variation of Bearing Capacity Improvement Factor with Coarse aggregate Percentage. (Source: Experimental Result)
4. CONCLUSION
On the basis of the experimental results obtained by plate load tests carried out on sand bed
© 2015 AESS Publications. All Rights Reserved.
511
With the increase of coarse aggregate percentage, the problem of workability was experienced
during the experimentation because the coarse aggregates replaces the soil mass with their
increase in volume.
Settlement decreases with the increase in coarse aggregate percentages.
Settlement reduction factor is greater for sand bed blended with 20mm coarse aggregates in comparison to 10mm coarse aggregates.
With 30% blending of coarse aggregate in the sand bed, reduction in settlement very close to
100% is achieved.
Bearing pressure decreases with the increase in the size of the modeled footing.
The bearing capacity improvement factor (BCIF) is greater for small modeled footings than for
larger ones. Improvement of 307 & 293 is achieved with 150mm dia. plates while with 200mm
dia. plates it is 174 & 185.
Improvement in bearing pressure is greater with 20mm coarse aggregate size than with 10mm
coarse aggregate size. BCIF of 174, 307 & 328 is achieved with 200mm, 150mm & 100mm
plates when 20mm coarse aggregates were mixed with sand bed while these are 185, 293 &
247 when 10mm coarse aggregates were mixed.
Since the geotechnical properties of sand and the physical properties of coarse aggregates influence the bearing capacity of the sand bed, therefore, the application of this study can be
exercised by estimating the percentage of coarse aggregates in sand during geotechnical
Investigation.
REFERENCES
[1] N. Som and R. B. Sahu, "Formation behavior of geotextile reinforced unpaved road," Journal of Indian Geotechnical Conference, vol. 5, pp. 283-286, 1997.
[2] N. C. Consoli, F. Schnaid, and J. Milititsky, "Interpretation of plate load test on residual soil site,"
Journal of Geotechnical and Geoenvironmental Engineering, ASCE, vol. 124, pp. 0857-0867, 1998. [3] H. A. Alawaji, "Settlement and bearing capacity of geogrid reinforced sand over collapsible soil,"
Journal of Geotextiles and Geomembranes, Elsevier, Science Direct, vol. 19, pp. 75-88, 2001. [4] S. Chakrabarti, G. Bhansari, and A. Datta, "Biodegradation effects of jute geotextile as soil
reinforcement for improvement of load-settlement characteristics," in Proceedings of the Indian Geotechnical Conference, Allahabad, 2002, pp. 189-190.
[5] S. K. Shukla, "Strength of the bamboo-reinforcement Itanagar silty sand," in Proceedings of the Indian Geotechnical Conference, Allahabad, 2002, pp. 191-193.
[6] A. Trivedi and V. K. Sud, "Settlement of compacted ash fill geotech geol engineering," Springer Science + Business Media B.V, vol. 25, pp. 163-176, 2007.
[7] I.-B. Teodoru and I. O. Toma, "Buletinul Institutului Politehnic Din Ias¸ I Publicat De Universitatea Tehnic˘a,Gheorghe Asachi," Din Ias¸iTomul LV (LIX), Fasc. 1, 2009,Sect¸ia Construct¸ Ii. Arhitectur˘A, 2009.
© 2015 AESS Publications. All Rights Reserved.
512
BIBLIOGRAPHY
[1] IS: 2720 (Part 2), "Determination of water content," 1973.
[2] IS: 2720 (Part III/ Sec 1), "Reaffirmed 2002, methods of test for soils: Part-3, determination of specific gravity, fine grained soils, Bureau of Indian Standards," 1980.
[3] IS: 2720(Part 4), "Reaffirmed 2006, methods of test for soils: Part-2, determination of grain size analysis, Bureau of Indian Standards," 1985.
[4] IS: 2720 (Part VII), "Reaffirmed 2003, methods of test for soils: Part-7, determination of water content dry density relation using light compaction, Bureau of Indian Standards," 1980.
[5] IS: 2720 (Part 13), "Direct shear test," 1986.
[6] IS: 1498, "Classification and identification of soils for general engineering purposes," 1970. [7] IS 1888, "Method of load test on soils," 1982.
[8] IS: 2386 (Part I), "Reaffirmed 1997, methods of testing for aggregates for concrete: Particle size & shape, Bureau of Indian Standards," 1963.
[9] IS: 2386 (Part III), "Reaffirmed 1997, methods of testing for aggregates for concrete: Specific gravity, density, voids ratio, absorption & bulking, Bureau of Indian Standards," 1963.
[10] IS: 2386 (Part IV), "Reaffirmed 1997, methods of testing for aggregates for concrete: Mechanical properties, Bureau of Indian Standards," 1963.
[11] IS: 3025, "Reaffirmed 2002, methods of sampling and test (Physical and Chemical) for water and waste water, Bureau of Indian Standards," 1984.
[12] IS:383, "Coarse and fine aggregates from natural sources for concrete. Bureau of Indian Standards," 1970.