Expected Performance of Tracking in CMS at the HL-LHC
EricaBrondolin1,aon behalf of the CMS Collaboration
1Institut fur Hochenergiephysik der ÖAW (AT), Vienna, Austria
Abstract. During the Long Shutdown 3, scheduled from 2024 to mid 2026, CERN is planning an upgrade program in preparation of the High-Luminosity LHC (HL-LHC), which will bring the luminosity up to 5×1034cm−2s−1, almost five times the one
en-visaged for 2017. As a consequence, up to 200 inelastic collisions on average will be superimposed on the event of interest. In this high-occupancy environment, reconstruct-ing charged particle momenta with high precision is one of the biggest challenges. In order to face this new scenario, called Phase 2, the Compact Muon Solenoid (CMS) ex-periment will build a completely new silicon tracking detector. New approaches to track finding will have to be implemented to exploit the capabilities of the new tracker in addi-tion to the algorithms already in use. The expected performance of CMS tracking at the HL-LHC is presented in this contribution.
1 Introduction
Starting in 2026, LHC will achieve a luminosity of 5×1034cm−2s−1with a bunch spacing of 25 ns.
This LHC upgrade, called High-Luminosity LHC (HL-LHC), is accompanied by an upgrade program of the CMS experiment, called Phase 2, to maintain the excellent performance of the detector. In the specific case of tracking, the CMS tracker will be traversed by about 6000 charged particles with transverse momentum above 300 MeV at every cross beam, produced by about 200 collisions on average, that should be reconstructed. In order to face this challenge, CMS will install a new silicon-based tracker, which must satisfy the physics performance requirements under HL-LHC conditions.
2 The CMS tracking system in Phase 2
The present strip tracker was designed to operate efficiently up to an integrated luminosity of 500 fb−1
and an average pile-up of 30 to 50 collisions per bunch crossing. The effect of the radiation
dam-age and the resulting performance degradation is extensively described in Ref. [1]. The rise of the LHC luminosity will increase the average pile-up per bunch crossing to 140–200, and the integrated
luminosity at the end of the HL-LHC era is estimated to be 3000 fb−1. These completely new
condi-tions will require a substantial upgrade of the CMS tracking system, which has to fulfill the following requirements:
• High radiation tolerance: The new tracker must be able to operate efficiently for the entire
HL-LHC period up to an integrated luminosity of 3000 fb−1. While no maintenance interventions are
foreseen for the Outer Tracker, the pixel modules of the Inner Tracker remain accessible and can be replaced.
• Increased granularity: This requirement is needed in order to avoid cluster merging and to main-tain a good track separation in the Inner Tracker, and to limit the combinatorics in both the seeding and the track finding phase.
• Contribution to the Level-1 trigger: In Phase 2 the trigger system is expected to maintain an output rate of 100 kHz despite the tenfold luminosity. This appears to be possible only with the addition of tracking information to the CMS Level-1 trigger system.
• Extended tracking acceptance: As the CMS physics program will benefit from a larger acceptance
region, the new tracker has been designed to cover the entireηregion up to|η|=4.
• Reduced material: The degradation of the tracking performance and the overall physics perfor-mance depends strongly on the amount of material in the tracking volume, therefore a lighter tracker
option has been chosen. Atη =0 and in the most forward region, i.e. 3.0 <|η| <4.0, the total
amount of material inside the tracking volume is estimated as 30% of a radiation length. In the Outer Tracker region, it rises up up to 80%.
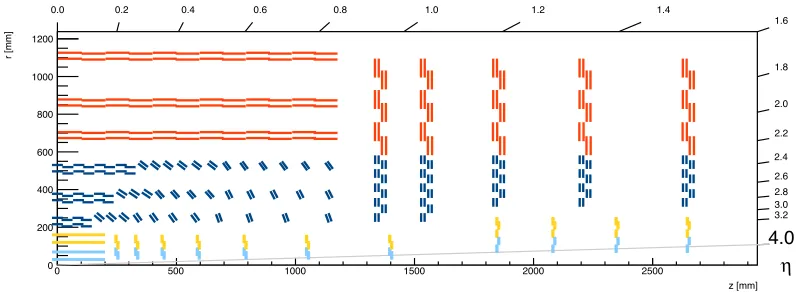
Figure 1 shows one possible layout configuration of the Phase 2 tracker. It will be composed of an Inner Tracker based on silicon pixel modules, and of an Outer Tracker made from silicon modules with strip and macro-pixel sensors.
In this layout, the Inner Tracker has four barrel layers and eleven end-cap disks. Different pixel
sizes in the Inner Tracker modules are under consideration, either 25×100μm2or 50×50μm2, which
will reduce the pixel area by a factor of about six compared to to the current CMS pixel detector. For
the studies in this paper, the 25×100μm2 Inner Tracker modules have been simulated. The Outer
Tracker has six barrel layers and five end-cap disks, where a part of the modules in the three innermost barrel layers are arranged in a tilted scheme. The Outer Tracker modules have been designed to provide useful information also at the first trigger level, allowing to maintain its acceptance rate below 100 kHz. Each module is a stack of two closely spaced sensors and is able to correlate hits produced
in the two sensors in real time, thereby rejecting low-pT particles using the strong bending power
of the 3.8 T magnetic field. Two different kinds of modules for the final configuration of the Outer
Tracker are under study: in the inner layers, macro pixel–strip (PS) modules composed of a bottom
sensor with 1.5 mm×100μm pixels and a top sensor with 2×25 mm strips (100μm pitch); in the
outer layers, strip–strip (2S) modules composed of two sensors with 2×5 cm long strips (90μm pitch)
each.
3 Track reconstruction method
The CMS track reconstruction algorithm is based on an iterative approach [2]. The main idea is to search for easier-to-find tracks first, to mask the hits associated to the found tracks, and to proceed to
the next iteration. In this way the combinatorial problem is reduced, and the search for more difficult
classes of tracks is simplified. Moreover, this approach introduces the possibility of developing special iterations that can improve track reconstruction in high-density environments such as jets, or to use the information from other subsystems such as muon chambers and calorimeters.
In each iteration, the so-called Combinatorial Track Finder is run. It can be divided into four
1. Seed generation: Using the information of three or four hits, the trajectory parameters and the corresponding uncertainties of the initial track candidates are computed.
2. Track finding: The current trajectory parameters are extrapolated to the next layer and possible compatible hits are found. Each of them is added to a clone of the track candidate. This step is repeated until more than one hit is missing or there are no more tracker layers.
3. Track fitting: The best possible estimates of the trajectory parameters at theimpact point1is obtained using a final Kalman or Gaussian-sum filter plus the corresponding smoothers.
4. Track selection: Tracks are grouped in different classes (Loose,TightorHigh Purity) according to various track quality cuts.
Although the track density is lower in the Outer Tracker, primary seeding in the Inner Tracker has the following advantages: even at very high pile-up, cluster merging is very much reduced thanks to the high granularity and the concomitant small channel occupancy; the Inner Tracker produces 3-D measurements that provide more constraints and better estimates of the initial trajectory parameters;
the efficiency of the reconstruction of low momentum particles that do not cross the entire Outer
Tracker is improved. The same seeding algorithm used in the present CMS tracking is also used
for Phase 2: triplets are found by purely combining pixel hits in different layers, while quadruplets
are created by the so-called “triplet propagation”, which consists in propagating triplets to the next
layer, finding possible compatible hits, computing the totalχ2and rejecting hits above a certainχ2
threshold. The seeding performance has been proved to have high efficiency with relatively low fake
rate in realistic simulation studies.
The list of the tracking iterations can be found in Table 1. The main difference between iterations
is the configuration of the seed generation and the target tracks. The seeding capability of the Outer Tracker is not yet exploited in the current Phase 2 track reconstruction; this topic is discussed in more detail in Section 5.
1The impact point is defined as the point of closest approach of the track to the assumed beam axis.
z [mm]
0 500 1000 1500 2000 2500
r [mm]
0 200 400 600 800 1000 1200
0.0 0.2 0.4 0.6 0.8 1.0 1.2 1.4
1.6
1.8
2.0
2.2
2.4 2.6 2.8 3.0 3.2
4.0
η
Table 1.List of the six tracking iterations used in Phase 2, with the corresponding seeding configuration used and the target tracks.
Iteration Step Name Seeding Target Track
0 HighPtQuadruplet pixel quadruplets prompt, highpT
1 HighPtTriplet pixel triplets prompt, highpT
2 DetachedQuadruplet pixel quadruplets displaced
3 LowPtQuadruplet pixel quadruplets prompt, lowpT
4 LowPtTriplet pixel triplets prompt, lowpT
5 Muon inside-out muon-tagged tracks muon tracks
4 Performance
4.1 Track reconstruction and parameters resolution
In order to assess the track reconstruction performance, defining the association between reconstructed and simulated tracks is particularly important. In the standard CMS definition, a reconstructed track is considered associated to a simulated particle if at least 75% of its hits originate from this simulated particle. If this is not the case, the reconstructed track is considered as a random combination of hits
and marked as a fake track. The tracking efficiency is therefore defined as the fraction of charged
particles associated to at least one reconstructed track, while the fake rate is the fraction of the fake
tracks in the set of reconstructed tracks. Both efficiency and fake rate strongly depend not just on the
algorithms and track selections used, but also on the intrinsic tracker properties, such as its layout, its material budget and the precision of its measurements.
The performance of the track reconstruction is evaluated using two different simulated samples.
Where needed, a pile-up of minimum-bias events is superimposed, where the number of pile-up events
is drawn from a Poisson distribution with mean equal to 140 or 200. The results are shown for theHigh
Puritytrack selection and can be considered a conservative lower limit and are expected to improve with careful tuning of the reconstruction and matching algorithms for the high pile-up scenario.
The first sample considered consists of events with top quark pair production (tt) and is used to assess the performance for a typical proton-proton collision at the HL-LHC. Figure 2 shows the
results for this sample in both pile-up scenarios. In the top row on the left, the tracking efficiency
for particles withpT >0.9 GeV is plotted as a function of the pseudorapidity, while on the right the
rate of fake tracks withpT>0.9 GeV is shown. The efficiency is around 90% falling offat|η|>3.8,
while the fake rate is smaller than 5% in the entire range ofη for pile-up 140. The small loss in
efficiency aroundη = 1.2 is partially due to the pixel configuration and will be fully recovered by
extending the seeding to the Outer Tracker. In the bottom row efficiency and fake rate are plotted as
a function of the transverse momentum. The tracking efficiency is around 90% in the range between
1 GeV and 100 GeV, and the fake rate is smaller than 10% below 10 GeV with 140 pile-up events on
average. As most particles in thettevents are hadrons, the deterioration of the efficiency at high pT
can be explained by the production of secondary particles in inelastic processes, which are very close to the mother particle at high energies and mislead the pattern recognition. With higher pile-up, the
efficiency is not affected, while the fake rate almost doubles, but is still tolerable. Figure 3 shows the
contribution of the individual iterations to the final tracking efficiency ofttevents with pile-up 140.
Thanks to the iterations targeting low transverse momentum particles, the efficiency is at least 30%
above 300 MeV/c.
The second sample consists of single muons, generated according to a flatη distribution in the
η
Simulated track
4
− −3 −2 −1 0 1 2 3 4
Tracking efficiency 0 0.2 0.4 0.6 0.8 1
<PU> = 140 <PU> = 200
CMS Preliminary Phase-2 Simulation
events t Tracks from t
< 3.5 cm
0
> 0.9 GeV, d
T p 14 TeV η Track 4
− −3 −2 −1 0 1 2 3 4
Tracking fake rate
0 0.05 0.1 0.15 0.2 0.25 0.3
<PU> = 140 <PU> = 200 CMS Preliminary Phase-2 Simulation
events t Tracks from t > 0.9 GeV T p
14 TeV
(GeV) T Simulated track p
1
−
10 1 10 102
Tracking efficiency 0 0.2 0.4 0.6 0.8 1
<PU> = 140 <PU> = 200
CMS Preliminary Phase-2 Simulation
events t Tracks from t < 3.5 cm
0 d 14 TeV (GeV) T Track p 1 −
10 1 10 102
Tracking fake rate
0 0.05 0.1 0.15 0.2 0.25 0.3
<PU> = 140 <PU> = 200 CMS Preliminary Phase-2 Simulation
events t Tracks from t
14 TeV
Figure 2. Tracking efficiency (left) and fake rate (right) as a function of the pseudorapidity (upper row) and as a function of the transverse momentum (lower row) forttevents simulated for the Phase 2 detector with superimposed pile-up collisions of 140 (full circles) and 200 (open circles). Tracks passing theHigh Purity quality requirements and produced less than 3.5 cm from the centre of the beam spot in radial direction are used. The performance as a function ofηis for generated particles withpT>0.9 GeV.
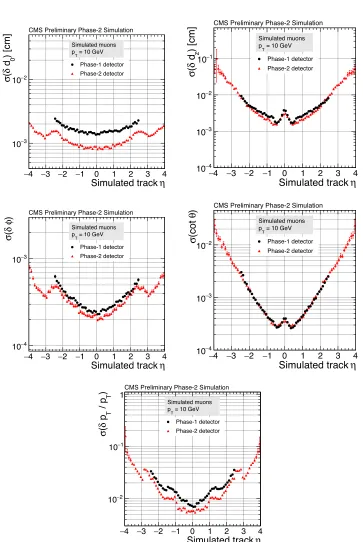
as a function of the pseudorapidity and to determine the resolution of the estimated track parameters at
the impact point. In the CMS convention the five trajectory parameters are:d0, the transverse impact
parameter;z0, the longitudinal impact parameter;φ, the track angle in the transverse plane; cotθ, the
cotangent of the polar angle; andpT, the transverse momentum. The resolution of track parameters is
given by the RMS of the residuals, i.e. the difference between the estimated and the simulated track
parameters. Figure 4 shows the tracking efficiency for single muons with a transverse momentum of
10 GeV in both pile-up scenarios. It can be seen that the single muon efficiency is independent of
the amount of pile-up. Figure 5 shows the resolution of the five parameters for single muons with
(GeV) T Simulated track p
1
−
10 1 10 102
Tracking efficiency
0 0.1 0.2 0.3 0.4 0.5 0.6 0.7 0.8 0.9 1
HighPtQuadruplet +HighPtTriplet +LowPtQuadruplet +LowPtTriplet +DetachedQuadruplet +Muon inside-out
14 TeV CMSSimulation preliminary
event tracks (PU=140) t
t
< 3.5 cm 0
d
Figure 3. Tracking efficiency of individual iterations for thettsample with an average pile-up of 140, recon-structed with the Phase 2 detector. The label of each iteration identifies the seeding algorithm used (see Table 1).
tracker. The resolution deteriorates for largeηfor all parameters, but for different reasons: the shorter
lever arm for the estimation of the curvature and of the azimutal angleφ; the larger extrapolation
distance from the innermost hit to the beam axis for the impact parameter; and the parametrization of
the polar angleθby cotθ. In all five parameters, the resolution is considerably better with the Phase 2
tracker. In particular, a significantly improvedpTresolution can be achieved thanks to the reduction
of the material budget and a better hit resolution. Also the transverse impact parameter resolution is
much better than with the Phase 1 detector, ranging from below 10μm in the barrel region to about
20μm in the very forward region.
η
Simulated track
4
− −3 −2 −1 0 1 2 3 4
Tracking efficiency
0 0.2 0.4 0.6 0.8 1
<PU> = 140 <PU> = 200
CMS Preliminary Phase-2 Simulation
Simulated muons < 3.5 cm
0
= 10 GeV, d
T
p
Figure 4.Tracking efficiency as a function of the pseudorapidity for single muons withpTequal to 10 GeV and
4.2 Signal vertex reconstruction and resolution
The Phase 2 vertex reconstruction [2] is based on the current algorithm used in the present CMS tracker. It proceeds in two steps: first, the vertices are found as clusters of tracks coming from the same interaction point using the Deterministic Annealing algorithm [3]; then, for each found vertex, an Adaptive Vertex Fit [4] computes the best estimate of the vertex position and of the parameters of the associated tracks without using any information on the beam position. Finally, the reconstructed
vertices are sorted to identify thesignal vertexamong the pile-up vertices. The vertex sorting is based
on thep2
T. In the case of jets, the individual tracks contributing to the
p2
T are replaced by jets
obtained by clustering tracks originating from the same vertex. The finalp2
T is computed using
these jets, the remaining isolated single tracks and the missing transverse momentum, re-weighed accordingly. A more detailed description of the sorting method can be found in Ref. [1].
The probability of reconstructing the signal vertex and to tag it correctly is an important figure of
merit, and it is strongly correlated with the amount of pile-up in the event. Forttevents, the efficiency
of the correct signal vertex identification is 94% with 140 pile-up events, and 89% with 200 pile-up events. The quality of the vertex reconstruction is also shown in Figure 6. On the left, the number of reconstructed vertices as a function of the number of simulated vertices is shown. The dependence is almost linear. On the right, the merging rate, i.e. the probability of two adjacent vertices to merge into
a single one, is shown as a function of their distance in thezcoordinate. The merging rate drops to
zero at about 0.6 mm both with 140 and with 200 pile-up events. Note that the merging rate is smaller
than one even at distances below 25μm.
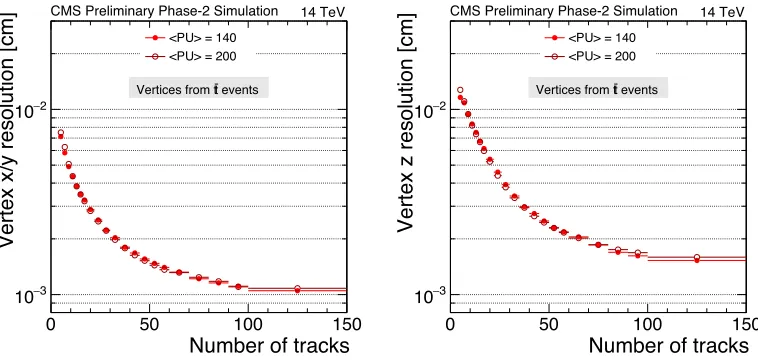
Another important aspect is the resolution of the vertex position in the x,y andzcoordinates,
which is shown in Figure 7 as a function of the number of tracks associated to the vertex. It can be seen that the resolution of the vertex position is almost independent of the amount of pile-up in the event. Moreover, the longitudinal resolution is only 50% worse than the transverse one, as expected given the pixel dimensions of Inner Tracker modules.
As in the case of the tracking performance, all results should be considered as a lower limit of the expected performance.
5 Future developments
Here some developments are listed that are envisaged for further improvement of the CMS Phase 2 tracking:
• Tracking@HLT using GPUs: The software for the CMS High-Level Trigger (HLT) tracking has been moved in 2017 from a one-event-per-thread strategy to a many-threads-per-event approach.
This massive parallelism within each event scales with the pile-up by offloading the combinatorics
to as many threads as are available. This task has been implemented in CMS designing a high-level trigger based on GPUs. The same valid approach will be used also for the future Phase 2 HLT. • Tracking in the Outer Tracker: Many developments are made possible by this new kind of
detec-tor. For example, the L1 track trigger information can be used directly in the offline reconstruction
for instance to create seeds from L1 tracks or to incorporate L1 algorithms in the offline tracking.
• Multiple algorithms: This exploits the concept of using different algorithms specialized for certain
tasks in different iterations.
• Iterations targeting physics objects: As already mentioned in Section 3, the iterative approach is very suitable for introducing special iterations targeting specific physics object. This has already been tested in the current CMS tracking, but has not yet been fully introduced into the Phase 2 reconstruction sequence. Some examples are the muon specific iterations and the reconstruction of tracks inside jet cones, which makes identification of physics objects more robust, and significantly
increases the track reconstruction efficiency and purity [5].
References
[1] D. Contardo, M. Klute, J. Mans, L. Silvestris, J. Butler (CMS), CERN-2015-010, LHCC-P-008, CMS-TDR-15-02 (2015)
[2] The CMS Collaboration (CMS), JINST9, P10009 (2014)
[3] K. Rose, Proceedings of the IEEE86/11, 2210 (1998)
[4] R. Frühwirth, W. Waltenberger, P. Vanlaer, Tech. Rep. CMS-NOTE-2007-008, CERN, Geneva
(2007),https://cds.cern.ch/record/1027031
η
Simulated track
4
− −3 −2 −1 0 1 2 3 4 ) [cm] 0
d δ ( σ 3 − 10 2 − 10 Phase-1 detector Phase-2 detector
CMS Preliminary Phase-2 Simulation
Simulated muons = 10 GeV
T
p
η
Simulated track 4
− −3 −2 −1 0 1 2 3 4
) [cm] z
d δ ( σ 4 − 10 3 − 10 2 − 10 1 −
10 Phase-1 detector
Phase-2 detector CMS Preliminary Phase-2 Simulation
Simulated muons = 10 GeV T p
η
Simulated track
4
− −3 −2 −1 0 1 2 3 4
) φ δ ( σ 4 − 10 3 − 10 Phase-1 detector Phase-2 detector
CMS Preliminary Phase-2 Simulation
Simulated muons = 10 GeV
T
p
η
Simulated track 4
− −3 −2 −1 0 1 2 3 4
) θ (cot σ 4 − 10 3 − 10 2 −
10 Phase-1 detector
Phase-2 detector CMS Preliminary Phase-2 Simulation
Simulated muons = 10 GeV T p
η
Simulated track
4
− −3 −2 −1 0 1 2 3 4
) T / p T p δ ( σ 2 − 10 1 − 10 1 Phase-1 detector Phase-2 detector
CMS Preliminary Phase-2 Simulation
Simulated muons = 10 GeV
T
p
Simulated interactions
100 150 200 250
Reco Vertices
0 100 200 300
<PU> = 140 <PU> = 200
CMS Preliminary Phase-2 Simulation
events t Vertices from t
14 TeV
Closest distance in z [cm]
3
−
10 10−2 10−1 1
Merging rate
0 0.5 1
<PU> = 140 <PU> = 200
CMS Preliminary Phase-2 Simulation
events t Vertices from t
14 TeV
Figure 6.Number of reconstructed (“Reco”) vertices versus the number of simulated vertices (left) and merging rate of vertices as a function of their distance in thezcoordinate (right) forttevents with 140 superimposed pile-up events (full circles) and 200 pile-up events (open circles).
Number of tracks
0 50 100 150
Vertex x/y resolution [cm]
3
− 10
2
− 10
<PU> = 140 <PU> = 200
CMS Preliminary Phase-2 Simulation
events t Vertices from t
14 TeV
Number of tracks
0 50 100 150
Vertex z resolution [cm]
3
− 10
2
− 10
<PU> = 140 <PU> = 200
CMS Preliminary Phase-2 Simulation
events t Vertices from t
14 TeV