688
Removal of Pb (II) ions from Aqueous Solution using
Naural Orange Peel and Activated Orange Peel
Mamta Bhagat, Anil Yadav*, Virender Yadav
Chemical Engineering Department
Deenbandhu Chhotu Ram University of Science & Technology, Murthal (Sonepat) Corresponding Author Email:- anilyadav940@gmail.com
Abstract -The objective of this paper was to study the removal of lead ions by adsorption using cheap and eco-friendly natural & activated orange peel adsorbent from aqueous solution. The lead Pb (II) ions removal from aqueous solution was studied using batch adsorption method. The main parameters that influenced lead adsorp-tion were contact time, adsorbent dosage and pH value. Characterizaadsorp-tion of natural orange peel (NOP) and acti-vated orange peel (AOP) has been studied by SEM, TEM and FTIR. Equilibrium data showed that lead adsorp-tion fitted well with adsorpadsorp-tion isotherm models. The maximum removal of lead by natural orange peel and activated orange peel is 79% and 98% respectively.
Keywords: Lead, Natural orange peel, Activated orange peel, Adsorption Isotherms.
1. INTRODUCTION
Lead (Pb II) ions is a heavy metal that is released in natural water from glass industries, ceramic, textile dyeing, petroleum refining, battery manufacturing and mining operations. It contaminate drinking wa-ter due to the corrosion, leaching of lead from wawa-ter pipes and lead solder joints associated in service lines used in household plumbing. It is highly and cumulative poison accumulates mainly in bones, kidney, brain & muscles. International Agency for Research on Cancer categorised lead as probably carcinogenic to humans. It is also an oxidising agent. It must be handled and stored with the ap-propriate safety and precautions to prevent inhala-tion, skin contact and ingestion [1]. Manufacturing industries such as batteries, television tube, paints, pigments, photographic material, printing, gasoline additives, matches and explosives brought lead bearing wastewater [2]. Industrial effluents must be free from lead before its discharge to prevent envi-ronmental hazard [3]. Due to its hazardous nature, “In this study an attempt was made using adsorp-tion technology for the removal and minimizaadsorp-tion of toxicity of Pb (II) ions by natural and activated orange peel, using batch studies and isotherm stud-ies for determination of adsorption capacitstud-ies” [4-5].
2. MATERIALS AND METHODS 2.1. Chemicals
Lead nitrate (Pb(NO3)2), sulphuric acid (H2SO4),
Hydrochloric acid (HCl) and also distilled water was used in this experiment. All chemicals were analytical reagent grade.
2.2. Adsorbents used
2.2.1. Natural orange peel powder
Oranges as a fruit are produced in large amount in India and their peels are treated as waste materials. Thus they are available very easily and free of cost in abundant. First washing of orange peels were done with distilled water to remove dirt and un-wanted particles from it. Then they were cut into small pieces and kept into oven at 900C for 15-20 hrs. Then after drying they were crushed in a grind-er and then they convgrind-erts into fine powdgrind-er. The powder was sieved.
2.2.2. Activated orange peel
Sulphuric acid is added in orange peel powder formed by above procedure and heated in furnace at temperature 150-1550C for 20 min. Then it converts into carbon & this carbon was cooled at room tem-perature. Washed with distilled water to remove acid from it and dry it in oven to remove moisture from it.
2.3. Adsorbate
Stock solution of 1000 ppm of Pb (II) ions was pre-pared by adding 1.6 g of lead nitrate in 1000 ml distilled water in 1000 ml flask.
2.4. Batch adsorption studies
689 late the optimum conditions for maximum heavy
metals removal from aqueous solution [7]. The re-moval of Pb (II) ions was calculated by given equa-tion (1)
%
(1)
2.5. Characterization Techniques
SEM uses a focused beam of high-energy electrons to generate a variety of signals at the surface of solid objects. It reveals information of external morphology (texture), chemical composition, and crystalline structure and orientation of materials making up the sample. TEM is a microscopy tech-nique in which a beam of electrons is transmitted through a specimen to form an image [8]. FTIR is used to identify certain functional groups in mole-cules [9].
2.6. Adsorption isotherm
Langmuir isotherm was observed the equilibrium relation between amount of adsorbate adsorbed on the adsorbent surface and its concentration in the solution at constant temperature. The linear form of Langmuir expression is given by (2)
(2)
Where Ce is the equilibrium concentration of dye solution (mg/l), Qe is the equilibrium capacity of Pb (II) ions on the adsorbent in mg/g, Qo is the monolayer adsorption capacity of the adsorbent and b is the constant and is related to the free energy of adsorption.
(3)
Qe = adsorption capacity, Co=initial concentration,
Ce = equilibrium concentration, V= volume of solu-tion, W=amount of adsorbent
Kf and 1/n are the constants which indicate the
sorption capacity (mg/g) and intensity of the ad-sorption.
3. RESULT AND DISCUSSIONS
3.1. Characterization
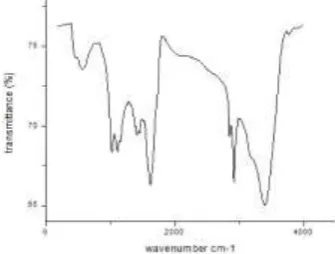
SEM routinely used to generate high-resolution images of shapes of specimens and to show spatial variations in chemical compositions of AOP and NOP. Fig. 1 and 2 shows NOP and AOP image, we can see the irregular shapes. A porosity and uni-form surface can be seen in both the figures. In the-se images, the prethe-sence of many pores proves the important role of ultrasonic waves on carbon activa-tion. TEM was used to determine the size and size distribution of the NOP and AOP. The size of NOP and AOP was 2 µm and 100 nm respectively with non uniform shape. FTIR spectrometer shows high spectral resolution data over a wide spectral range of a solid, liquid or gas. The broad and intense peaks at 3762 cm-1 and this FTIR spectra showed that the peaks expected at 3762, 3017, 1810, 1502, 1283 and 821 cm-1 had shifted to 3723, 3004, 1808, 1489, 1271 and 795 cm-1 due to adsorption [10-11]. The shift may be due to changes in counter ions associated with carboxylate and hydroxylate anions.
690 Fig. 2. SEM image of activated orange peel
[image:3.595.71.289.100.220.2]Fig. 3. TEM image of natural orange peel
Fig. 4. TEM image of activated orange peel
Fig. 5. FTIR of natural orange peel
Fig. 6. FTIR of activated orange peel
3.2. Adsorption Studies
3.2.1. Effect of contact time variation
Fig. 7 shows the effect of contact time using both cases natural orange peel and activated orange peel for adsorption of Pb (II) ions of 20 ppm concentra-tion. 0.5 g adsorbent (AOP & NOP) was taken in 100 ml beaker and total 50ml solution was prepared of Pb (II) ions. Thus beaker of sample was kept on the shaker at room temp 300C. The contact time for sample was taken as 20, 30, 40, 50, 60, 70, 80 min etc. The % of absorbance at 283 nm was deter-mined by UV-spectrophotometer. Adsorption in-creases with increase in contact time and it become constant after 60 minutes [12]. Maximum removal efficiency was 94.56 % in case of AOP and 74.55% in case of NOP.
[image:3.595.315.531.532.703.2] [image:3.595.77.245.595.722.2]691 removal of Pb (II) ions increases with increase in
[image:4.595.75.290.276.436.2]adsorbent dosage [13]. Maximum Pb (II) ions re-moval in case of AOP was 95.43% and maximum lead removal in case of NOP was 75.34%.
Fig. 8. Effect of adsorbent dose on removal of Pb (II) ions by AOP and NOP
3.2.3. Effect of pH variation
Fig. 9 shows that the effect of pH and Pb (II) ions of concentration 20 ppm was taken but their pH was different 2, 4, 6, 8, 10. Adsorbent amount was 0.5 g and total volume of the 5 samples was taken 50ml. These samples were kept on the shaker for 120 min at room temperature. It was observed that percentage removal of Pb (II) ions increases with increase up to pH 6. Then there is decease in per-centage removal of Pb (II) ions with increases in pH [14]. Thus maximum removal of Pb (II) ions 98.37% for AOP and maximum removal of Pb (II) ions 78.73% for NOP.
3.2.4. Effect of initial concentration
Fig. 10 shows that the effect of concentration was studied that in the both cases (AOP & NOP) total 50 ml solution of lead was taken at different con-centration 20, 40, 60, 80, 100 ppm in 5 different beakers. They kept on the shaker for 120 min at room temperature. The samples were shaken at pH 5.6. It was observed that maximum % removal oc-curred at very low concentration thus % removal of
mental data obviously showed that by increasing the solution temperature from 30 to 60 0C. The 0.5 g adsorbent added and then kept for shaking by magnetic beats for 120 min. Removal of Pb (II) ions increases with increase in temperature and maximum removal of Pb (II) ions was 94.63% for AOP and 78% for NOP. Temperature increase leads to increase in number of adsorption sites due to breaking of some internal bonds near edge of active surface sites of adsorbent [15].
Fig. 9. Effect of pH on removal of Pb (II) ions by AOP & NOP
Initial concentration
0 20 40 60 80 100 120
%
rem
ov
al
of
le
ad
0 20 40 60 80 100
AOP NOP
[image:4.595.316.530.341.497.2] [image:4.595.316.530.546.713.2]692 Fig. 11. Effect of temp on % removal of Pb (II) ions
by AOP & NOP
3.3. Adsorption isotherms
Langmuir model was fitted to the experimental data as shown in fig. 12 and 13 for NOP and AOP re-spectively.
[image:5.595.316.526.105.275.2]Fig. 12. Langmuir isotherm for AOP
[image:5.595.323.531.330.476.2]Fig. 13. Langmuir isotherm for NOP
Fig. 14. Freundlich isotherm for AOP
Fig. 15. Freundlich isotherm for NOP
[image:5.595.73.284.384.528.2]The R2 value is close to 1 and thus both the models describe the system but Langmuir isotherm model fits better than Freundlich isotherm model.
Table.1. Evaluated adsorption constants for AOP and NOP at room temperature observed for dif-ferent Isotherm models
Langmuir Isotherm model
Freundlich Isotherm model
Q0 KL R2 N Kf R2
AOP 0.093 6.21 0.989 0.121 8.312 0.937
[image:5.595.72.547.394.729.2]693
(5) where qe and q are amount of lead adsorbed at equilibrium and at time t, in mg/g respectively, and Kads is the first order rate constant, was applied to
the present studies of dye adsorption. As such, the values of log (qe - q) were calculated from the ki-netic data of Fig. 7 and plotted against time. The plots so obtained are found to be linear with good correlation coefficients of 0.9242 and 0.9748 for AOP and NOP indicating that Lagergren’s equation is applicable to the Pb (II) ions adsorption on AOP and NOP respectively. So this adsorption is a first-order process. The first-first-order rate constant calcu-lated from the plots is found to be 2.717 x 10⁻⁴ min
-1
and 0.6 x 10⁻⁴ min-1 for AOP and NOP respective-ly.
4. CONCLUSION
The result has shown that both natural orange peel and activated orange peel were very effective ad-sorbents for the removal of Pb (II) ions from waste water solutions. The maximum removal of lead by NOP & AOP at pH 6, contact time 80 min, concen-tration 20 ppm and 1.0g/100 ml adsorbent dose is 79% and 98% respectively.
5. ACKNOWLEDGEMENT
The authors are thankful to Chemical Engineering department, Deenbandhu Chhotu Ram University of science and technology, Murthal for providing necessary facilities during this work and Dr Dhar-mender Kumar , Department of Biotechnology, DCRUST, Murthal for his valuable suggestions.
REFERENCES
1. National research council Canada (1978). Effect of lead in the Canadian environment, report NRCC16745, Ottawa.
2. Patterson (1985). Industrial Wastewater Treat-ment Technology, 2nd Edition, Butterworth Publishers, Stoneham.
3. Hinchee Alleman (1991). Hydrocarbon bioreme-diation. CRC Press, Boca Raton.
4. Ademorati CMA (1996). Environmental Chemis-try and Toxicology, Foludex Press Ltd., Ibadan.
as Adsorbent for the Removal of Congo red dye” IJETSR, 7, pp. 364-369.
8. R. Perrich (1981). Activated Carbon Adsorption for Wastewater Treatment, CRC Press.
9. Glossary (2009). The Brownfields and Land Revitalization, Technology Support Center, Re-trieved, 10, pp. 12-21.
10. M. Erdem, S. Ucar, S. Karagoz, & T. Tay (2013). Removal of Lead (II) Ions from Aque-ous Solutions onto Activated Carbon Derived from Waste Biomass, Hindawi Publishing Cor-poration, The Scientific World Journal, 7, pp. 1-8.
11. Bernard & Jimoh (2013). Adsorption of Pb, Fe, Cu, and Zn from industrial electroplating wastewater by orange peel activated carbon, In-ternational Journal of Engineering and Applied Sciences, 4, pp. 95-103.
12. R. Nazir, F. Jinnah (2013). Heavy Metal Re-moval from Wastewater using Environment Friendly Bio-materials: A Cost Effective and Eco-friendly Technique, International Journal of Chemical and Environmental Engineering, 4, pp. 281-285.
13. M. A. Mahmoud and M. M. El-Halwany (2014). Adsorption of Cadmium onto Orange Peels: Isotherms, Kinetics, and Thermodynam-ics, J. Chromatogr Sep. Tech., 5, pp. 1-6. 14. Taman, Ossman, Mansour & Farag (2015).
Metal Oxide Nano-particles as an Adsorbent for Removal of Heavy Metals, J. Adv. Che. Engg.,
5, pp. 1-8.
15. Andrea, Santana & W. D. Santos (2016). Re-moval of mercury (II) ions in aqueous solution using the peel biomass of Pachiraaquatica Aubl: kinetics and adsorption equilibrium studies,
Springer International Publishing Switzerland,
Environ Monit Assess, 6, pp. 188-198.
16. E. Said, Gamal (2012). Potential Application of Orange Peel (OP) as an Eco-friendly Adsorbent for Textile Dyeing Effluents., Journal of Textile and Apparel, Technology and Management, Spring, 7, pp. 1-13.
17. A. Bhatnagar, A.K. Jain & M.K. Mukul (2005). Removal of congo red dye from water using carbon slurry waste, Enviornmental chemical letters, 25, pp. 192-202.