Utilizing Variability of Time and Term Content, within and across
Users in Session Detection
Shuqi Sun1, Sheng Li1, Muyun Yang1, Haoliang Qi2, Tiejun Zhao1
1Harbin Institute of Technology, 2Heilongjiang Institute of Technology
{sqsun, ymy, tjzhao}@mtlab.hit.edu.cn, [email protected] [email protected]
Abstract
In this paper, we describe a SVM classi-fication framework of session detection task on both Chinese and English query logs. With eight features on the aspects of temporal and content information ex-tracted from pairs of successive queries, the classification models achieve signifi-cantly superior performance than the stat-of-the-art method. Additionally, we find through ROC analysis that there exists great discrimination power variability among different features and within the same feature across different users. To fully utilize this variability, we build lo-cal models for individual users and com-bine their predictions with those from the global model. Experiments show that the local models do make significant im-provements to the global model, although the amount is small.
1 Introduction
To provide users better experiences of search engines, inspecting users’ activities and inferring users’ interests are indispensible. Query logs rec-orded by search engines serves well for these purposes. Query log conveys the user interest information in the form of slices of the query stream. Thus the task of session detection con-sists in distinguishing slice that corresponds to a user interest from other ones, and thus this paper, we adopt the definition of a session following (Jansen et al., 2007):
(A session is) a series of interactions by the us-er toward addressing a single information need.
This definition is equivalent to that of the “search goal” proposed by Jones and Klinkner
(2008), which corresponds to an atomic
infor-mation need, resulting in one or more queries. This paper adopts a classification point of view to the task of session detection (Jones and Klinkner, 2008). Given a pair of successive que-ries in a query log, we examine it in various viewpoints (i.e. features) such as time proximity and similarity of the content of the two queries to determine whether these two queries cross a bor-der of a search session. In other words, we classi-fy the gap between the two queries into two clas-ses: session shift and session continuation. In practice, search goals in a search mission and different search missions could be intermingled, and increase the difficulty of correctly identify-ing them. In this paper, we do not take this issue into account and simply treat all boundaries be-tween intermingled search goals as session shifts. The chief advantage in this choice is that we will have the opportunity to make classification mod-el working online without caching user’s queries that are pending to be assigned to a session.
Various studies built accurate models in pre-dicting session boundaries and in distinguishing intermingled sessions, and they are summarized in Section 2. However, none of these works ana-lyzed the contribution of individual features from a user-oriented viewpoint, or evaluated a fea-ture’s discrimination power in a general scenario independent of its usage, as this paper does by conducting ROC analyses. During these analyses, we found that the discrimination power of fea-tures varies dramatically, and for different users, the discrimination power of a particular feature also does not remain constant.
previ-ous works build user-specific models for the sake of characterizing the variability in user’s search activities, except that of Murray et al. (2006). To fully make use of these two aspects of variability, inspired by Murray et al., we build users’ local models based on a much broader range of evi-dences, and show that different local models vary to a great extent, and experiments show that the local models do make significant improvements to the global model, although the amount is small.
The remainder of this paper is organized as follows: Section 2 summarizes the related work of the session detection task. In Section 3, we first describe our classification framework as well as the features utilized. Then we conduct various evaluations on both English and Chinese query logs. Section 4 introduces the approaches to building local models based on an analysis of the variability of the discrimination power of features, and combine predictions of local mod-els with those of the global model. Section 5 dis-cusses the experimental results and concludes this paper.
2 Related Work
The simplest method in session detection is defining a timeout threshold and marking any time gaps of successive queries that exceed the threshold as session shifts. The thresholds adopted in different studies were significantly different, ranging from 5 minutes to 30 minutes (Silverstein et al., 1999; He and Göker, 2000; Radlinski and Joachims, 2005; Downey et al., 2007). Other study suggested adopting a dynamic timeout threshold. Murray et al. (2006) proposed a user-centered hierarchical agglomerative clustering algorithm to determine timeout threshold for each user dynamically, other than setting a fixed threshold. However, Jones and Klinkner (2008) pointed out that single timeout criterion is always of limited utility, whatever its length is, and incorporating timeout features with other various features achieved satisfactory classification accuracy.
An effective approach to combining the time out features with various evidences for session detection is machine learning. He et al. (2002) collected statistical information from human an-notated query logs to predict the probability a “New” pattern indicates a session shift according to the time gap between successive queries.
Özmutlu and colleagues re-examined He et al.’s work, and explored other machine learning tech-niques such as neural networks, multiple linear regression, Monte Carlo simulation, conditional probabilities (Gayo-Avello, 2009), and HMMs (Özmutlu, 2009).
In recent studies, Jones and Klinkner (2008) built logistic regression models to identify search goals and missions, and tackled the intermingled search goal/mission issue by examining arbitrary pairs of queries in the query log. Another contri-bution of Jones and Klinkner is that they made a thorough analysis of contributions of individual features. However, they explored the features’ contributions from a feature selection point of view rather than from a user-oriented one, and thus failed to characterize the variability of the discrimination power of the features when ap-plied to different users.
3 Learning to Detect Session Shifts
3.1 Feature Extraction
We adopt eight features covering both the tem-poral and the content aspect of pairs of succes-sive queries. Most these features are commonly used by previous studies (He and Göker, 2000; Özmutlu, 2006; Jones and Klinkner, 2008). However, in this paper, we will analyze their contributions to the resulted model in a quite dif-ferent way from that in previous works.
Let Q = (q1, q2, … , qn) denote a query log.
The features are extracted from every successive
pair of queries (qi, qi+1). Table 1 summarizes the
features we adopt. The normalization described in Table1 is done according to the type of the feature. Features describing characters are nor-malized by the average length of the two queries, while those describing character-n-grams are normalized by the average size of the n-gram sets of the two queries. Character-n-grams (e.g.
bi-grams “ca” and “at” in “cat”) are robust to
dif-ferent representations of the same topic (e.g. “IR”
as Information Retrieval) and typos (e.g.
“speling” as “spelling”), and serve as a simple
stemming method. In practice, character-n-grams
are accumulative, which means they consist of
all m-grams with m ≤ n.
Here we first define n-gram distance (ND) from
Note that character-n-grams are accumulative and there could be multiple occurrences of a character-n-gram in a query, so the number of a
character-n-gram is the sum of that of all m
-grams with m ≤ n, and multiple occurrences are
all considered. At last, the average of
character-n-gram distance (ACD) of the pair (qi, qi+1) is:
There are seven features describing the content aspect of a query pair, and they are more or less overlapped (e.g. edit_distance vs. common_char). However, we show in the next subsection that all these features are beneficial to the final perfor-mance.
Feature Description
time_interval time interval between
successive queries avg_ngram_
distance
avg. of character-n-gram distances
edit_disance normalized Levenshtein
edit distance
common_prefix normalized length of pre-fix shared
common_suffix normalized length of suf-fix shared
common_char normalized number of
characters shared
common_ngram normalized number of character-n-grams shared
Jaccard_ngram Jaccard distance between
character-n-gram sets Table 1. Features used in classification models
3.2 Data Preparation
The query logs we explored include an English search log tracked by AOL from Mar 1, 2006 to May, 31 2006 (Pass et al., 2006), and a Chinese search log tracked by Sogou.com, which is one of the major Chinese Search Engines, from Mar
1, 2007 to Mar 31, 20071. We applied systematic
sampling over the user space on the two logs,
spectively2. Sampling over the user space instead
of over the query space avoids the bias to the most active users who submit much more queries than average users.
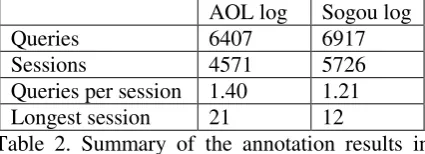
For each sampled dataset, we invited annota-tors who are familiar with IR and search process to determine each pair of successive queries of interest is across the border of a session. We made trivial pre-split process under two rules:
Queries from different users are not in the same session.
Queries from different days are not in the same session.
Table 2 shows some basic statistics of the an-notated data set. During the annotation process, the annotators were guided to identify the user’s information need at the finest granularity ever possible, because we focus on the atomic infor-mation needs as described in Section 1. Conse-quently, the average numbers of queries in a ses-sion in both query logs are lower than previous classification model based on the whole training data obtained in the previous sub-subsection for both the query logs. We built the models within SVM framework. The implementation of SVM we used is libSVM (Chang and Lin, 2001). For the sake of evaluations and of model integration in the next section, we set the prediction of SVM
to be probability estimation of the test example
being positive. All features were pre-scaled into [0, 1] interval. We adopted the polynomial kernel, and for both datasets, we exhaustively tried each of the subset of the eight features using 5-fold cross validation. We found that using all the eight features yielded the best classification ac-curacy. Thus in the experiments in rest of this
2
section and the next section, we adopt the entire feature set to build global classification models.
There is one parameter to be determined for feature extraction: the length of character-n-grams. The proper lengths on AOL log and Sogou log are different. We tried the length from 1 to 9, and according to cross validation accuracy, we found the best lengths for the two logs as 6 and 3 respectively.
3.4 Experimental Results
3.4.1 Baseline Methods
We provide two base line methods for compari-sons. The first method is the commonly used timeout methods. We tried different timeout thresholds from 5 minutes to 30 minutes with a step of 5 minutes, and found that for both query logs the 5 minutes’ threshold yield the best over-all performance.
The second method achieved the best perfor-mance on the AOL log (Gayo-Avello, 2009), which addresses the session detection problem using a geometric interpolation method, in com-parison to previous studies on this query log. We re-implemented this method and evaluated it on both the datasets. Similarly, the best parameters for the two query logs are different, such as the length of a character-n-gram. We only report the performance with the best parameter settings.
3.4.2 Analyzing the Performance
We analyze the performance of the SVM models
according to precision, recall, F1-mean and F1.5
-mean of predictions on session shift and continu-ation against human annotcontinu-ation data.
The F-mean is defined as:
R P
PR
+ +
= 2
2) 1 ( mean -F
β β
β
where P denotes precision and R denotes recall. He et al. (2002) regards recall more important
than precision, and set the value of in F-mean
to 1.5. We also report performance under this measure.
In addition to traditional precision / recall based measures, we also perform ROC (Receiver Operating Characteristic) analysis to determine the discrimination power of different methods. The best merit of ROC analysis is that given a reference set, which is usually the human annota-tion results, it evaluates a set of indicator’s dis-crimination power for arbitrary binary
classifica-tion problem independent of the critical value
with which the class predictions are made. Specifically, in the context session detection, regardless of the critical value that splits the clas-sifier outputs into positive ones and negative ones (e.g. the 5-minutes’ timeout threshold and 50% probability in SVM’s output), the ROC analysis provides the overall discrimination pow-er evaluation of the output set of a cpow-ertain meth-od (by trying to set each output value as the criti-cal value). For the baseline method by Gayo-Avello, the core of the decision heuristics also had a critical value to be determined. For details, readers could refer to (Gayo-Avello, 2009).
3.4.3 Precision, Recall, and F-means
Before we examine the discrimination power of each session detection method’s output independ-ent of the threshold value selected. In this sub-subsection, we begin with a more traditional eval-uation schema: setting a proper threshold to pro-duce binary predictions. It is straightforward to set the threshold for SVM method to 50%, and as described in sub-subsection 3.1.1, the threshold for timeout method is 5 minutes. The threshold of Gayo-Avello’s method is implied in its heuristics.
Table 3 and Table 4 show the experimental re-sults on AOL log and Sogou log respectively. For each dataset, we performed 1000-times boot-strap resampling, generating 1000 bootboot-strapped datasets with the same size as the original dataset. To test the statistical significance of performance differences, we adopted Wilcoxon signed-rank test on the performance measures computed from the 1000 bootstrapped dataset, and found com-parisons between each pair of methods were all significant at 95% level.
The results show that SVM method clearly outperforms the baseline methods, and timeout method performs poorly. It may be argued that the poor performance of timeout method is due to the improper threshold value chosen. In this case, the ROC analysis, which assesses the dis-crimination power of a method’s output set inde-pendent of the threshold value chosen, is more suitable for performance evaluation.
con-tinuations implies that its heuristics did not gen-eralize well to Chinese query logs.
Timeout Gayo-Avello SVM
P shift 75.92 89.35 90.96
cont. 63.05 85.32 92.06
R cont. shift 64.49 74.77 87.85 87.08 93.82
88.50
F1
shift 69.74 88.60 92.37
cont. 68.41 86.19 90.25
F1.5 cont. shift 67.62 70.72 88.31 86.53 92.92
89.57
Table 3. Precision (P), recall (R), F1-mean (F1),
and F1.5-mean (F1.5) of SVM method and the two
baseline methods on AOL dataset.
Timeout Gayo-Avello SVM
P shift 67.75 75.10 87.53
cont. 52.82 83.51 81.62
R shift 59.52 91.44 86.17
cont. 61.53 58.84 83.33
F1
shift 63.37 82.47 86.85
cont. 56.84 69.04 82.47
F1.5 cont. shift 61.83 58.56 85.71 64.72 86.59
82.80
Table 4. Precision (P), recall (R), F1-mean (F1),
and F1.5-mean (F1.5) of SVM method and the two
baseline methods on Sogou dataset.
3.4.4 ROC Analysis
By setting certain threshold value, we analyzed the three method’s performance using precision / recall based measures. In this sub-subsection, we try to set each value in an output set as the threshold value, and evaluate the discrimination power of methods by the area under the ROC curve.
Figure 1 shows the ROC curves of the SVM method and the two baseline methods: timeout and Gayo-Avello, for predicting session shifts. ROC curves for predicting session continuations are symmetric with respect to the reference line, so we omit them in the rest of this paper for the sake of space limit.
The results show that SVM method clearly outperforms the baseline methods in the prospec-tive of discrimination power, with ROC area 0.9562 on AOL dataset and 0.9154 on Sogou dataset. The curves of the two baseline methods are clearly under that of SVM method. This means baseline methods can never achieve accu-racy as high as SVM method w.r.t. a fixed false
alarm (classification error) rate, nor false alarm rate as low as SVM method w.r.t. a fixed accura-cy rate. Again, Gayo-Avello method significantly outperforms timeout method, while underper-forms the SVM method. For the question in the previous sub-subsection, coinciding with previ-ous studies (Murray et al., 2006; Jones and Klinkner, 2008), applying single timeout thresh-old always yields limited discrimination power, wherever the operating point on ROC curve (i.e. threshold value) is set.
4 Making Use of the Variability of Dis-crimination Power
In this section, we first analyze the amount of contribution that each feature makes and show that the contribution, i.e. the discrimination pow-er of each feature varies dramatically across dif-ferent users. Then, we propose an approach to making use of this variability. Finally through experimental results, we show that the proposed approach makes small, yet significant improve-ments to the SVM method in Section 3.
4.1 Variability of Discrimination Power
The ROC analysis of individual feature provides adequate characterizations of the discrimination power of the feature. Another advantage of adopting ROC analysis is that the results are in-dependent not only of the critical value, but also of the scale of the feature values.
0.
0.00 0.25 0.50 0.75 1.00
1-Specificity
0.00 0.25 0.50 0.75 1.00
1-Specificity
Figure 1. ROC analysis of SVM method and two baseline methods for predicting session shifts on both AOL and Sogou dataset. All comparisons between ROC areas within the same dataset are at least 95% statistically significant, because the corresponding confidence intervals do not overlap.
0.
0.00 0.25 0.50 0.75 1.00
1-Specificity
0.00 0.25 0.50 0.75 1.00
1-Specificity
Figure 2. ROC analysis of individual features for predicting session shifts on both AOL and Sogou dataset. Note that some curves with similar ROC area values overlap each other.
In spite of the discrimination power a feature has, its behavior on different users is worth-while to be examined. For selecting users that have sufficient data to draw stable conclusions, we consider only users who issued more than 50 queries in the datasets. Unfortunately, there are too few users (6 users) qualified in Sogou
da-taset, so we show only the statistics of ROC area values of each of the features in Table 5 based on 37 users in AOL dataset.
than that of the Gayo-Avello’s method. Thus, the discrimination power of a feature is likely to vary significantly, because all the standard de-viations are at 0.03 or even higher level. Espe-cially, the minimum and maximum values show that for these users, some of the findings above from the whole dataset do not hold. This implies that it is likely more feasible to build specific local models for these users to make full use of the variability within the same feature.
Feature avg. sdev. min. max.
time_interval 0.780 0.088 0.476 0.912
avg_ngram_
distance 0.954 0.034 0.861 1.000
edit_disance 0.883 0.056 0.733 0.990
common_prefix 0.224 0.069 0.099 0.327 common_suffix 0.299 0.113 0.064 0.578
common_char 0.143 0.082 0.037 0.493
common_ngram 0.051 0.037 0.000 0.187
Jaccard_ngram 0.049 0.036 0.000 0.173
Table 5. Average, standard deviation, minimum, and maximum ROC areas of individual features
4.2 Building Local Models
We built individual local models for each user that issued more than 50 queries in AOL dataset. We also performed 5-fold cross validations and set the prediction to be the probability estima-tion of a test example being positive. The fea-ture selection process showed again that all the eight features are beneficial, and none of them should be excluded.
In each fold of cross validation, we per-formed 90%-bagging on the training set 10 times to get the variance estimations of the local model. For each example in the test set, we set the final output on it to be the average of the 10 outputs, and recorded the standard deviation of the outputs on this example which is used dur-ing the model combination. We also conducted the same process for the global model for the sake of combination process described below.
4.3 Combing with the Global Model
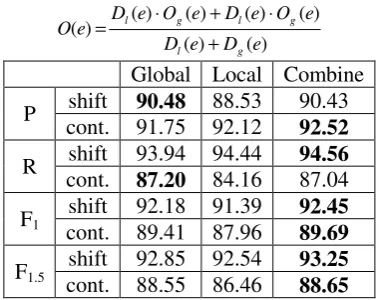
Since the predictions of both the local and the global models are probability estimations, it is reasonable to combine them using linear combi-nation. For each example, there are two outputs
Ol and Og coming from local and global models
accordingly. For each example e of a user’s sub
dataset U, we have the outputs Ol(e) and Og(e)
Global Local Combine
P shift 90.48 88.53 90.43
local model (bagging) and combined model This combination process is similar to (Osl et al., 2008). Note that the more the deviation of a model is, the less feasible the corresponding model is. We compared the performance of three models: global model, local model, and combined model. The results are summarized in Table 6. All comparisons between different models are statistically significant at 95% level, based on the same bootstrapping settings in sub-subsection 3.4.3. The combined model shows slight (may due to the inferior performance of the local model), yet significant improvement to the global model. In spite of the amount of the improvement, the local model did correct some errors of the global model. It may be not ac-ceptable to build such an expensive combined model for a limited improvement. Nevertheless, the results do show that the variability across different users is exploitable.
5 Discussion and Conclusion
In this paper, we built a learning framework of detecting sessions which corresponds to user’s interest in a query log. We considered two as-pect of a pair of successive queries: temporal aspect and content aspect, and designed eight features based on these two aspects, and the SVM models built with these features achieved
satisfactory performance (92.37% F1-mean on
session shift, 90.25% F1-mean on session
The analysis of the features’ discrimination power was conducted not only among different features, but also within the same feature when applied to different users in the query log. By analyzing the statistics of ROC area values of each of the features based on 37 users in AOL dataset, experimental results showed that there is considerable variability in both these aspects. To make full use of this variability, we built local models for individual user and combine the yielded predictions with those yielded by the global model. Experiments showed that the lo-cal model did make significant improvements to the global model, although the amount was
small (92.45% vs. 92.18% F1-mean on session
shift, 89.69% vs. 89.41% F1-mean on session
continuation).
In future studies, we will explore other learn-ing frameworks which better integrate the local model and the global model, and will try to ac-quire more data to build local models. We will also analyze more deeply the characteristics of ROC analysis in the feature selection process.
Acknowledgement
This work is supported by the Key Project of Natural Science Foundation of China (Grant No.60736044), and National 863 Project (Grant No.2006AA010108). The authors are grateful for the anonymous reviewers for their valuable comments.
References
Chang Chih-Chung and Chih-Jen Lin. 2001. LIBSVM : a library for support vector machines. Software available at http://www.csie.ntu.edu.tw/~cjlin/libsvm
Downey Doug, Susan Dumais, and Eric Horvitz. 2007. Models of searching and brows-ing: languages, studies, and applications. In Pro-ceedings of the 20th international joint conference on Artificial intelligence, pages 2740-2747, Hy-derabad, India.
Gayo-Avello Daniel. 2009. A survey on session de-tection methods in query logs and a proposal for future evaluation, Information Science 179(12):1822-1843.
He Daqing and Ayse Göker. 2000. Detecting Session Boundaries from Web User Logs. In BCS/IRSG 22nd Annual Colloqui-um on Information Re-trieval Research, pages 57-66.
He Daqing, Ayse Göke, and David J. Harper. 2002. Combining evidence for automatic web session identification. Information Processing and Man-agement: an International Journal, 38(5):727-742.
Jansen Bernard J., Amanda Spink, Chris Blakely, and Sherry Koshman. 2007. Defining a session on Web search engines: Research Articles. Journal of the American Society for Information Science and Technology, 58(6):862-871
Jones Rosie and Kristina Lisa Klinkner. 2008. Be-yond the session timeout: automatic hierarchical segmentation of search topics in query logs. In Proceedings of the 17th ACM conference on In-formation and knowledge management, pages 699-708, Napa Valley, California, USA.
Murray G. Craig, Jimmy Lin, and Abdur Chowdhury. 2007. Identification of user sessions with hierar-chical agglomerative clustering. American Society for Information Science and Technology, 43(1):1-9.
Osl Melanie, Christian Baumgartner, Bernhard Tilg, and Stephan Dreiseitl. 2008. On the combination of logistic regression and local probability esti-mates. In Proceedings of Third International Con-ference on Broadband Communications, Infor-mation Technology & Biomedical Applications, pages 124-128.
Özmutlu Seda. 2006. Automatic new topic identifi-cation using multiple linear regression. Infor-mation Processing and Management: an Interna-tional Journal, 42(4):934-950.
Özmutlu Huseyin C. 2009. Markovian analysis for automatic new topic identification in search en-gine transaction logs. Applied Stochastic Models in Business and Industry, 25(6):737-768.
Pass Greg, Abdur Chowdhury, and Cayley Torgeson. 2006. A picture of search. In Proceedings of the 1st international conference on Scalable infor-mation systems, Hong Kong.
Radlinski Filip and Thorsten Joachims. 2005. Query chains: learning to rank from implicit feedback. In Proceedings of the eleventh ACM SIGKDD inter-national conference on Knowledge discovery in data mining, pages 239-248, Chicago, Illinois, USA.