211
Comparative Study of Batch and Continuous Packed Bed
Bioreactor for Treatment of Dairy Wastewater
Indrajit N. Yadav
Assistant Professor, Department of Chemical Engineering, BVCOENM, Maharashtra, India, indrajityadavpatil @gmail.com
Abstract-The performance packed bed bioreactor performed in batch and continuous process. In batch process, at the aeration time 26 h and initial COD concentration 2991mg/l, the removal efficiency was 73%. For the same aeration time and effluent COD concentration changed from 2991 mg/l to 1576 mg/l, the removal efficiency increased to 81% while in a continuous process, at 26 h hydraulic retention time, effluent COD concentration was 1576 mg/l and air flow rate 1 lpm. The average COD removal efficiency was 83%. When the HRT was reduced from 26 to 10 h removal efficiency decreased to 51%. Similarly, COD removal efficiency in reactor without packing and compared this result with the packed bed bioreactor. The parameters used in packed bed bioreactor like pH, COD concentration, temperature are same for the activated sludge process (ASP).
Index Terms:COD Removal, Dairy Wastewater, Packed Bed Bioreactor, etc.
1.
INTRODUCTIONEnvironmental pollution is an emerging threat and great concern in today’s context pertaining to its effect on the ecosystem. Water is increasingly becoming a scarce resource. Large and small scale users need to take action to conserve it not only because it is prudent practice to do so for their own benefit, but also because it is an active demonstration of their concern about the global pollution and environmental problems. Ever increasing industrialization and rapid urbanization have considerably increased the rate of water pollution. The dwindling supplies of natural resources of water have made this a serious constraint for industrial growth and for a reasonable standard of urban living. The environmental protection agencies have imposed more stringent regulatory prohibitions and they have started more strict vigil along with some non-governmental organizations to protect the environment. This has made the water treatment more expensive and to comply with the discharge quality standard itself, is becoming a huge burden for the industries.
Dairy products are of major importance in the food industry. Despite their economical advantages, these processes have considerable potential for polluting, so one must be aware of the need to treat the wastewater before discharging it. As environmental laws become stricter so new technologies and strategies for wastewater treatment need to be developed. In dairy industries, water has been a key processing medium. Water is used throughout all steps of the dairy industry including cleaning, sanitization, heating, cooling and floor washing and naturally the requirement of water is huge. Dairy wastewater generally does not contain conventional toxic chemicals like those listed under EPA’s Toxic Release Inventory. However, Dairy wastewater is distinguished by the high BOD and COD contents, high levels of dissolved or suspended solids including fats, oils and grease, nutrients such
as ammonia or minerals and phosphates and therefore require proper attention before disposal.
Different processes are use to treatment of dairy wastewater. In last few decades the packed-bed reactors have gained increasing interest compared to the activated sludge process due to their smaller reactor size, higher removal efficiency,
reduced odor annoyance and robustness towards
hydrodynamic variations and toxic shocks in the inlet concentration. Another main feature is the filtration of suspended particles that enables operating the unit without a downstream clarifier which constitutes an intrinsic part of the activated sludge process. In packed bed reactor immobilized cells fixed on the surface of packing material. The immobilization of living cells is a natural phenomenon and this technique has also been adopted and refined by man to construct powerful artificial immobilized biosystems. The performance of these systems can be substantially influenced by mass transfer limitations. The presence of the support provides an additional barrier to mass transfer relative to free cells in a well mixed solution. This tends to lower the overall reaction rate, as well as creating a specific micro-environment around the cells. As a result, packed -bed bioreactors have emerged as an alternative to the traditional activated sludge process.
212
2.
MATERIALS & METHODS2.1 Dairy Effluent
The quantity and quality of dairy effluent significantly depends on the different processes taking place within the dairy industries. These processes are raw material handling, sanitization, heating, cooling, cleaning the floor etc. Dairy wastewater is distinguished by the high BOD and COD contents, high levels of dissolved or suspended solids including fats, nutrients such as ammonia or minerals, phosphates and therefore require proper attention before disposal. In recent times, researchers have shifted their interests in possibilities of reuse or recycling of industrial wastewaters dairy industries are no exceptions.
Dairy wastewater generally does not contain conventional toxic chemicals like those listed under EPA’s Toxic Release Inventory. However, it has high concentration of dissolved organic components like whey proteins, lactose, fat and minerals and it is also malodorous because of the decomposition of some of the contaminants causing discomfort to the surrounding population. To comply with the discharge standard, the dairy industries are practicing an elaborate effluent treatment protocol which is affecting the overall economy of the plant. The dairy waste water was collected from Government Dairy, Pune. Characteristics of raw dairy wastewater are given in table 1
Table-1: Characteristics of raw dairy wastewater Parameter / Source & amount
range, mg/l
Oils and grease 290-1390
Chlorides as Cl 104-190
Nitrogen 62
• Chemical Oxygen Demand (COD)
Open reflux method was follow for determination COD of the sample. Here, the sample were taken and diluted to sufficient
quantity and so this, standard (0.025 N) potassium dichromate along with Mercuric sulphate and silver sulphate were added and concentrated sulphuric acid was poured in the specially prepared COD flasks. This was put on the refluxing plates and then kept for two hours heating. It was then allow cooling and after the cooling adding the indicator, it was titrated against the standard solution (0.2 N) of ferrous ammonium sulphate and the end point noted. COD was calculated as
(A – B) x N x 8000
N – Normality of ferrous ammonium sulphate
• Suspended Solids
Suspended solid were determined by filtering sample and then subsequently drying the water and measuring the differences between the initial and final weights. A glass fiber filter paper was used in the process wherein a measured quantity of oven dried sample and the initial weight of the filter gives the amount of suspended solids present in the sample. Suspended solids were calculated as,
Wt. of dry filter paper – Initial wt filter paper
Suspended Solid = --- Sample volume, ml
• Volatile Suspended Solids
The residue from the suspended solids is ignited to constant weight at 550+ 500c. The remaining solids represent the fixed total, dissolved on suspended solids while the weight loss on ignition is the volatile solids. Ignite residue produced by the method of suspended solids to constant weight n muffle furnace at a temperature of 550+500c have furnace up to temperature before inserting sample usually 15 to 20 min ignition are required let dish or disk as soon as it has cooled to balance temperature. Repeat cycle of igniting, cooling, desiccating and weighing until a constant weight is obtained or until weight loss is less than 4 % of previous at and on be calculated as.
(A - B)
Volatile suspended solids = --- Sample volume, ml
A – Weight of residue + dish before ignition, mg B - Weight of residue + dish or filter after ignition, mg
• PH
213
solution of known strength. Then the sample was poured in the beaker and electrode dipped in it to read the pH of the sample.
3.
EXPERIMENTALA schematic diagram of packed bed bioreactor is shown in fig 1. The reactor was placed vertically on the stand. The reactor made up of glass tube with internal diameter 7 cm and height of reactor 35cm. The reactor is randomly packed with Intalox saddle packing, which is made of ceramic material. Height of packing in the reactor is 23 cm. The sparger was placed at the bottom of the reactor. Aeration pump was used for the air supply in reactor.
An 800ml reactor was used for the experiment out of 300 ml volume occupied by packing material. Thus remaining 500 ml of the bioreactor volume was available for the liquid phase. The reactor was operated as an aerated up flow packed bed reactor during the experiment. The initial COD concentration, pH, suspended solid was measured. The experiment was carried out in batch process and continuous process. The batch reactor was fed with 420 ml wastewater and 80ml well developed bacterial culture. The reactor was conducted at different COD concentrations of 2991, 2130, and 1576 mg/L. Air flow rate 1 lpm, pH of the influent and temperature was concentration. There was no significant COD removal efficiency observed when aeration applied more than 26 h. In continuous process influent COD concentration maintained constant. Well developed bacterial culture mixed with dairy wastewater. For the initial colonization and accumulation, immobilization was conducted without air supply during first two days. After two days, air supply was started with flow rate of 1 lpm. Feed solution containing dairy wastewater of COD were measured. The experiment was performed in temperature range of 25-300c. Similarly process carried in reactor without packing. Feed solution containing dairy wastewater of COD 1576 mg/l. The influent flow rate was 19 cm3/h fed from top of reactor. Air fed form the bottom of reactor at flow rate 1 lpm. Samples were collected from the outlet of the reactor every day and effluent COD concentration and pH were measured.
Fig-1: A schematic diagram of packed bed bioreactor
4.
RESULT AND DISCUSSION4.1 Performance of the reactors in relation to aeration time
The reactor was operated at different aeration time to evaluate oxygen effect on the COD removal efficiency. Fig 2 shows the effect of aeration time on COD. Removal efficiency increased with rise in the aeration time up to 26 h. There was no significant COD removal efficiency observed when aeration was applied more than 26h.
Time of aeration ( h)
Fig-2: The effect of aeration time on the COD removal efficiency
4.2 Performance of the reactors under different COD concentration
The reactor operated under different COD concentration in the range of 1576 to 2991mg/l, whereas time of aeration, pH, and temperature were kept constant. Fig 3 shows that the removal efficiency achieved 77 to 83 % for influent COD concentration 2991 to 1576 mg/l respectively. It shows that at
Influent
Air Pump
Packed Bed
214
the low COD concentration removal efficiency has higher than the higher COD concentration.
Fig-3: Performance of the reactors under different COD concentration
4.3 Performance of reactors in relation to HRT
As described in Fig 4 reduction of HRT from 26-10 h there was decreased the efficiency of the reactors performance. The concentration of effluent COD increased which indicated a reduction in COD removal efficiency. In packed bed reactor removal efficiency was 83 % at Hydraulic Retention Time of 26 h and the COD effluent was less than 281 mg/ l. When the Hydraulic Retention Time decreases from 26 h to 18 h, the COD removal efficiency decreased up to 70% and the COD
effluent was 483 mg/ l. At the 10 h Hydraulic Retention Time
(HRT) COD removal efficiency was decreased up to 51% and the COD effluent increased up to 788 mg/lit.
Fig.-4: Performance of reactors in relation to HRT
4.4 Effect of hydraulic retention time on the effluent suspended solids (SS) concentration and its removal efficiency
The result of HRT on the effluent SS concentration and its efficiency are shown in fig. 5 the initial SS concentration (1925 mg/l) was considerably reduced to 340 mg/l and its removal efficiency was determined to be 82.33% at HRT of 26 h. However when the HRT was shortened to 10 h, the effluent suspended solid (SS) concentration increased rapidly to 1520 mg/l and its efficiency was only 21.03 %. At HRT 18 h the SS concentration was found to be 940 mg/l and removal efficiency was 51.11 %.
4.5 Effect of Organic Loading Rate on COD removal efficiency
The reactor was operated at different organic loading rate from 1.46-3.78 gCOD/l day. Fig 6 shows the effect of organic loading rate on COD removal efficiency. Organic loading rate increased from 1.46 to 3.78 g COD/l d, the COD concentration increased from 281 to 788 mg/l. fig 7 shows that, at the
organic loading rate COD removal efficiency increased from 51 to 83%.
Fig-5: Days versus COD removal efficiency (%)
HRT (h)
215
OLR (mg COD/l day)
100 150 200 250 300 350 400
C
Fig-7: Organic Loading Rate versus COD removal efficiency
4.6 Kinetics of Biological Growth
The performance of biological processes used for wastewater treatment depends on the dynamic of substrate utilization and microbial growth. Need to understand all of the environmental conditions that affect the substrate utilization and microbial growth rate cannot be overemphasized and it may be necessary to control such condition as pH and nutrients to provide effective treatment. The required populations of microorganism are available in reactor, they must be allow to remained in the system long enough to reproduce. This period depends on their growth rate, which is related to the rate at which they metabolized or utilized the waste.
• Logarithmic growth: Batch culture
In batch culture bacteria increases in proportion to their mass in the log growth phase the rate of growth for this phase is defined by the following relationship:
(1)
Where,
- Rate of bacterial growth, mass/ unit volume, time µ - specific growth rate time-1
X – Concentration of microorganism, mass/ unit volume Growth is occurring in a batch system and following relationship is valid
(2)
• Substrate limited Growth
If one of the essential requirements (substrate and nutrients) for the growth were present in only limited amounts, it would be depleted first and growth would cease. In a continuous culture, growth is limited. Experimentally it has been found that the effect of a limiting substrate or nutrient can be defined adequately using the following expression as given by the Monad
(3) Where,
µ - specific growth rate time-1
- Maximum specific growth rate constant, time-1 S - Concentration of growth limiting substrate in solution, mass/volume
Ks - Half velocity constant, substrate concentration at half the maximum growth rate, mass/ volume
If the value of µ from equation (3) is substituted in equation (1) the resulting expression for the rate of growth is
(4)
• Cell growth and Substrate utilization
In the batch growth system, a portion of the substrate is covered to new cells and a portion is oxidizing to inorganic and organic end product. Because the quantity of new cell produced has been observed to be reproducible for a given substrate, the following relationship has been developed between the rate of substrate utilization and the rate of growth:
(5) Where,
– Rate of bacterial growth, mass/volume time.
Y – Maximum yield coefficient measured during any finite of logarithmic growth and defined as the substrate consumed, mass/mass
– Substrate utilization rate, mass/volume time.
On the basis of laboratory studies, Robinsons concluded that yield depends on (1) the oxidation reduction state of the carbon source and nutrients elements, (2) the degree of polymerization of the substrate, (3) pathway of metabolism, (4) the growth rate, and (5)various physical parameters of the resulting expression is
(8)
• Effect of endogenous metabolism
216
are lumped together, and it is assumed that the decrease in cell mass cause by them is proportional to the concentration of organisms present. This decrease is often identified in the literature as the endogenous decay. The endogenous decay term can be formulated as follows.
(9)
Where,
– Endogenous decay coefficient, time-1 X – Concentration of cells, mass/volume
When equation (9) combined with equation (4) and (5), the following expressions are obtained for net rate of growth.
(10)
X (11)
Where,
- Net rate of bacterial growth, mass/ volume time The corresponding expression for the net specific growth rate is given by equation
(12) Where,
- Net specific growth rate, time-1
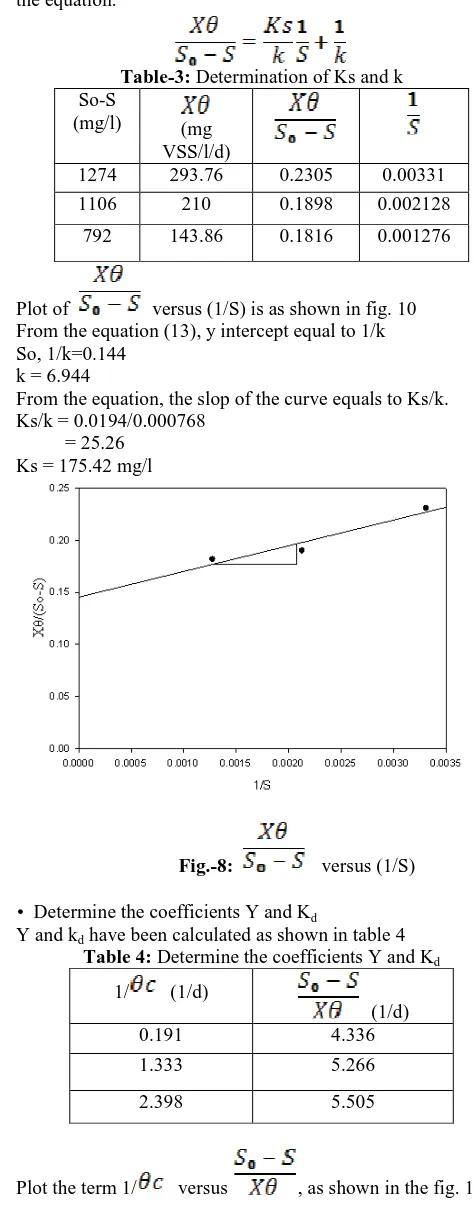
• Determination of kinetic Constants
Values for the parameters Y, k, Ks and kd must be available for a parameter model to be used effectively. The linearized form of eqn. which is used to determine the constant is given as
(13)
The values of Ks and k can be determined by plotting the term
[ versus (1/S). The values of Y and kd
may be determined by plotting (1/ ) versus ( ).
The slope of straight line passed through the plotted experiment datum points is equal to Y, and the intercept is equal to kd. From the values obtained from the experimental observations, the kinetic constants have been evaluated as shown in the table 2
Table-2: Kinetic Constants So (mg/l)
influent COD
S (mg/l) Effluent COD
c (Day) Detention
time
X (mg/l) mass of microorganism
1576 302 1.088 270
1576 470 0.75 280
1576 784 0.417 345
• Determination of Ks and k
Ks and k have been calculated as shown in the table 3 using the equation.
Table-3: Determination of Ks and k So-S
(mg/l) (mg
VSS/l/d)
1274 293.76 0.2305 0.00331
1106 210 0.1898 0.002128
792 143.86 0.1816 0.001276
Plot of versus (1/S) is as shown in fig. 10 From the equation (13), y intercept equal to 1/k So, 1/k=0.144
k = 6.944
From the equation, the slop of the curve equals to Ks/k. Ks/k = 0.0194/0.000768
= 25.26 Ks = 175.42 mg/l
Fig.-8: versus (1/S)
• Determine the coefficients Y and Kd
Y and kd have been calculated as shown in table 4 Table 4: Determine the coefficients Y and Kd
1/ (1/d)
(1/d)
0.191 4.336
1.333 5.266
2.398 5.505
217
From equation 14 above, y intercept equals (-kd) -kd = -0.311
kd = 0.311
From equation 14, the slope of the curve equals to Y 0.6/0.69 = slope
The result obtained for the packed bed reactor showed that the system effectively removed COD of dairy wastewater. The reactor achieved a COD removal efficiency of 83% at 26 h hydraulic retention time (HRT) and an air flow rate of 1 lpm. Reactor operated without packing the COD removal efficiency decreased up to 51% at same hydraulic retention time (HRT) and air flow rate as in packed bed. It showed that packing material in reactor supported the aerobic microorganism’s growth and formed the biofilm which responsible of high removal efficiency of COD in wastewater treatment. Packing offered higher surface area allowing high dissolved oxygen (DO) concentration.
Reduction of HRT affected the reactor performance. COD removal efficiency decreased from 83 to 51%, when HRT decreased from 26 to 10 h. It showed COD removal efficiency decreased with decreased hydraulic retention time (HRT). This could be due to the wash out of bacteria from reactor. Similarly when organic loading rate decreased from 3.78 to 1.46 g COD/l day COD removal efficiency increased from 51 to 83%.
An aeration time also affect the COD removal efficiency. An aeration time increased the COD removal efficiency. The increase was up to certain limit after that there has been no
effect on COD removal. Result showed at 6 h aeration time COD removal 38% and at 26 h it more than 80%.
COD removal efficiency also affected when influent COD concentration changed. When influent COD concentration changed from 2991 to 1576 mg/l removal efficiency increased from 77% to 81 %. It showed that at low COD concentration removal efficiency increased.
The Suspended Solid concentration was considerably reduced from 1520 to 340 mg/l, at HRT increased from 10 to 26 h. Result showed as effluent removal efficiency of suspended solid increased with increased in hydraulic retention time.
REFERENCES
[1]. Abdulgader, M.E. et al, 2007, A review of the performance of aerobic bioreactors for treatment of food processing wastewater, International Conference on Environmental Management, Engineering, Planning and Economics, pp.1131-1136.
[2]. Bandpi, A.M., 2004, Biological Treatment of Dairy Wastewater by Sequencing Batch Reactor, J Env Health Sci Eng, 1, pp.65-69.
[3]. Casey,E. et al,1999, Oxygen mass transfer in a
membrane-aerated biofilm reactor, Biotechnol
Bioengineering, 62, pp.183-192.
[4]. Esquivel, F.M. et al 2008, Performance of a packed reactor with opuntia imbricate for municipal wastewater treatment, Environmental Research Journal, 2, pp.238-245.
[5]. Garrido, J.M. et al,2001,Carbon and nitrogen removal from a wastewater of an industrial dairy laboratory with a coupled anaerobic filter-sequencing batch reactor system, Water Science and Technology, 43, pp.249–256. [6]. Gerrard, A.M. et al,2006,Simple Models for the
Continuous Aerobic Biodegradation of Phenol in a Packed Bed Reactor, Brazilian Archives of Biology and Technology, 49, pp.669-676.
[7]. Gutiérrez, M.S. et al, 2006, Carbon and nitrogen removal from dairy wastewater in a laboratory sequential batch reactor system, 2nd Mercosur Congress on Chemical Engineering.
[8]. Jena, H.M. et al, 2005, Comparative study of
immobilized cell bioreactor for industrial wastewater treatment, WMCI-2005, NIT Rourkee.
[9]. Kariminiaae-Hamedaani et al, 2003, Wastewater
Treatment with Bacteria Immobilized onto a Ceramic Carrier in an Aerated System, Journal of Bioscience and Bioengineering, 95, pp.128-132.
[10].Park, Y.S. et al, 1998, Wastewater treatment in a packed-bed reactor in immobilized cells onto new ceramic carrier, Biotechnology techniques, 12, pp.459-462. [11].Raj, S.A. et al, 1999, Comparison of the trickling filter
218
[12].Ronnie, G. et al, 1994, Effectiveness factor calculation for immobilized growing cell systems, Biotechnology Techniques, 8, pp.695-700.
[13].Sarkar, B. et al, 2006, Wastewater treatment in dairy industries possibility of reuse, Desalination, 195, pp.141–152.