Full Terms & Conditions of access and use can be found at
http://www.tandfonline.com/action/journalInformation?journalCode=tgsi20
Geo-spatial Information Science
ISSN: 1009-5020 (Print) 1993-5153 (Online) Journal homepage: http://www.tandfonline.com/loi/tgsi20
A review of remote sensing applications for oil
palm studies
Khai Loong Chong, Kasturi Devi Kanniah, Christine Pohl & Kian Pang Tan
To cite this article: Khai Loong Chong, Kasturi Devi Kanniah, Christine Pohl & Kian Pang Tan (2017) A review of remote sensing applications for oil palm studies, Geo-spatial Information Science, 20:2, 184-200, DOI: 10.1080/10095020.2017.1337317
To link to this article: https://doi.org/10.1080/10095020.2017.1337317
© 2017 Wuhan University. Published by Taylor & Francis Group
Published online: 28 Jun 2017.
Submit your article to this journal
Article views: 5005
View related articles
https://doi.org/10.1080/10095020.2017.1337317
KEYWORDS
oil palm; remote sensing; monitoring; agriculture; mapping; sustainability ARTICLE HISTORY received 14 february 2017 accepted 14 april 2017
© 2017 Wuhan University. published by taylor & francis Group.
this is an open access article distributed under the terms of the creative commons attribution license (http://creativecommons.org/licenses/by/4.0/), which permits unrestricted use, distribution, and reproduction in any medium, provided the original work is properly cited.
CONTACT Kasturi Devi Kanniah kasturi@utm.my
A review of remote sensing applications for oil palm studies
Khai Loong Chonga, Kasturi Devi Kanniaha,b , Christine Pohlc and Kian Pang Tana
afaculty of Geoinformation and real estate, Universiti teknologi malaysia, Johor Bahru, malaysia; bcentre for environmental sustainability
and Water security (ipasa), research institute for sustainable environment (rise), Universiti teknologi malaysia, Johor Bahru, malaysia;
cinstitute of computer science, University of osnabrueck, osnabrueck, Germany
ABSTRACT
Oil palm becomes an increasingly important source of vegetable oil for its production exceeds soybean, sunflower, and rapeseed. The growth of the oil palm industry causes degradation to the environment, especially when the expansion of plantations goes uncontrolled. Remote sensing is a useful tool to monitor the development of oil palm plantations. In order to promote the use of remote sensing in the oil palm industry to support their drive for sustainability, this paper provides an understanding toward the use of remote sensing and its applications to oil palm plantation monitoring. In addition, the existing knowledge gaps are identified and recommendations for further research are given.
1. Introduction
The oil palm (Elaeis guineensis) is a species of palms planted extensively in South-East Asia, especially in Indonesia, Malaysia, and Thailand. It has the highest oil-yielding capability among other oil crops, such as soybean, rapeseed, and sunflower. Palm oil has become the most consumed vegetable oil in the world (35% as of 2016) (see Figure 1). With the increasing demands of vegetable oil, much land was converted to oil palm plantations including existing arable land, especially in two major oil palm-producing countries, i.e. Indonesia and Malaysia. The combined areas of these countries cover 17.0 Mha of land as of 2015 (see Figure 2). The cultivation of oil palm across the tropical countries raises a controversy because, on one hand, oil palm production is a major economic factor, but on the other hand, it endangers biodiversity and degrades the environment with a global impact (Koh and Wilcove 2008).
Oil palm is adapted to the humid tropical climate with a high precipitation rate, high solar radiation, and warm temperature of 24–32 °C (Corley and Tinker 2008). It has a distinct feature with a visible crown and a sin-gle-stemmed trunk. The fronds or spears emerge from the trunk apex and are extended outward spirally with eight fronds forming a rank in succession. It shapes like an eight-pointed star from a bird’s eye view. The oil palm is a perennial tree crop, which better resembles a forest tree than other agricultural crops (McMorrow 2001). As an industrial crop, oil palms are planted in monoculture fashion. In most commercial plantations, the majority of
planted oil palms are tissue culture clones with a small mix of hybrid oil palms (i.e. Dura X Pisifera), which makes the oil palms appear uniform except for anom-alous palms. This unique pattern makes oil palms dis-tinguish from other trees or forest in satellite imagery (Shafri et al. 2011).
Due to economical and practical reasons, an oil palm plantation can be divided into blocks/fields which include immature planting and mature planting to facil-itate the conduct of planting operations. Immature oil palms are young palms of not more than 5 years old after field planting. The oil palms are planted in triangular patterns with nine meter inter-planting distance (see Figure 3), which is an industrial standard to maximize yield with optimal sunlight penetration (Basiron 2007). A planting density of 130–140 palms per ha is usually practiced but it varies according to the planting con-ditions and the type of oil palm breeds (Corley 1973; Corley and Tinker 2008). For hilly areas, terrace plant-ing is employed as a countermeasure to run off water and to maximize planting density (Shafri et al. 2012). A well-managed oil palm plantation conducts planting operations on a daily basis, which includes harvest-ing, manurharvest-ing, prunharvest-ing, and weeding. The successful and efficient conduct of planting operations requires a good layout design where remote sensing could come in handy to provide the necessary information prior to and during the planting process.
Remote sensing is a tool to provide timely, repetitive, and accurate information about the Earth surface at a large coverage. It is a valuable method to monitor the
status and progress of oil palm development. Remote sensing can assist in decision-making for an efficient plantation management and investigate the effects of oil palm plantations on the environment as explained below.
The oil palm is an element of interest for remote sens-ing application since it became one of the persistent ele-ments on the land for agricultural purposes (Naert et al.
1990). Sustainability of oil palm management started to require the use of remote sensing to monitor land Figure 1. Worldwide consumption of vegetable oil.
Figure 2. Historical oil palm area. source: mpoc (2014); Bps (2014). note: area data is not available for the years 2001, 2002, and 2003 for malaysia.
use changes (UNEP 2011) cost-effectively. However, some of the remote sensing applications for oil palms are still at a research and development stage. Current monitoring activities rely on traditional surveying methods. Additionally, academia and industry are not collaborating sufficiently in mutual advancing in palm oil sustainability (Hansen et al. 2015), which may be due to the lack of understanding of the techniques and the sensitive information in the context of successful palm oil production on the industrial side. It is necessary to bridge the gap between academia and industry for an effective use of remote sensing.
Application-oriented researches using remote sensing could generate profits to the industry while testing the potential of remote sensing in oil palm cultivation. These researches intend to solve/mitigate some of the big prob-lems faced by oil palm industry, i.e. illegal deforestation, spreading of disease or pests, nutrient deficiency detec-tion, yield estimadetec-tion, palm counting, and monitoring of oil palm induced environmental degradation. Remote sensing serves as a useful tool to provide early detection and continuous monitoring of these problems.
The effects of oil palm plantations on the environment become a matter of concern in research, governmental institutions, and other agencies, such as the Malaysian Palm Oil Board (MPOB), Roundtable on Sustainable Palm Oil (RSPO), and the United Nations Framework Convention on Climate Change (UNFCC). In essence, they demand that oil palms should be managed respon-sibly and sustainably with a minimum threat to the envi-ronment. Spatial data become increasingly important in this respect as they provide useful geographical informa-tion, which is most needed to monitor the conditions of oil palms at large area coverage. Remote sensing acquires data that provide not only spatial information but also multitudes of application data which can be interpreted into valuable information.
This paper has the following objectives: (1) to provide an overview of applications of remote sensing in the oil palm industry; and (2) to identify knowledge gaps and needed research for effective oil palm monitoring on the basis of remote sensing. The remaining article is organ-ized as follows: the next section starts with a compilation of remote sensing applications in various aspects of oil
palm monitoring, followed by the gaps and recommen-dations for potential use of remote sensing in oil palm plantation monitoring.
2. Applications of remote sensing in oil palm plantation monitoring
In oil palm plantation monitoring, remote sensing has been used in various applications, including land cover classification, automatic tree counting, change detection, age estimation, above ground biomass (AGB) estima-tion, carbon estimaestima-tion, pest and disease detecestima-tion, and yield estimation. The following sub-sections discuss each topic in further details.
2.1. Land cover classification
Oil palm cultivation is a major economic activity in the world. It is important to know the geographical distribu-tion (land cover) of the oil palms for various purposes. Land cover is described as the composition of biophys-ical features on the Earth surface (Jansen and Gregorio
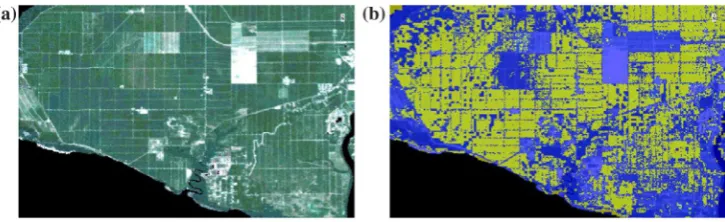
2002). As a distinct feature on the Earth surface, oil palms can be detected by remote sensors. Classifying objects according to their land cover classes helps to delineate the oil palm from its adjacent land cover (eg forest, buildings, bare land, water, and other agricultural plantations) as shown in Figure 4. It allows the demarca-tion of boundaries and accurate estimademarca-tion of oil palm area coverage (Nooni et al. 2014). When applied in a temporal analysis, it is valuable for the detection of oil palm expansion and related land activities.
Optical imagery collects radiation in the visible and near-infrared (NIR) region reflected from the surface. There are different signals collected from the sunlight throughout the electromagnetic spectrums, eg blue, green, red, red edge, NIR, and infrared band, depend-ing on the sensor capabilities to detect them. Different land surfaces produce different intensity levels across the spectrum. By analyzing the reflected energy and classi-fying them using respective spectral signatures, different land cover classes can be identified.
Using the spectral angle mapper, it was found that NIR is the most prominent band in separating oil palm
horizontal–vertical (HV), vertical–horizontal (VH), and vertical–vertical (VV), different information can be obtained about the surface. Such exploitation technique of polarization is known as Polarimetric Synthetic Aperture Radar (POLSAR). At L-band, HH and HV carry most relevant information for oil palm classification (Li et al. 2015). By capturing the polari-metric signature of the land cover with POLSAR, a fairly high overall accuracy was achieved at 76% for land use and land cover (LULC) classification with an airborne dual-frequency (C- and L-band) SAR imaging system (Lee and Bretschneider 2010). They found that the com-plementary nature of both C-band and L-band further increases the accuracy of the classification, which agrees with the conclusion of a similar research conducted by Dong et al. (2015). In a recent study using Sentinel-1
C-band dual-polarization data, the researchers found that a tree cover pixel was considered oil palm if the VV–VH difference was greater than 7.4 dB and the VH backscatter was less than –13 dB (the latter rule to mask out false detections) (Miettinen, Liew, and Kwoh 2015).
The combination or fusion of multidimensional data has the potential to provide a better perspective of the target surface when limitations of either source of data can be rectified (Shen et al. 2013; Pohl, Chong, and van Genderen 2015). It can be a combination of multi-spectral/panchromatic data, multi-spectral/ hyperspectral data, or even multi-temporal data. Due to the unique features of microwave remote sensing with additional information on surface roughness, it often serves as complementary data to optical imagery to improve the classification result (Santos and Messina
2008; Morel, Fisher, and Malhi 2012; Fadaei et al. 2013; Sim et al. 2013). In one particular research aimed to map oil palms in a heterogeneous environment, the authors combined data from Landsat and Phased Array-Type
L-band Synthetic Aperture Radar (PALSAR) and man-aged to achieve overall higher accuracy for oil palm (94%) compared to the standalone data-set (Landsat: 84%; PALSAR: 89%) (Cheng et al. 2016). Apart from the combination of radar–optical, the fusion of LiDAR (light detection and ranging) and optical data have been applied in oil palm mapping. LiDAR, being known for its very high spatial resolution data, is capable of deriving 3D information (canopy height and terrain elevation). When it is fused with an optical image, it provides a 3D perspective of current conditions of the oil palm plan-tation which is very useful for planplan-tation management and planning (Razi, Ismail, and Shafri 2013). Besides, the application of LiDAR can help realize automatic palm counting and disease analysis.
In a general sense, land cover classification is car-ried out by classifying pixels of similar attribute/value depending on the used classifier. Each pixel is then assigned with a specific class across the image, which is known as a pixel-based classification approach. By crowns from background by giving the highest
con-trast consistently (Shafri et al. 2011). In another study, a spectral separability test was carried out using the Bhattacharyya Distance to find out the strongest sep-arability classifier by statistical measure. It was shown that the spectrum of the red (band-3), near-infrared (band-4), and mid-infrared (band-5) wavelength regions of Landsat 7 ETM + display the most identifiable sep-arability for oil palms. This may be due to strong chlo-rophyll absorption in the red band region and strong water absorption in the infrared band region (Nooni et al. 2014). The combined analysis of these bands by comparing the result further increases the spectral sep-arability of oil palms from their surrounding land cover. By transforming specific band values, we can obtain vegetation indices that describe vegetation by its greenness. The most common parameter in use is the Normalized Difference Vegetation Index (NDVI), which is a normalized ratio of near infrared to visible red. It is a versatile and powerful indicator to differen-tiate vegetation from non-vegetation. In a study to find out the best performing vegetation indices to separate oil palms from its background, it was found that the Normalized Difference Index (NDI) displays the highest discriminating power using a histogram dissimilarity metrics (Srestasathiern and Rakwatin 2014). NDI is a normalized ratio of green to red band. The study was conducted using high-resolution Quickbird imagery with four multi-spectral bands (blue, green, red, NIR). Nevertheless, the success of the discrimination often depends on the spectral dissimilarity between oil palm and other features in the study area.
Microwave remote sensing, as a form of active remote sensing, is capable of delivering imagery independent of weather or daylight conditions by generating its own irradiation with the ability to penetrate the surface. It solved the problem of cloud cover of optical remote sensing, which is a common hindrance, especially in tropical countries where oil palms are mostly planted. It generates information based on the backscattered energy from the ground surface. A longer wavelength of microwave has higher penetrative power. Besides, the texture information of the illuminated target can be collected by measuring the neighboring pixels. This information could be used to distinguish a smooth sur-face (eg water, soil) from a rough sursur-face (eg shrubs, trees) with reference to its radar wavelength (Daliman et al. 2014). Therefore, L-band (at 30–15 cm wavelength) is considered to be most efficient in mapping forested vegetation and oil palms as it can penetrate tree canopies and provide information of the sub-canopy structures (Teng et al. 2014; Ibharim et al. 2015). With these valu-able attributes, microwave remote sensing has been used in the classification of oil palm.
identify land cover changes to see if the oil palm planta-tions were previously converted from high conservation value (HCV) forest as an effort to conserve and protect natural resources and biodiversity (RSPO 2007). HCV forests are biologically, socially, or culturally valuable, which are considered significantly and critically impor-tant at the national, regional, or global level (Jennings et al. 2003). Remote sensing is employed to monitor the unauthorized land conversion. The perpetrator is sup-posed to be suspended from their sustainability certif-icate or penalized with heavy compensation (Tan et al.
2009). As demands arise, non-governmental organiza-tions (NGOs) are employed to provide remote sensing services to monitor and audit land cover change as a compliance to RSPO standard (RSPO 2007).
The implementation follows an analysis of the land cover map through a period of time to identify whether any land has been turned into oil palms. This usually involves the usage of archived data to compare the con-ditions of before and after. The changes can be visual-ized using change detection analysis of standard remote sensing packages. The visualization can reveal the rate of deforestation, urbanization, and the expansion of oil palm plantations. The accuracy of change detection often relies on the accuracy of the land cover map, which is produced through classification using single or multiple data sources.
An investigation in New Britain, Papua New Guinea has estimated the local deforestation rate using only optical data. The study utilized archived data of Landsat Thematic Mapper (TM) from 1989 to 2000 to develop a classified land cover map, which is cross-verified with high-resolution QuickBird images. They found that there is a 12% forest loss over the period of 11 years (1989–2000), while 11% (estimated 320 km2) of the land cleared has been converted into oil palm plantations (Buchanan et al. 2008). This study has uncovered the staggering amount of forest loss within a short period. This knowledge can help the local government to act by enforcing strict laws and regulations.
Peat land is one of the sensitive areas that trigger a lot of controversies and debates. Peat land is a natural trap of CO2 and the conversion of peat land to oil palm could release a substantial amount of greenhouse gases into atmosphere (Pittman et al. 2013). Nevertheless, in an economic sense, when land resources are scarce, peat land are often treated as an alternative candidate for oil palm expansion so long as the sustainable and proper management practices are in place (Othman et al. 2011). However, the economic benefits that they bring do not outweigh the harmful effects of the carbon release in the form of global warming. Numerous studies show that the carbon emission from drained peat land con-tributes significantly to the accumulation of greenhouse gases to which point carbon debt could no longer be justified and compensated (Fitzherbert et al. 2008; Tan merging pixels with similar value, regions of multiple
scales can be clustered and classified based on its texture, context, and geometry (Blaschke 2010). It is known as the object-based image analysis (OBIA). This approach gains ground as it produces more meaningful, discrete, and accurate information. In one study, the object-based classification is found to be more accurate than pixel-based analysis (overall accuracy of 81.25% and 76.67%, respectively) using a support vector machine (SVM) classifier for the land cover of oil palm, rubber, urban area, soil, water, and other vegetation (Jebur et al.
2014). Nevertheless, it should be noted that an object-based approach is a complicated process and requires expert inputs and information to be effective.
At a smaller scale, satellite data from the Moderate-Resolution Imaging Spectroradiometer (MODIS) can produce land cover maps with a spatial resolution of 1 km and a global coverage within 1–2 days to monitor global earth dynamics and vegetation growth rate. This enormous coverage could easily map the entire region of oil palms where it is classified as evergreen broadleaf tree (EBT). However, the coarse resolution is not enough to produce finer class division as there are more than one single class existing in a single pixel (1 km × 1 km). As pointed out, additional classification effort is needed to improve the accuracy of the land cover map and to reduce the error for subsequent applications (Cracknell et al. 2015). For such purpose, MODIS data was inte-grated with ALOS high-resolution data to map forest types which include rubber, oil palms, and forest using unsupervised classification techniques (Razali et al.
2014), i.e. iterative self-organizing data analysis tech-nique (ISODATA) and k-means. The authors managed to achieve good accuracies ranging from 57% to 94% with mixed agricultural sites being less accurately clas-sified compared to the monoculture sites.
2.2. Change detection
With the performed classification, change detection is feasible through a multi-temporal analysis. Forest has been irresponsibly cut down in favor of oil palms for their lucrative return. The expansion of oil palms is known as one of the leading causes of deforestation and degradation of environment (Koh and Wilcove 2008), which leads to deterioration of biodiversity, disruption of the carbon cycle and social issues. Nevertheless, it should be noted that not all oil palm land conversion are deemed as inappropriate. Some fallow or degraded lands are even encouraged to be converted to oil palm to maximize palm oil production as long as social and environmental factors are taken into account. In the con-text of oil palm monitoring, the detection of oil palm expansion and its impact becomes the focus of change detection-related research.
good quality, of very high spatial resolution, and with obstruction-free view. Aside from that, it is worthy to mention that this particular area for the research of tree counting is a good start to the implementation of precision agriculture in the oil palm industry. This goes beyond the site-specific and tree-specific treatment of oil palms to improve yield and reduce costs of maintenance. While eliminating over-spending problems, it reduces the wastage of fertilizers and chemicals (pesticides and herbicides) which is beneficial in terms of environmental protection.
A considerably high spatial resolution image is nec-essary to discriminate oil palms at individual tree level. Using airborne hyperspectral data with high spatial res-olution (1 m), a scheme was set up to employ several approaches, namely texture analysis, edge enhancement, morphology analysis, and blob analysis to carry out automatic tree counting (Shafri, Hamdan, and Saripan
2011). In texture analysis, the gray-level co-occurrence matrix is used to describe the oil palm area uniquely. Then, edge enhancement is carried out to delineate edges of the area with contrast of intensities using a Sobel filter before oil palms are segmented with a threshold. The shapes of the extracted oil palm trees are refined by mor-phology reconstruction, which involves the erosion and dilation of irregular shapes to form a more meaning-ful representation of oil palms and separate them from undesirable parts. Finally, the number of oil palm trees is counted by analysis of the connected pixels on the identi-fied centroid using a blob analysis. The authors managed to achieve a counting accuracy of 95%. A recent study aimed to provide a simple and user-friendly approach for oil palm detection and counting. It employs simi-lar steps, which include the implementation of a Sobel edge detector, texture analysis co-occurrence, dilation, eroding, high-pass, and opening filters. The researchers were able to achieve an equally good overall accuracy of 90%–95% (Santoso, Tani, and Wang 2016).
A different approach to detect oil palms is based on the hypothesis of local peak detection where each peak indicates the highest point of each tree based on the anal-ysis of the discriminating power of a vegetation index (Srestasathiern and Rakwatin 2014). A counting accu-racy of 90% was achieved based on the F-measure assess-ment, which is defined as “the (weighted) harmonic mean between precision and recall” (Srestasathiern and Rakwatin 2014). This approach is cost-effective as it relies on high spatial resolution (0.6 m) multi-spectral data from a satellite platform (Quickbird).
Because tree counting applications rely heavily on high spatial resolution imagery, and a large coverage is not always necessary (depends on the size of the plan-tation), unmanned aerial vehicle (UAV) becomes a popular alternative to generate information (Hoffmann et al. 2016). UAV applications in oil palms have already become a commercially practiced norm in major et al. 2009; Pittman et al. 2013). Therefore, the existing
peat land should be subjected to close monitoring to pre-vent unauthorized planting of oil palms in these lands. Remote sensing plays a significant role to provide mon-itoring through time-serial analysis to detect changes in a consistent fashion.
A study was conducted in Sarawak, Malaysia where the conversion of peat land to oil palm plantations were analyzed using multi-sensory (ALOS-PALSAR coupled with Landsat) satellite data. Utilization of multi-sensory data has the advantage of being more accurate and flexi-ble as it combines the distinct information from two dif-ferent sources. This large impact study was performed by SarVision (a private remote sensing service provider) in Sarawak from 2005 to 2010 (Wielaard 2011). The study revealed that 41% of the peat land in Sarawak had been converted into oil palm plantations, and the trend was ongoing. The use of remote sensing enabled an accurate estimation of oil palm expansion on peat land. Close monitoring on the vegetation status is possible so that a timely response could be made.
Indonesia, as the biggest palm oil producer in the world, contributes heavily to the rapid deforestation. A study to assess the expansion was conducted in Kalimantan, Indonesia through a NASA funded pro-gram using 35 pieces of Landsat-5 TM and Landsat 7 Enhanced Thematic Mapper Plus (ETM+) at 30-m res-olution (Pittman et al. 2013). Through the digitization of the map, it was found that the area of oil palm has increased from 900 to 31,600 km2 from 1990 to 2010 in Kalimantan. The ultimate goal of the change detection studies is to inform the general public about the expan-sion of oil palms and its effects on the environment. This information could serve as a whistle blower to the regu-latory agencies to take necessary actions.
2.3. Tree counting
Tree counting is an important and necessary practice for yield estimation and monitoring, replanting and layout planning, etc. However, it is a costly and a labor-inten-sive practice to be carried out on field level. It is prone to human error. Most plantations have resorted to estimate the figures by multiplying total area with the number of palms per hectare, which obviously is not accurate due to heterogeneity of the land surface (hilly, undulated, or flat) and features (river, land, or forest). Remote sens-ing is a solution to this issue as it provides a bird’s eye view of the plantation and a way of counting the trees automatically.
Duren, and van Leeuwen 2015). Thus, gathering this information through the application of remote sensing is deemed to be more effective. It is also applicable on the area where oil palms of different ages are found as a result of filling up vacant spots with extensive supply palms. These areas will consist of oil palms with uneven stages of growth.
As oil palms grow, they develop allometric growth where their body parts grow at different rates. These physical structures of the oil palm could be measured individually. They are known as biophysical parameters, some of which are known to correlate with the growth stages of the oil palm (young, mature, and old) or could even be discriminated to discrete age classes. These bio-physical parameters include leaf area index (LAI), crown projection area (CPA), and height of the oil palm. These biophysical parameters could be detected by remote sen-sors. They are manifested through shadow, roughness, and spectral response (McMorrow 2001).
LAI is defined as “the area of one-sided leaf tissue per unit ground surface” (Watson 1947). The basic idea of LAI is to describe the structure of the trees by measuring the denseness of the leaves surface in a canopy, which could result in efficient light, air, and water interception. As oil palms age, more fronds and leaves will be formed around the crown and cause the LAI to increase. Thus, this relationship makes LAI a useful characteristic in oil palm age estimation.
To measure LAI, direct methods like harvesting are exhaustive, difficult, and destructive. Indirect methods are favorable as they provide non-destructive and eas-ier alternatives with reliable results (Breda 2003). The indirect methods to extract LAI can be done using a specialized LAI meter (e.g. LAI-2200 plant canopy ana-lyzer) or by taking hemispherical images from beneath the canopy. Both of them produce leaf–ground area ratio that can then be related to the actual leaf area cover-age of an oil palm beneath the crown (Tan, Kanniah, and Cracknell 2013). In ground measurements, an oil palm’s LAI shows a positive relationship with age, from 0.6 (young, 2 years old) to 4.0 (mature, 10–14 years old) and stabilizes thereafter (McMorrow 2001; Awal et al.
2004; Tan, Kanniah, and Cracknell 2013, 2014). Using a remote sensor, the increase of the LAI in oil palms shows proportional increase in the spectral reflectivity or NDVI during the initial growth stage, but presents little to no increase after it attains full canopy cover due to sensor saturation (Thenkabail et al. 2004; Tan, Kanniah, plantation companies in Malaysia and Indonesia where
each company runs their own UAV team. In a study of tree counting based on UAV platform generated data of an oil palm plantation in Thailand, a method was devel-oped using normalized cross-correlation to detect and remove non-oil palm components (Wong-in et al. 2015). Multi-scale clustering techniques and template match-ing are further implemented to identify individual oil palm from a bush. Using a digital camera mounted on a remote UAV, the accuracy of automatic tree counting achieved 90%.
2.4. Age estimation
Age information is a good indicator for yield predic-tion as it influences the quality and quantity of the fresh fruit bunches (Chemura, van Duren, and van Leeuwen
2015). Besides, it is an important piece of information to complete the allometric equation for the estimation of biomass (Tan, Kanniah, and Cracknell 2013; Chemura, van Duren, and van Leeuwen 2015). This further indi-cates the carbon stock of oil palm and its environmental effects (McMorrow 2001; Tan, Kanniah, and Cracknell
2013). Besides, age information is important to precision agriculture, to detect anomalies among oil palms within a common age group to plan for counteractive man-agement practices and optimize resource manman-agement (McMorrow 2001; Tan, Kanniah, and Cracknell 2013). All in all, accurate information on tree age is important for scientific and practical reasons, for it determines the productivity of a tree.
As oil palms grow in a particular fashion, this mor-phological trait could be utilized to estimate its age. The oil palm trunk thickens in its early growth stage (1–2 years old) and then increases in height rapidly at a later stage without secondary thickening. A mature palm tree normally has a trunk diameter of 40 cm, and an annual height growth of 30−60 cm (Hartley 1967). Nevertheless, these traits are affected by growing con-ditions, and vary between different progenies (Corley and Tinker 2008).
In a standard management practice, oil palm age is usually recorded when the oil palms are first trans-planted into the field by naming the field after its year of planting. Unfortunately, this information is inaccessible for the public and generally too troublesome to gather and verify, especially from smallholders (McMorrow
2001; Tan, Kanniah, and Cracknell 2013; Chemura, van
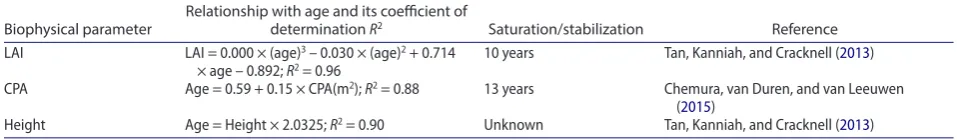
Table 1. relationship of biophysical parameters with age of oil palm using field measured data.
Biophysical parameter Relationship with age and its coefficient of determination R2 Saturation/stabilization Reference lai lai = 0.000 × (age)3 – 0.030 × (age)2 + 0.714
× age – 0.892; R2 = 0.96 10 years tan, Kanniah, and cracknell (2013)
cpa age = 0.59 + 0.15 × cpa(m2); R2 = 0.88 13 years chemura, van Duren, and van leeuwen
(2015)
annually throughout its life cycle, depending on the physical condition, and hereditary aspect (Corley and Tinker 2008). Height information can be retrieved using various approaches of remote sensing, e.g. LiDAR and Interferometry Synthetic Aperture Radar (InSAR). Oil palm height has shown a strong linear relationship with age (Table 1) using only field-measured data (McMorrow
2001; Tan, Kanniah, and Cracknell 2013). The height is proved to be a potentially successful indicator for oil palm age estimation. Other biophysical parameters like diameter at breast height develop an insignificant rela-tionship with oil palm age due to the fact that oil palm trunks do not thicken after the first two years of growth (Corley and Tinker 2008).
Although biophysical parameters theoretically relate well to age of oil palm, it should be noted that it is not always the case. Stress induced by natural events (e.g. flood, drought, storm) or management flaws (e.g. nutri-ent deficiency, pest, and disease) could cause stunted growth on oil palms. This may lead to error in the age estimation. However, these errors could be corrected if ancillary data are provided.
2.5. Estimation of AGB and carbon production
The estimation of AGB provides a snapshot of the amount of carbon that resides in an ecosystem. It is use-ful to serve as an indicator of an effective carbon sink (Brown 1997). As demand grew, oil palms have been planted as a replacement to the natural forest for oil and fats. To justify the conversion of forest for oil palm cultivation, AGB of oil palms is estimated to assess its ability to retaining carbon stock and biomass accumu-lation (Kho and Jepsen 2015).
AGB of oil palms is defined as the combined mass of its trunk and its fronds while excluding its roots (Corley and Tinker 2008). AGB can be measured directly by har-vesting method, which involves felling, cutting, drying, and weighting of the oil palm tree components. This is the most accurate method to assess carbon content but destructive and uneconomical (Sunaryathy et al.
2015). Harvesting method is often used for validating and Cracknell 2013). The saturation might be a result of
pruning practice, which is intended to control the frond counts as a way to optimize nutrient distribution and for hygienic purposes. In addition, harvesting operations conducted regularly reduce the frond counts deliberately (Breure 2010), thereby reducing LAI in general. LAI is useful to estimate oil palm age during early development of oil palms, but is not effective after it reaches maturity stage. With that being said, remote sensing applications, which focus on correlating signals (spectral response, vegetation indices) to LAI, are less effective in estimating oil palm age for mature/older trees.
Another biophysical parameter that can be related to age is CPA. CPA is similar to the percent canopy cover but expressed as the canopy area that is covered by an individual oil palm (McMorrow 2001). As the oil palm is a plantation tree crop and develops a circular crown, the area of the crown can be measured in high-resolu-tion satellite imagery. It is based upon the idea where oil palm’s crown core, rachis edges and its background can be distinguished, segmented, and delineated in high-res-olution multi-spectral data as they contain different responses in the various spectral bands. For instance, the crown core appears brighter than the edges and its background. Oil palm crowns are delineated using object based image analysis and therefore CPA can be calculated. In the field, the oil palm crown projection area is observed to establish a positive linear relationship with age (Table 1). This works for oil palm trees up to 13 years of age by which the value is stabilized and shows no significant relationship thereafter (McMorrow 2001; Chemura, van Duren, and van Leeuwen 2015). Shadow effects, weeds, and intercrops are the main factors that influence the accuracy of this method. Nevertheless, a strong relationship (R2 = 0.81) is found between the field-measured CPA and the processed delineated CPA on satellite imagery. This makes satellite images a reli-able data source for producing CPA by means of image processing.
The oil palm does not stop growing in height. This growth attribute is very valuable in estimating oil palm age. The height of oil palm increase about 30–60 cm Table 2. aGB allometric equation for oil palms.
Allometric equation Reference
W = 725 + 197H Khalid, Zin, and anderson (1999)
where W = fresh weight (kg); H = palm height (m).
Wet weight (kg/tree) = 1.5729 × palm stem height (cm) – 8.2835 (R2 = 0.9746) thenkabail et al. (2004)
Dry weight (kg/tree) = 0.3747 × palm stem height (cm) + 3.6334 (R2 = 0.9804)
aGBtrunk = 100 π (rz)2 hρ corley and tinker (2008)
where ρ = (0.0076x + 0.083)/100; r = radius of the trunk (cm) without frond bases;
z = ratio of trunk diameter below frond bases and measured diameter above frond bases (sample trunks = 0.777); h = height of the trunk (m); ρ = trunk density (kg m−3); x = age of the oil palm.
aGBfrond = 0.102ld + 0.21
where l = length of petiole (cm); d = depth of petiole (cm)
standing biomass (tonne/ha)= –0.00020823 × x4 + 0.000153744 × x3 − 0.011636 × x2 + 7.3219x − 6.3934 Henson and chang (2003)
and the delineation of the oil palm area is crucial for an accurate estimation of biomass (Thenkabail et al. 2004). An optical-based approach like the derivation of vege-tation indices, especially NDVI has been used widely to derive biomass in forest environment (Foody et al. 2001). However, it is noted that the optical-based approach like optical band reflectance and vegetation indices respond poorly to oil palm biomass and tend to underestimate the AGB. This makes the optical approach inappropriate to estimate the biomass due to its saturation at high bio-mass value (Morel, Fisher, and Malhi 2012; Singh, Malhi, and Bhagwat 2014b). However, in another study, a tex-ture-based approach was implemented with the appli-cation of Fourier transform texture ordination (FOTO) with SPOT-5 data and managed to solve the saturation issue (Singh, Malhi, and Bhagwat 2014a). This included a combination of two techniques, i.e. Fourier transform to convert intensity signal into sinusoidal waves of different spatial frequencies and texture ordination with principle component analysis.
The estimation of the biomass relies on the estima-tion of vegetaestima-tion volume. Radar remote sensing could take advantage of its penetrative nature to derive struc-tural information to estimate AGB. As oil palm trunks and its primary branches make up most of its biomass,
L-band data are considered the most significant source of data in estimating AGB (Morel et al. 2011; Shashikant et al. 2012). However, there are a lot of parameters (soil moisture, terrain roughness) that affect the radar backscattered signal, thus direct inversion of signals to AGB could lead to inaccurate estimates (Quinones and Hoekman 2004). Nevertheless, preliminary studies have shown that AGB of oil palm correlates strongly with HV polarization at L-band (Nordin 1996; Shashikant et al.
2012). Further in-depth investigation is required to pro-vide solid epro-vidence with consideration to the affecting parameters.
the estimation of biomass or to develop an allometric relationship and equation in pioneer studies through extensive empirical observations. An allometric equa-tion relates the AGB to biophysical variables (Refer to Table 2). The use of the allometric equation makes bio-mass estimation straightforward and non-destructive. As AGB is normally estimated at the value of tonne per hectare, the derived AGB is extrapolated to reflect the AGB of a larger area, which produces a rough estimate of the oil palm biomass.
Allometric equation calculates biomass using various biophysical parameters (i.e. height of trunk, diameter at breast height, ages, length, and depth of petiole). There are already several established equations as shown in Table 2. With the comprehensive parameters, Corley and Tinker’s equation remains the most reliable equation to derive biomass at field level. The derived value is then projected over all trees to calculate actual oil palm bio-mass which also relies on the planting density (Kho and Jepsen 2015).
From the perspective of remote sensing, there are many methods and ways to estimate biomass, especially in a forest environment. The biomass can be related to remotely sensed data like optical bands reflectance, veg-etation indices, texture analysis, radar backscatter sig-nals, polarimetric response, or height data derived from LiDAR, InSAR, and so on (Foody et al. 2001; Englhart, Keuck, and Siegert 2011; Cartus, Santoro, and Kellndorfer
2012; Askne et al. 2013). Because a forest landscape is structurally different from an oil palm plantation and to narrow the scope limited to the purpose of this review, we only discuss the techniques carried out in an oil palm sce-nario in this paper. Relationships of the remotely sensed data and AGB of oil palm are shown in Table 3.
Because areas of vegetation consists of different fea-tures (e.g. forest, logged forest, plantation), they have distinct biomass values. Mapping of land cover classes Table 3. relationship of remotely sensed data with aGB of oil palm.
note: nfDi − normalized Difference fraction index.
Source of data and its parameters Regression model Source
IKONOS data Dry biomass (kg m−2) = 0.0046e10.814 × nDVi43; thenkabail et al. (2004)
nDVi and optical band reflectance (Band 3 and 4) Dry biomass (kg m−2) = 1499.3e−66.64 × band 3 reflectance;
Dry biomass (kg m−2) = 1595e−0.0338 × band 3 digital number;
(note: nDVi43 = normalized value of band 4 and 3); accuracy = 64% – 72%
SPOT 5 data Ba=106.37 × (Band 1) – 33.72 × (Band2) + 124.33 × (Band 3)
+ 40.73 × (Band 4) – 130.71; singh, malhi, and Bhagwat (2014b) Vegetation indices and optical band reflectance Ba = –2175.4(Band 4) + 2628.3;
Ba = – 2776(Band 3) + 2817.4;
(note: Ba is the mean biomass in mg/ha; Goodness of fit, R2 =
0.851, 0.833, and 0.800, respectively
SPOT 5 data aGB (mg/ha) = –4773.26 × (pc1) + 5171 × (pc2) – 1817.546
× (pc3) + 61,036.76 singh, malhi, and Bhagwat (2014a) fourier transform textural ordination (foto) (note: pc is the principle component ranking in order of 1, 2,
and 3; Goodness of fit R2 = 0.830)
Landsat ETM+ data aGB (mg/ha) = 0.45(44/12)e((s1 − 0.5877) / 0.029436) morel, fisher, and malhi (2012)
diagnosis of the diseases or pest infestation based on the symptoms shown at specific spots (Shafri and Hamdan
2009; Santoso et al. 2011; Liaghat et al. 2014). Based on the hypothesis that Ganoderma-infected oil palm shows observable symptoms at an early stage, various studies were conducted to discriminate the Ganoderma-infected oil palms.
In one of such studies, a portable field hyperspectral instrument was used to differentiate healthy and infected oil palm (Shafri et al. 2011). A statistical approach was applied to classify diseased plants based on the hyper-spectral reflectance data (range from 460 to 959 nm). Three classes of Ganoderma-infected oil palms were tested, which were categorized into healthy, mildly infected, and severe condition. Based on the reflectance spectra on oil palm leaves, it is harder to separate healthy oil palms from the ones showing mild symptoms, than it is when the condition became severe. In another similar study, field hyperspectral reflectance data were collected. The spectral data (ranging from 325 to 1040 nm) were normalized and smoothed before processed by a princi-pal component analysis to detect and diagnose basal stem rot (BSR) and Ganoderma in oil palms. It was found that the k-nearest-neighbors (kNN)-based model as the best classification model (Liaghat et al. 2014). Both studies show positive results where the healthy and Ganoderma-infected oil palms are classified and segmented with ade-quate accuracy (82% and 97%, respectively). However, it should be noted that both studies were carried out under laboratory condition. The method is not yet operational for airborne application due to the resulting lower spatial resolution of the hyperspectral instrument.
In order to bring the detection of Ganoderma into a larger scale, the use of aerial or satellite remote sensing is necessary. In such an effort, Quickbird high-resolu-tion images were used to map and identify Ganoderma-infected oil palms (Santoso et al. 2011). The spectral reflectance, NDVI and other vegetation indices were tested to discriminate healthy and infected palms. Vegetation indices like NDVI are capable of accentuating the vital signs of the oil palms (chlorophyll level, LAI, branching, etc.). The low vital sign indicates a symp-tom of Ganoderma disease. The authors of this study achieved an acceptable result (coefficient of determina-tion, R2 = 0.62–0.88). However, this is only achievable when the oil palms are showing severe symptoms, which is the late development stage (Stage 4, terminal stage) of the disease, which is of little use. Early detection through remote sensing is difficult. This may be due to several reasons: (1) Oil palm canopy cannot provide a good spectrum of Ganoderma since the floating bodies are developed on the trunk; (2) It requires a stable sunlight and duration to record meaningful spectral signatures.
In contrast to the chronic effect of disease like Ganoderma, pest attack is often more acute and critical, and it requires immediate attention. It is fundamental Carbon stock is calculated to represent the
effec-tiveness of oil palm as a biomass sink. Oil palms form an ecosystem that acts as a productive terrestrial sink, absorbs atmospheric carbon effectively, and produces biomass comparable to that of tropical forest, or more (Lamade and Bouillet 2005). However, the derived value of biomass alone cannot represent the entire scenario throughout the life cycle of an oil palm. One would also need to take into considerations the rate of biomass pro-duction before, during and after the establishment of an oil palm plantation (Tan, Kanniah, and Cracknell 2012), therefore making it a time-serial studies.
The rate of carbon storage of the ecosystem is often represented by quantitative measure, i.e. gross pri-mary productivity (GPP) and net pripri-mary productivity (NPP). GPP is defined as the rate of carbon intake by an ecosystem in the unit of g·cm−2·year−1; while NPP is the value of GPP less autotrophic respiration (growth, maintenance of cells) (Chapin III, Matson, and Vitousek
2011). The common inputs to NPP models include land cover, phenology, surface meteorology, and LAI (Tan, Kanniah, and Cracknell 2012). Remote sensing-based models are shown to be capable of estimating carbon storage, while influenced largely by the solar radiation, vapor pressure deficit, soil moisture deficit, and nutrient deficiency (Tan, Kanniah, and Cracknell 2012).
An empirical model has been developed to estimate the carbon stock of oil palm plantation and the model forms a relationship between band 1 of UK-DMC 2 (United Kingdom Disaster Monitoring Constellation) with the field-measured LAI (Kanniah, Tan, and Cracknel 2012). Fractions of Photosynthetically Active Radiation (fPAR) were then be computed using the estimated LAI. The find-ings were up-scaled and verified against the data from the Moderate-Resolution Imaging Spectrometer (MODIS) and managed to produce good correlation (R2 = 0.70 and 0.66 for fPAR and LAI, respectively). It further suggests that radar could contribute important information regard-ing tree height to complete the list of parameters to esti-mate the productivity of an oil palm plantation.
2.6. Pest and disease detection
view, it is not feasible to observe the fruits from the aerial view, by which we resorted to focusing on the robustness and healthiness of the oil palm as an indication of good yield. Nevertheless, what is observed at the time will only reflect on the yield later when the fruits are nurtured to ripeness. Therefore, the estimation of yield should be taken as a continual temporal analysis as the yield data collected at the time are the reflection of efforts spent for months.
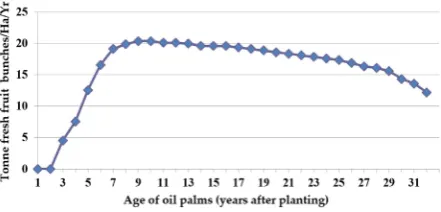
Oil palm yield can be affected by various internal and external factors. The internal factors include age and oil palm breeds/variety while the external factors include rainfall, drought, disease, soil fertility, soil moisture, and harvesting efficiency. Thus, to estimate oil palm yield accurately, there is a need to take all factors into consideration. Nevertheless, a good indicator of yield is the age of oil palm. The relationship of yield of oil palm and age establishes a sigmoid shape (see Figure
5), fitting a nonlinear regression growth model across its life cycle (Khamiz, Ismail, and Muhammad 2005). Thus, by retrieving the age information of oil palms and the total planted area using remote sensing, the total FFB production of the mentioned area can be roughly estimated using a regression model (Khamiz, Ismail, and Muhammad 2005).
In a practical study, oil palm yield was estimated using vegetation indices derived from QuickBird sat-ellite images. The study used archived data distributed across a 12-year time series. It was found that the vege-tation indices correlate strongly with oil palm yield, with the Ratio Vegetation Index (RVI) showing the strong-est relationship (Balasundram, Memarian, and Khosla
2013). The underlying relationship observed might be connected to the increase of LAI in oil palm canopy. It produces higher vegetation indices values. Besides, oil palms which possess denser canopy are generally an indication of robust and healthy growth that leads to better yield performance.
3. Gaps and recommendations for future research
From the review of the publications on oil palm remote sensing, not all applications address the issues of oil palm planting, while some deserve special highlights to dis-seminate broadly. Lots of potential research areas are discussed in the following subsections.
3.1. Multi-sensor approach
First of all, multi-sensor data fusion is very effective in oil palm classification (Santos and Messina 2008; Razi, Ismail, and Shafri 2013; Sim et al. 2013). The improved classification results aid in distinguishing oil palms for further applications like automatic tree counting, change detection, and age estimation. The populariza-tion of open-source data from various types of sensors, to be able to assess the damage and locate the point of
outbreak swiftly to plan for quick remedy actions before the oil palms are damaged to the point of no return. Therefore, a fast-reacting and flexible monitoring sys-tem is often more preferable. A plantation often relies on traditional field survey before remote sensing appli-cations are even applied. Sensors on an aerial platform like UAVs, which could be employed at command with very high spatial resolution and flexible timing, could serve as an excellent alternative for pest monitoring by producing quick and accurate data.
However, the studies of pest control by remote sens-ing are often limited as the pest outbreak is usually rare and short-lived. In a study by Aziz et al. (2012), a plan-tation with severe bagworm infesplan-tation was found. A preliminary study was carried out to identify the infested palms using spectral reflectivity (Aziz et al. 2012). The damage on palm foliar was assessed by measuring spec-tral reflectance using field spectrometer. It was found that the bands centered at 570, 680, 734, 787, 996, and 1047 nm are the most sensitive band regions to detect bagworm infestation. The seriously damaged oil palms show sharp decreases in 734–1047 nm and increases in 570 and 680 nm band regions (Aziz et al. 2012). This information could be useful for future extensive studies using elevated platforms (airborne and spaceborne).
2.7. Yield estimation
As a commodity with a fluctuating market, oil palm yield has to be estimated in order to bring about maximum economic profits by drafting appropriate management strategies. For instance, some plantation companies may choose to replant their oil palms when the price is low, or delay their replanting schedule when the price is high, disregarding the optimum production age of oil palm. Yield estimation, as a preliminary step to yield prediction and forecasting, can aid in the decision-making process.
In the context of remote sensing, vegetation height can be derived airborne or spaceborne. Airborne oper-ation is task-oriented and costly to be carried out, even though it produces more accurate result compared to spaceborne operations. Meanwhile, spaceborne (satel-lites) operation is more cost-effective and has bigger spa-tial coverage. Currently, there are a number of satellites which could provide the capabilities of deriving vegeta-tion height with adequate accuracy. ICESat (Ice, Cloud, and land Elevation Satellite) used a LiDAR instrument on-board satellite to measure vegetation elevation for biomass estimation. ICESat’s measurement of the laser pulse return shape provides unique information about the height distribution of the surface features with each laser footprint, thereby inferring the elevation of ground and the height of vegetation. However, ICESat failed in 2010. Meanwhile, ICESat-2 with the same specification is due to launch in 2017. Tandem-X, a twin satellites constellation, provides the capability to derive vegetation height with the application of InSAR. Numerous studies have been conducted for Tandem-X on forest height esti-mation but it has not yet been implemented on oil palms.
3.4. Handling inevitable oil palm expansion
In future, the demand for vegetable oil is likely to increase, which prompts more lands to be converted into oil palm plantations for the production of sufficient edible oil for the growing population (Corley 2009). The expansion of oil palm areas needs tight monitoring to avoid the further loss of forest and biodiversity (Fitzherbert et al.
2008), especially on the land with high conservation value. On the other hand, the effort of identifying fallow lands that is suitable for oil palm expansion is yet another priority as its conversion to oil palms brings harmless or even beneficial impact to the environment in terms of standing carbon stock (Kho and Jepsen 2015). The identification of these areas could be carried out by clas-sification of remote sensing imagery using specific crite-ria with the discovery of effective remote sensing-based indicator, which is a potential research direction.
3.5. Significant role of yield estimation
Yield estimation through remote sensing is of great interest to the industry because such information could aid in major decision-making. However, currently there are very limited researches on yield estimation partly due to the difficulty to produce sufficient accuracy. As stated before, yield estimation by the measure of fresh fruit bunch is not viable by remote sensing. However, observ-able parameters that indirectly contribute to yield esti-mation can be well investigated. These parameters can be the greenness of the palm canopy (vigor), LAI, height, and soil moisture. Once the relationship is established, an accurate yield estimation model could be produced. Ancillary data like oil palm breeds, rainfall, soil moisture e.g. Sentinel-1, Sentinel-2, ALOS PALSAR, Landsat or
even images from Google Earth make multi-sensor data exploitation a very interesting route for research.
3.2. UAV as a pragmatic monitoring tool for oil palms
Meanwhile, the potential of UAV in the oil palm industry is immense as it provides a self-operated imaging tool, which is capable of providing regular and timely monitor-ing of oil palm plantations. It is especially useful for trop-ical countries where clouds are a serious hindrance for satellite image acquisition. The normal sensor camera can capture an image in RGB, while more advanced sensors (multi-spectral) can capture images in extra bandwidths (e.g. red edge, NIR, shortwave Infrared), making classifi-cation more effective. A drawback of UAVs is their lower coverage since they normally operate at low altitude, i.e. several hundred meters above ground level. Nevertheless, it is sufficient for the operation of small holders, while more could be employed for a bigger plantation. UAV operations require knowledge and skills in flying the plat-form as well as exploiting the images produced. Critical aspects are the flight planning and geometric processing of the acquired data, including correctly positioning of the observations on the Earth surface.
3.3. Demand of non-asymptotic parameters as better indicators of biomass and age
On the estimation of age or biomass, various parame-ters, such as spectral radiance or biophysical parameparame-ters, are saturated or become asymptotic after the oil palm reaches a mature stage at the age of 10. This is mainly due to the stabilization of observable growth of oil palm canopy during this stage, so that no significant differ-ence can be distinguished thereafter from the current perspective of remote sensing. This phenomenon has limited application of remote sensing in retrieving infor-mation for these older group (10 years and above) of oil palms. To maximize the observable relationship from older palms, attention should be given to the parame-ter which changes consistently throughout its life cycle that could establish reliable relationship. In this respect, height information of oil palms can play a major role.
oil palms, leading to lower yield or death, if prolonged. Flood is normally resulting from the poor planning of drainage systems that overlook the problem when oil palms are planted on topographically disadvantaged areas. 3D mapping of the terrain prior to the planting could serve as important information to account for flood-risk areas. Nevertheless, the assessment of risk requires the knowledge of hydrology, geology, and civil engineering, which forms an interdisciplinary research effort with remote sensing, which have not yet been implemented for oil palm plantations.
3.9. Soil as remote sensing-based indicator of oil palms
Another interesting field for future research is the study of soil in oil palm plantations from a remote sensing per-spective. Soil is one of the key factors in the growth of oil palms because it governs the efficiency of nutrients uptake by oil palm and affects yield performance in turn. The characteristics of a good soil can be observed from afar as they develop different responses to the reflected light. For instance, soil moisture content could be picked up by active remote sensing based on the dielectric properties of the backscattered waves (Kang et al. 2016). The inter-action of observed signals with other soil properties like soil type, soil texture, and soil structure could be studied to form empirical relationships with each other, which can help reducing tedious workload of soil sampling.
4. Conclusions
The planting of oil palm is an inevitable trend driven by the demand of the ever-increasing population toward cheaper vegetable oil and biofuel. Research efforts should be channeled toward improving the performance of the industry and reducing the negative environmental effect that it causes. Remote sensing plays a significant role in the monitoring of oil palm industry concerning envi-ronmental and economical aspects. It is useful for the assessment of environmental status and crop condition. It prepares the industry for assimilation of technology like machinery automation and precision agriculture to reduce cost, labor dependency and improve produc-tivity. Many plantation companies had already started using the technology and some of them even have their own operating professional GIS/remote sensing unit. The application of remote sensing helps companies to acquire valuable and otherwise expensive information. Some techniques are already implemented but kept con-fidential or are unpublished as their intention is not for academic publication. Nevertheless, dissemination and knowledge transfer of techniques should be given more attention in order to advance in mutual advantage. More joint research on remote sensing for oil palms between industry and academic experts is needed to provide a content, soil fertility, or occurrence of adverse events
(flood, drought, pest, and disease) have great potential to further improve the accuracy of yield estimation.
3.6. Precision agriculture needs remote sensing
In the future plantation management where operating costs are minimized and profit is maximized, precision agriculture will play an important role. This involves the use of remote sensing (Liaghat and Balasundram
2010). Each palm tree will be precisely monitored. The anomalous palm that has a poor yield can be indi-vidually dealt with. For this to be realized, there is a need for very high-resolution imagery and GPS data to distinguish palms at individual level to identify the problem and to enable a specific treatment. UAV is an option for this application as they provide highest spa-tial resolution and flexible data acquisitions (Koo et al.
2012). A recently launched commercial satellite, i.e. Worldview-4, is capable of providing very high spatial resolution (30 cm) images, and is a potential candidate for contributing information to precision agriculture. Its data could be equally applied in the detection of pest and disease, especially the notorious Ganoderma disease that require early detection and quarantine.
3.7. Unmanaged oil palm as an agent of environmental and health disruptor
On the other hand, oil palm planting had been accused of causing the recent event of forest fires and subsequent event of haze that set off numerous health and environ-mental problems. The extinction of these fires could be enforced more efficiently if the hotspots would be iden-tified earlier. In this context, remote sensing should be considered, i.e. the use of thermal sensors by marking the areas with high temperature. Then, a properly planned response system could be organized for effective fire-ex-tinguishing operations. In an effort to monitor global fire event, NASA formed Fire Information for Resource Management System (FIRMS) which combines the use of MODIS and Visible Infrared Imaging Radiometer Suite (VIIRS) to provide active fire data at the spatial resolution of 375 m. Alongside of NASA, the Copernicus Emergency Management Service (EMS) operated by European Commission provides information on the event of forest fires through its open source service at global scale. With such global coverage, the data could be used to pinpoint the source of fire during the event of forest fires and further research efforts could be admin-istrated to prevent and alleviate the effects of forest fires.
3.8. Flood as common problem for oil palms
Awal, M. A., W. Ishak, J. Endan, and M. Haniff. 2004. “Determination of Specific Leaf Area and Leaf Area-leaf Mass Relationship in Oil Palm Plantation.” Asian Journal of Plant Sciences 3 (3): 264–268.
Aziz, N. A., W. Omar, R. Kassim, and N. Kamarudin. 2012. “Remote Sensing Measurement for Detection of Bagworm Infestation in Oil Palm Plantation.” MPOB Information Series 589. ISSN: 1511-7871. http://palmoilis.mpob.gov. my/publications/TOT/TT-502.pdf
Balasundram, S. K., H. Memarian, and R. Khosla. 2013. “Estimating Oil Palm Yields Using Vegetation Indices Derived from QuickBird.” Life Science Journal 10 (4): 851– 860.
Basiron, Y. 2007. “Palm Oil Production through Sustainable Plantations.” European Journal of Lipid Science and Technology 109 (4): 289–295. doi:10.1002/ejlt.200600223. Blaschke, T. 2010. “Object Based Image Analysis for Remote
Sensing.” ISPRS Journal of Photogrammetry and Remote Sensing 65 (1): 2–16. doi:10.1016/j.isprsjprs.2009.06.004. BPS. 2014. Statistik Kelapa Sawit Indonesia 2014. Jakarta:
Badan Pusat Statistik.
Breda, N. J. J. 2003. “Ground-based Measurements of Leaf Area Index: A Review of Methods, Instruments and Current Controversies.” Journal of Experimental Botany 54 (392): 2403–2417. doi:10.1093/jxb/erg263.
Breure, C. J. 2010. “Rate of Leaf Expansion: A Criterion for Identifying Oil Palm (Elaeis Guineensis Jacq.) Types Suitable for Planting at High Densities.” NJAS – Wageningen Journal of Life Sciences 57 (2): 141–147.
doi:10.1016/j.njas.2010.03.001.
Brown, S. 1997. Estimating Biomass and Biomass Change of Tropical Forests: A Primer. Vol. 134. Rome: Food and Agriculture Organization.
Buchanan, G. M., S. H. M. Butchart, G. Dutson, J. D. Pilgrim, M. K. Steininger, K. D. Bishop, and P. Mayaux. 2008. “Using Remote Sensing to Inform Conservation Status Assessment: Estimates of Recent Deforestation Rates on New Britain and the Impacts upon Endemic Birds.” Biological Conservation 141 (1): 56–66.
Cartus, O., M. Santoro, and J. Kellndorfer. 2012. “Mapping Forest Aboveground Biomass in the Northeastern United States with ALOS PALSAR Dual-Polarization L-Band.” Remote Sensing of Environment 124: 466–478.
doi:10.1016/j.rse.2012.05.029.
Chapin III, F. S., P. A. Matson, and P. Vitousek. 2011. Principles of Terrestrial Ecosystem Ecology. New York: Springer Science & Business Media.
Chemura, A., I. van Duren, and L. M. van Leeuwen. 2015. “Determination of the Age of Oil Palm from Crown Projection Area Detected from WorldView-2 Multispectral Remote Sensing Data: The Case of Ejisu-Juaben District, Ghana.” ISPRS Journal of Photogrammetry and Remote Sensing 100: 118–127. doi:10.1016/j.isprsjprs.2014.07.013. Cheng, Y., L. Yu, A. P. Cracknell, and P. Gong. 2016. “Oil
Palm Mapping Using Landsat and PALSAR: A Case Study in Malaysia.” International Journal of Remote Sensing 37 (22): 5431–5442. doi:10.1080/01431161.2016.1241448. Corley, R. H. V. 1973. “Effects of Plant Density on Growth
and Yield of Oil Palm.” Experimental Agriculture 9 (2): 169–180.
Corley, R. H. V. 2009. “How Much Palm Oil Do We
Need?” Environmental Science & Policy 12 (2): 134–139.
doi:10.1016/j.envsci.2008.10.011.
Corley, R. H. V., and P. B. H. Tinker. 2008. The Oil Palm. John Wiley & Sons.
Cracknell, A. P., K. D. Kanniah, K. P. Tan, and L. Wang.
2015. “Towards the Development of a Regional Version of
deeper understanding, to fill the gaps and to share the outcome with the general public.
Funding
This work was supported by the Ministry of Higher Education in Malaysia and the Universiti Teknologi Malaysia under the Fundamental Research Grant Scheme [grant number R.J1300000.7827.4F725].
Notes on contributors
Chong Khai Loong is currently a graduate student in
Geoinformation Science at Universiti Teknologi Malaysia. He earned his bachelor’s degree in Agricultural Science in the University Malaysia Sabah during his undergraduate studies. He is interested in precision agriculture and studies remote sensing as a gateway to achieve his goal. At present, he is working on oil palm-related research.
Kasturi Devi Kanniah is an associate professor in
Geoinformation Science at Universiti Teknologi Malaysia. Her remote sensing investigations examine changes in terres-trial carbon stock (e.g. mangroves, oil palms tropical forest deforestation) and low-carbon cities, and she is a collabora-tor with the Malaysia Environmental Performance Index at UTM. For 15 years, she has taught courses in remote sensing, GIS, and environmental impact assessment. Kasturi received her PhD in Geography & Environmental Science from Monash University and an MPhil in GIS and Remote Sensing from Cambridge University. She is a visiting scholar to MIT, USA. She serves on the editorial board of the International Journal of Geoinformatics.
Christine Pohl is currently representing the chair of
Geographic Information Systems and Remote Sensing at the University of Osnabrueck, Germany. Her research interests cover mainly standardization procedures for remote sensing image and data fusion. She uses remote sensing for applica-tions in the Tropics, monitoring the sustainability of oil palm plantations, mapping, change detection, humanitarian crisis support, and coastal zone management. She is serving on technical committees of several international conferences. Christine is Editor for International Journal of Remote Sensing and member of the Editorial Board of International Journal of Image and Data Fusion and Geo-Spatial Information Science.
Tan Kian Pang received his PhD degree in Remote Sensing
in 2014 and worked as a postdoctoral researcher at Universiti Teknologi Malaysia. His research mainly focuses on oil palm primary productivity studies.
ORCID
Kasturi Devi Kanniah http://orcid.org/0000-0001-6736- 4819
Christine Pohl http://orcid.org/0000-0002-3725-3445
References