MULTI-LEVEL SAMPLING APPROACH FOR
CONTINOUS LOSS DETECTION USING ITERATIVE
WINDOW AND STATISTICAL MODEL
MOHDFO’ADROHANI1, MOHDAIZAINIMAAROF1, ALISELAMAT1ANDHOUSSAIN
KETTANI2
1
Faculty of Computer Science and Information Systems, Universiti Teknologi Malaysia, 81300 Skudai, Johor, Malaysia
2
Department of Electrical and Computer Engineering and Computer Science, Polytechnic University of Puerto Rico, P. O. Box 192017, San Juan, Puerto Rico 00919, USA
E-mail: {foad, aizaini, aselamat}@utm.my, [email protected]
ABSTRACT: This paper proposes a Multi-Level Sampling (MLS) approach for continuous Loss of Self-Similarity (LoSS) detection using iterative window. The method defines LoSS based on Second Order Self-Similarity (SOSS) statistical model. The Optimization Method (OM) is used to estimate self-similarity parameter since it is fast and more accurate in comparison with other estimation methods known in the literature. Probability of LoSS detection is introduced to measure continuous LoSS detection performance. The proposed method has been tested with real Internet traffic simulation dataset. The results demonstrate that normal traces have probability of LoSS detection below the threshold at all sampling levels. Meanwhile, false positive detection can occur where abnormal traces have probability of LoSS that imitates normal behavior at sampling levels below 100 ms. However, the LoSS probability exceeds the threshold at sampling levels larger than 100 ms. Our results show the possibility of detecting anomaly traffic behavior based on obtaining continuous LoSS detection monitoring.
KEYWORDS: Loss of Self-Similarity (LoSS), Multi-Level Sampling, Anomaly Traffic Detection, Second Order Self-Similarity, Iterative Window
1. INTRODUCTION
alert a signal of poor QoS performance [5, 6] due to the uncontrolled self-similarity structure. Implementation of LoSS detection with Second Order Self-Similarity (SOSS) statistical model has been introduced in order to attain high speed and accuracy detection needs [2]. Previous works in [1, 2] have used fixed sampling and fixed window to detect LoSS. However, fixed sampling is insufficient to reveal the self-similarity distribution error efficiently [7, 8]. On the other hand, dynamic window is needed for iterative LoSS detection in order to detect the present of anomaly traffic behavior continuously. In this work, we propose a continuous LoSS detection using iterative window and Multi-Level Sampling (MLS) approach. The Optimization Method (OM) [9, 10] is used to estimate self-similarity parameter or known as Hurst (H) value. We have evaluated the LoSS detection performance using probability of LoSS detection measurement. This paper is organized as follows: Section 2 discusses in brief the self-similarity model and the estimation method of the parameter H. The proposed LoSS detection method is discussed in Section 3 while the experimental and empirical analyses are presented in Section 4. Finally, our conclusion and future work are summarized in Section 5.
2. SOSS MODEL AND ESTIMATION METHOD
2.1 Second Order Self-Similarity Statistical Model and Parameter Estimation Method
Let define a second-order stationary process X { ( ),X t t0} with constant mean, finite variance 2
and autocorrelation( )k as follow:
2 2
[ ( )], [( ( ) )]
E X t E X t
(1)
2
( )k E X t[( ( ) )( (X t k) )] /
(2)
Let X( )m {X( )m ( ),t t0} denote the aggregate process ofXat aggregation level m0. Thus, we have:
( )
( 1) 1
1
( ) ( ) , 0
mt m
w m t
X t X w t
m
. (3)Let ( )m ( )k
and ( )m ( )k denote the variance and autocorrelation function of X( )m respectively. X is called Exactly Second-Order Self-Similar (ESOSS) if( ) ( )k m ( )k
for all m1. In ESOSS, the autocorrelation structure is preserved for all msuch that:2 2 2
1
) [( 1) 2 ( 1) ]
2
k k k k
(4)
where k0 and 0 1.X is called Asymptotical Second-Order Self-Similar (ASOSS) if
)
lim m(
m k ~
2 2 2
1
[( 1) 2 ( 1) ]
2 k k k
(5)
There are several methods to estimateH. In this paper we use OM that was developed in [9, 10] which was proven relatively fast and accurate compared to other methods such as the wavelet method. The OM defines Curve-Fitting Error (CFE) function asEK(β)such
as: 2 1 1 ( ( ( ) ( )) 4 K K n k
E k k
K
(6)where ρ(k) denotes the autocorrelation function of the model with parameter β that we would like to fit the data to,ρn(k)is the sample autocorrelation function of the data, andK
is the largest value ofksuch that it minimize the edge effect for the calculation ofρn(k). If
the minimum ofEK(β)is less than 10-3, then the data fits the model and the minimizer ˆ
is picked to be the estimate of the parameterβ[9].
2.2 Loss of Self-Similarity Detection Model
Let X(t) be a stochastic time series data with second order stationary property. The autocovariance decay of X(t) and aggregated X(m)(t) that follow ESOSS model can be written as in equation (7):
,
lim m( ) ( ) m k k k ~C k0
(7)
where m is sampling level, k is correlation lag, Co is constant and β is self-similarity
parameter. Equation (7) shows sampling level m does not play an important role in the autocorrelation process for exactly self-similarity model. Nevertheless, the self-similarity processes can also be treated as processesx(j)in the class X of those stationary processes that feature an asymptotic decay in autocovariance [11]. Thus, we should take into account ESOSS and ASOSS models concurrently in order to estimate the self-similarity parameter for normal and abnormal traffic correctly. To develop LoSS detection using both models; let denotes autocovariance, variance and autocorrelation for aggregated processX(m)(t) as shown in equation (8), (9) and (10):
,
lim m( )
m k k ~C m k1
(8)
lim m(0) m ~C m2
(9)
, ,
( ) lim ( ) lim
(0)
m m
m
m k m k
k k ~ 1 2
C m k C m
~C k3
(10)
where C1, C2 and C3 are constants. Previous works in [9, 12, 13] have assumed normal
A high density of DoS packet, such as in the presence of malicious traffic DoS traffic, can produce self-similarity distribution error and disturbs Internet traffic behavior. The normal characteristics of equations (8), (9) and (10) are disrupted. Consequently, LoSS is detected. Equation (11) shows that for abnormal traffic, the autocovariance and variance decay of C m k1 and (C m2 )' are not identically distributed. As a result, the characteristic of equation (11) deviates from normal self-similarity pattern as shown in equation (10).
, ,
( ) lim ( ) lim
(0)
m
m
m
m k m k
k
k
~
1
2 '
( )
C m
C m
k
≄C3k
(11)
Equations (10) and (11) demonstrate that aggregation (m) and correlation lag (k) are two parameters that need to be considered for estimating the CFE (orEK(β)) value in equation
(6) correctly in order to improve LoSS detection accuracy. Previous work in [2] had used OM to estimate self-similarity parameter to detect anomaly traffic. Their method is based on LoSS detection and their definition of normal traffic behavior as follows:
L N
H CF (12)
where HL:H[0.5,1]and CF : CFE < ThresholdN (at fixed samplingm).
On the other hand, abnormal behavior defined as LoSS is detected at normal fixed sampling such as CFN' where CFEThreshold. Nevertheless their technique has only considered fixed sampling such as 10ms or 100ms which is not sufficient to reveal the hidden self-similarity distribution error accurately. Uncovering LoSS at multi-level sampling (MLS) time scale was suggested in [7, 8] in order to reveal the hidden self-similarity distribution error effectively. We investigate multi-level sampling at micro sampling range that is below one second which known as engineering factor [14] for Internet protocol design. We limit the value of correlation lag below five hundred in order to avoid longer time estimation in order to maintain high speed LoSS detection performance.
3. CONTINOUS LOSS DETECTION USING ITERATIVE WINDOW
AND MULTI-LEVEL SAMPLING APPROACH
window and LoSS detection process. The initialization window is done to fulfill the minimum window size requirement before correct estimation of H [2] can be obtained. This involves window size that meets the CFE criterion below the threshold value. In addition, the definition of initialization window also considers normal LRD behavior such as shown in equation (12). The process of LoSS and SOSS detection can only be continued if the initialization window has been established. However, if initialization window fails (IF) even though enough capturing time is given such as 30 minutes as used in [12, 13], we declare malicious traffic behavior is captured. The algorithm for initialization window process is shown in Fig. 1.
Fig. 1: Initialization window process.
On the other hand, continuous LoSS and SOSS detection with iterative window is based on whetherCFE_>_10-3for LoSS andCFE_≤_10-3for SOSS. Similar to the process of initialization window procedure, the normal self-similarity behavior that follow SOSS model is also taken into account the normal LRD behavior as defined in equation (12). The LoSS detection algorithm is shown in Fig. 2.
Fig. 2: LoSS and SOSS detection process.
We introduce measurement probability of LoSS detection to assess the effectiveness of the proposed detection algorithm. Thus, we define iterative window update in a continuous
set stepSize,ΔW
set window, W = W +ΔW while (W < Wmax)
estimate H and CFE
if (CFE < Threshold) && (0.5 < H < 1) Inialization Window success SOSS is detected
proceed with LoSS detection else
incrementΔW++ set W = W +ΔW end
end
if (W≥Wmax) && (errCheck = 0) Initialization Window failed suspect suspicious behavior end
while (W < Wmax) incrementΔW++ update W=W+ΔW estimate H and CFE
if (CFE < Threshold) && (0.5 < H <1) SOSS is detected
else
LoSS is detected end
hunting mode as Wi {W W W1, 2, 3,....,WN} for i1, 2, 3,...,N. For each of the updated window Wi, if LoSS is detected then we update LoSS window equal to Wi or else update
SOSS window withWi. Suppose we have the updated LoSS and SOSS window as follows:
1 2 3
( ) { , , ,...., K}
LoSS i L L L L for i1, 2, 3,...,K and SOSS j( ){ ,S S S1 2, 3,....,SM} for 1, 2, 3,...,
j M . Then, we define the probability of LoSS (PL) and the probability of
SOSS (PS) detection using equations (12) and (13):
1
1 1
( )
K
i
L K M
i
j k
j k
L P P LoSS
L S
, (12)1
1 1
( )
M
i
S K M
i
j k
j k
S P P SOSS
L S
(13)There are three possible conditions for PLand PSvalue when we change the sampling level
value from lowermto highermas follows:
i) PL< PS
ii) PL= PS
iii) PL> PS
The first condition represents the normal behavior of Internet traffic that dominated by self-similarity model and we refer this as near to normal. The smaller value of PLindicates
the higher probability of Internet traffic follows the normal SOSS model. The critical point occurs when both probability values are the same. At this point, LoSS and SOSS occurrences are equally detected and we refer this as critical point where PLand PSequal
0.5. On the other hand, the traffic behavior is treated as near to abnormal when the value of PLis larger than PSwhich shows self-similarity leakage is dominant. This condition is
usually occurring at higher sampling level such as m is larger than 500 ms. At this condition, we can predict that the traffic is deviated from normal SOSS model and can be treated as contains suspicious or malicious packets traffic such as DoS activities.
4. EXPERIMENTS AND EMPIRICAL ANALYSES
remains fast and optimize. If we set higher value of k, we need more sample size packets at the higher sampling levelmin order to fulfill minimum window requirement as required in the proposed LoSS detection method. In the parameter estimation using OM, the threshold value for estimated CFEis set to 10-3 to obtain correct estimation H as used in [2, 9, 10]. We choose sampling level randomly equal 10ms, 50ms, 100ms, 200ms, 500ms, 700ms and 1000ms [7, 8, 14] to represent multi-level sampling structure in the experiments.
Table 1: FSKSMNet Dataset 2006 [7]
FSKSMNet-Normal
Trace Total Packet
FNet-1 IP=4197509: TCP(97.87%), UDP(1.69%),
ICMP(0.12%), IGMP(0.01%), Others(0.31%)
FNet-2 IP=7371721: TCP(92.17%), UDP(0.93%),
ICMP(0.07%), IGMP(0.004%), Others(6.83%)
FSKSMNet-Abnormal
Trace Total Packet
FNet-3 IP=7468026: TCP(85.60%), UDP(14.35%),
ICMP(0.04%), IGMP(0.01%), Others(0.005%)
FNet-4 IP=9707011: TCP(69.17%), UDP(30.77%),
ICMP(0.04%), IGMP((0.005%), Others(0.02%)
0 0.5 1 1.5 2 2.5 3 3.5 x 10⁴ 0
0.01 0.02 0.03 0.04 0.05 0.06 0.07 0.08
50ms 100ms
200ms 500ms 700ms
Window
P
ro
ba
bi
lit
y
of
D
et
ec
tio
n
LoSS SOSS
(a)
0 0.5 1 1.5 2 2.5 3 3.5
x 104 0
0.01 0.02 0.03 0.04 0.05 0.06 0.07 0.08 0.09
50ms 100ms
200ms 500ms 700ms
Window
P
ro
ba
bi
lit
y
of
D
et
ec
tio
n
LoSS SOSS
(b)
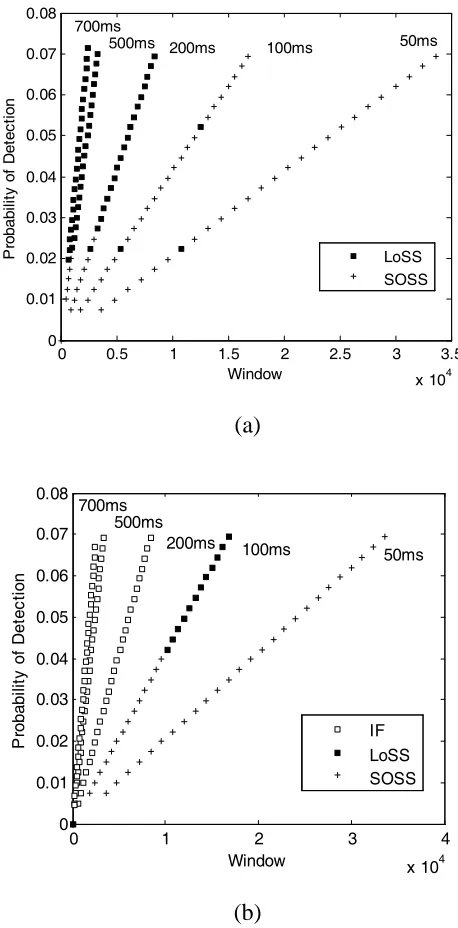
Fig. 3:LoSS detection for normal traces: FNet-1 (a) and FNet-2 (b).
0 0.5 1 1.5 2 2.5 3 3.5 x 10⁴ 0
0.01 0.02 0.03 0.04 0.05 0.06 0.07 0.08
50ms 100ms
200ms 500ms 700ms
Window
P
ro
ba
bi
lit
y
of
D
et
ec
tio
n
LoSS SOSS
(a)
0 1 2 3 4
x 104 0
0.01 0.02 0.03 0.04 0.05 0.06 0.07 0.08
200ms 100ms
50ms 500ms
700ms
Window
P
ro
ba
bi
lit
y
of
D
et
ec
tio
n
IF LoSS SOSS
(b)
Fig. 4: LoSS detection for abnormal traces: FNet-3 (a) and FNet-4 (b).
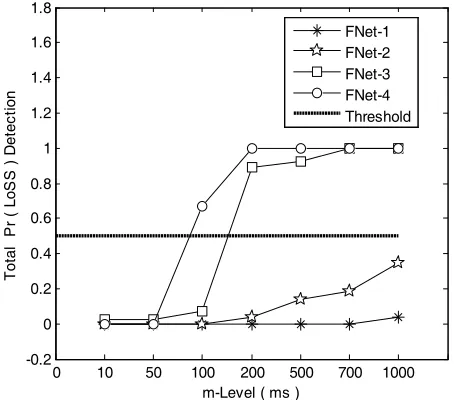
define ESOSS leakage as in any level of m; there is at least one sampling level where LoSS can be detected. Another word, the self-similarity leakage demonstrates the breach indication of ESOSS model property. Our assumption is that if probability of LoSS value estimated below the threshold i.e. PL0.5, then the traffic behavior will be dominated by SOSS model. Otherwise, the majority of updated windows are detected with LoSS which alerts a large amount of ESOSS leakage occurrence. This can be shown in Fig. 5 where FNet-3 and FNet-4 have critical ESOSS leakage warning compared to FNet-1 and FNet-2 at sampling levelmlarger than 100ms. Thus, the probability of LoSS measurement can be used as a technique to reveal the abnormal traffic behavior in a continuous LoSS detection at multi-level sampling approach as illustrates in Fig. 5.
0 10 50 100 200 500 700 1000
-0.2 0 0.2 0.4 0.6 0.8 1 1.2 1.4 1.6 1.8
m-Level ( ms )
T
ot
al
P
r
(
Lo
S
S
)
D
et
ec
tio
n
FNet-1 FNet-2 FNet-3 FNet-4 Threshold
Fig. 5: Probability of continuous LoSS detection.
5. CONCLUSION AND FUTURE WORK
and multi-level sampling approach. In future, we plan to implement continuous LoSS detection method using average value of multi-level sampling parameters such as average CFE and H in multi-level sampling structure. Moreover, the approach can verify whether Internet traffic traces are preserving or violating the self-similarity property based on ESOSS and ASOSS models in order to develop a reliable network traffic monitoring systems.
ACKNOWLEDGEMENT
This work was funded by Universiti Teknologi Malaysia (UTM) under the Human Resource Development Program. The authors are grateful to Dr. Sulaiman Mohd Noor at CICT, UTM and Mr. Firoz at Unit IT, FSKSM for their help in preparing the simulation of FSKSMNet 2006 datasets.
REFERENCES
[1] W. H. Allen and G. A. Marin, "The LoSS Technique for Detecting New Denial of Service Attacks," in SoutheastCon, 2004. Proceedings. IEEE, Alabama, USA, 2004, pp. 302-309.
[2] M. Y. Idris, A. H. Abdullah, and M. A. Maarof, "Iterative Window Size Estimation on Self-Similarity Measurement for Network Traffic Anomaly Detection," International Journal of Computing & Information Sciences, vol. 2, pp. 83-91, 2004.
[3] W. Schleifer and M. Mannle, "Online error detection through observation of traffic self-similarity," inCommunications, IEE Proceedings-, 2001, pp. 38-42.
[4] W. Yan, E. Hou, and N. Ansari, "Anomaly Detection and Traffic Shaping under Self-similar Aggregated Traffic in Optical Switched Networks," in ICCTZ003, 2003, pp. 378-381.
[5] A. Erramilli, O. Narayan, and W. Willinger, "Experimental queueing analysis with long-range dependent packet traffic," Networking, IEEE/ACM Transactions on, vol. 4, pp. 209-223, 1996.
[6] K. Park, G. Kim, and M. E. Crovella, "Effect of traffic self-similarity on network performance," inPerformance and Control of Network Systems, Dallas, TX, USA, 1997, pp. 296-310.
[7] M. F. Rohani, M. A. Maarof, A. Selamat, and H. Kettani, "Uncovering Anomaly Traffic Based on Loss of Self-Similarity Behavior Using Second Order Statistical Model,"International Journal Computer Science and Network Security,vol. 7, pp. 116-122, September 2007.
Approach," in International Conference on Robotics, Vision, Information and Signal Processing (ROVISP2007), 2007, pp. 152-156.
[9] H. Kettani, "A Novel Approach to the Estimation of the Long-Range Dependence Parameter." vol. PhD: University of Wisconsin – Madison, 2002.
[10] H. Kettani and J. A. Gubner, "A novel approach to the estimation of the long-range dependence parameter," Circuits and Systems II: Express Briefs, IEEE Transactions on,vol. 53, pp. 463-467, June 2006.
[11] G. Mazzini, R. Rovatti, and G. Setti, "On the Aggregation of Self-Similar Processes," IEICE Transactions Fundamentals, vol. E88–A, pp. 2656 – 2663, October 2005.
[12] W. E. Leland, M. S. Taqqu, W. Willinger, and D. V. Wilson, "On the self-similar nature of Ethernet traffic," inACM SIGCOMM, 1993, pp. 183–193.
[13] W. E. Leland, M. S. Taqqu, W. Willinger, D. V. Wilson, and M. Bellcore, "On the self-similar nature of Ethernet traffic (extended version),"IEEE/ACM Transactions on Networking,vol. 2, pp. 1-15, 1994.