ABSTRACT
BASCIANO, CHRISTOPHER ANTHONY. Computational Analysis and Simulation of the Non-Linear Arterial Wall Dynamics with Application to Abdominal Aortic Aneurysms. (Under the direction of Clement Kleinstreuer.)
The arterial wall is a complex fiber-reinforced composite structure. Its bio-mechanical response is a function of anisotropic material properties, nonlinear behavior, local stimuli, and the related time-dependent decay or remodeling. The purpose of this study is to identify the complexities of the arterial wall and investigate the necessary techniques that will
adequately model the wall’s mechanical response. Specific detail will be given to the pathological case of abdominal aortic aneurysms.
After a detailed review of the nonlinear theory needed to adequately model the arterial wall, new models for the healthy abdominal aorta and abdominal aortic aneurysm that achieve a new degree of biomechanical realism will be developed and critically compared to the current “state-of-the-art” models. A comparative study of the two prominent abdominal aortic aneurysm models is then conducted via a finite element analysis.
The new models of the healthy and aneurysmatic abdominal aortic wall report physiologically realistic loading of the healthy and aneurysmatic arterial wall’s
microstructure. Additionally, the macroscopic stress and strain of both models adequately matches experimental data and previous phenomenological models. The comparative study revealed a stark contrast in each model’s stress distribution and radial deformation.
COMPUTATIONAL ANALYSIS AND SIMULATION OF THE
NON-LINEAR ARTERIAL WALL DYNAMICS WITH
APPLICATION TO ABDOMINAL AORTIC ANEURYSMS
by
CHRISTOPHER ANTHONY BASCIANO
A thesis submitted to the Graduate Faculty of North Carolina State University
In partial fulfillment of the Requirements for the degree of
Master of Science
MECHANICAL ENGINEERING
Raleigh, NC 2007
Approved by:
______________________________ ______________________________ S. Seelecke M. Farber, MD
________________________________ _____________________________ C. Kleinstreuer P. Gremaud
BIOGRAPHY
Christopher Anthony Basciano was born on May 10, 1983 in Teaneck, NJ. He is the son of Frank and Judy Basciano and is third generation Italian-American. The author’s family moved to Spring Hill, FL shortly after he was born. While in Florida, the author’s younger brother and sister were born and the author went through grade, middle, and high-school, eventually graduating from Hernando Christian Academy in May 2001.
He then attended Mercer University in Macon, GA where he met his fiancé, Amanda Chappell, and in May 2005, earned a Bachelor of Science in Engineering with a
specialization in Biomedical Engineering and a minor in Business Administration. While at Mercer, Christopher had many wonderful experiences. One of them was being mentored by Dr. Sinjae Hyun, who sparked his interest in computational research within the field of biomedical engineering. In August 2005, the author continued to pursue biomedical computational research and began work on this thesis under the direction of Dr. Clement Kleinstreuer within The Department of Mechanical and Aerospace Engineering at North Carolina State University.
ACKNOWLEDGMENTS
I wish to acknowledge the effort and time that my committee chair, Dr. C. Kleinstreuer exerts for all his graduate students. His guidance, ideas, and encouragement have been an invaluable source of inspiration throughout this study. I wish to also thank my other
committee members Dr. S. Seelecke, Dr. P. Gremaud, and M. Farber, MD who have exerted significant amounts of time and energy through critical advice on aneurysms, intricacies of polyconvexity, and the fundamentals of numerical modeling. The contributions and suggestions of Dr. J. Eischen proved vital to the further development of my engineering abilities needed for this study. I must also recognize Dr. G.A. Holzapfel (Institute for Biomechanics in the Center for Biomedical Engineering at Graz University of Technology, Graz Austria) for his willingness to address my questions at two key stages during my research. I am truly honored that he would respond with such helpful comments. My fellow and past colleagues under Dr. Kleinstreuer have provided excellent suggestions, comments, and discussions throughout my study. I would like to acknowledge these individuals as Mr. Jie Li, Mr. Zheng Li, Dr. Zhongua Li, and Dr. Huawei Shi. I also gratefully acknowledge use of ANSYS software for this project, which was provided by ANSYS Inc. (Paul Lethbridge and Shane Moeykens, Strategic Partners), Canonsburg, PA.
TABLE OF CONTENTS
LIST OF FIGURES ……….. viii
LIST OF TABLES ………... xi
NOTATION AND SYMBOLS ……… xiii
1. BIOLOGICAL AND MECHANICAL PROPERTIES OF THE ARTERIAL WALL 1 1.1 Introduction ……… 1
1.2 Cellular Composition of the Arterial Wall ….……….……….. 2
1.2.1 Collagen ………. 2
1.2.2 Elastin ……… 6
1.2.3 Smooth Muscle Cells and Ground Substance ……… 7
1.3 Biological Composition of the Arterial Wall ………. 9
1.4 Mechanical Properties of the Arterial Wall ………..……… 11
1.5 Mechanical Response of the Arterial Wall ……… 13
1.6 The Process of Arterial Remodeling and Adaptation ……….……… 19
1.6.1 Acute Remodeling and Adaptation Response ……….….………... 22
1.6.2 Chronic Remodeling and Adaptation Response ……… 25
1.7 Arterial Wall Mechanics of Aneurysms ………... 29
1.7.1 Composition of the Aneurysm Wall ……….. 31
1.7.2 Imbalance of Arterial Remodeling within the Aneurysm Wall ………. 32
1.7.3 Mechanical Properties of the Aneurysm Wall ………... 34
1.7.4 The Effects of Intraluminal Thrombus on the Aneurysm Wall ………. 37
2. RESEARCH OBJECTIVES AND JUSTIFICATION 41
2.1 Establishment of a Theoretical Framework for Nonlinear Arterial Models ………… 41
2.2 Development of New Models for Healthy and Aneurysmatic Abdominal Aortic Walls ………. 42
2.3 Comparative Study of Two Isotropic Abdominal Aneurysm Wall Models ………… 42
2.4 Significance of Research Objectives ……… 42
3. CONTINUUM THEORY AND CONSTITUTIVE RELATIONS FOR LARGE, FINITE STRAINS APPLIED TO THE ARTERIAL WALL 44 3.1 Introduction ………... 44
3.2 Characteristics of Constitutive Equations ………. 45
3.3 Foundations for Constitutive Relations for Large Deformations ……… 46
3.3.1 Mathematical Preliminaries ………... 47
3.3.2 Deformation Gradient Tensor ……… 50
3.3.3 Deformation Gradient of Multiple, Successive Deformations ……….. 53
3.3.4 Right and Left Cauchy-Green Stretch Tensors ……….. 55
3.3.5 Green-Lagrange and Almansi-Eulerian Strain Tensors ………. 56
3.3.6 Cauchy Stress Tensor ………. 58
3.3.7 First Piola-Kirchoff Stress Tensor ………. 59
3.3.8 Second Piola-Kirchoff Stress Tensor ………. 60
3.3.9 Strain-Energy (Density) Function: Helmholtz Free Energy ………. 63
3.3.10 Stress Tensors and Their Relation to the Strain-Energy Function ………... 69
3.4 Modeling the Arterial Wall ………... 71
3.4.2 Modeling the Primary Characteristics of the Arterial Wall ………... 72
3.4.3 Modeling the Characteristics of the Aneurysm Wall ………... 78
3.4.4 Experimental Data Needed for New Arterial Wall Models ………... 79
4. MATHEMATICAL MODELS FOR NONLINEAR MATERIALS AND THE ARTERIAL WALL 82 4.1 Introduction ………...… 82
4.2 Fundamental Isotropic Strain Energy Functions ………... 82
4.3 General Strain-Energy Functions for Fiber-Reinforced Composite Materials ………. 84
4.3.1 Materials with One set of reinforcing Fibers ……….……… 84
4.3.2 Materials with Two sets of Reinforced Fibers ………..……. 85
4.4 Strain Energy Functions for the Passive Behavior of the Healthy Arterial Wall ……. 88
4.5 Specific Constitutive Relations for the Passive Abdominal Aortic Aneurysm Wall … 91 4.6 Strain-Energy Functions of the Intraluminal Thrombus ………... 92
4.7 Model for the Spatially Varying Wall Strength of the Aneurysm Wall ………..……. 92
4.8 Strain-Energy Functions that Incorporate Active Arterial Response ……… 95
4.9 Basic Comparison Between Linear and Nonlinear Models ……….…. 96
4.9.1 Uniaxial extension ………. 97
4.9.2 Uniform inflation of a sphere ……… 100
5. DEVELOPMENT OF A NEW STRUCTURAL ANISOTROPIC MODEL FOR THE HEALTHY AND ANEURYSMATIC ABDOMINAL AORTIC WALL 104 5.1 Introduction ………... 104
5.2 Functional Form of New Structural Anisotropic Model ………... 105
5.3.1 Curve Fitting Procedure ………. 108
5.3.2 Modifications to SEF Model ……….. 110
5.3.3 Fitting the Simplified Model to the Experimental Data ………. 110
5.4 Characteristics of New AAA Model ……….……… 113
5.4.1 Numerical Stability and Behavior ………. 114
5.4.2 Predictive Capabilities and Comparison with Existing Models ……… 117
5.5 Summary of New AAA Model ………. 121
5.6 Application of Non-Linear Modeling to Tracheobroncial Airways ………. 124
6. COMPARATIVE STUDY OF TWO ABDOMINAL AORTIC ANERUSYM MODELS FOR FINITE ELEMENT ANALYSES 125 6.1 Introduction ………... 125
6.2 Finite Element Methodology ………...………. 125
6.2.1 Idealized AAA Geometry ……….. 125
6.2.2 Numerical Conditions and Assumptions ……… 127
6.3 Validation Study …..………. 128
6.4 Results of Initial Finite Element Simulations ………... 130
6.5 Discussion and Clinical Relevance ………... 136
7. CONCLUSIONS AND FUTURE WORK 139 7.1 Conclusions ………... 139
7.2 Future Work ……….. 140
REFERENCES ………. 143
LIST OF FIGURES
Chapter 1
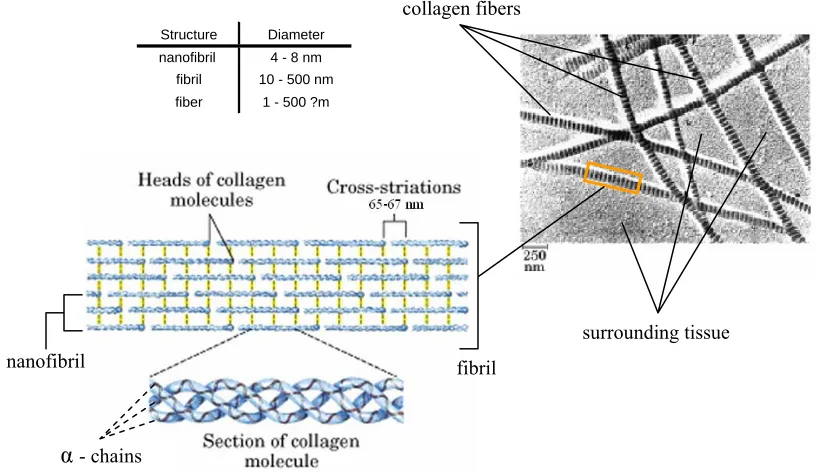
Fig. 1.1 Structure and Organization of Collagen within biological tissue ………... 3
Fig. 1.2 Stress-strain curve of collagen fibers ………. 4
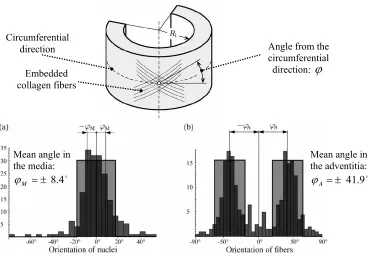
Fig. 1.3 Collagen fiber orientation and distribution in a) human aorta media and b) human aorta adventitia ………... 5
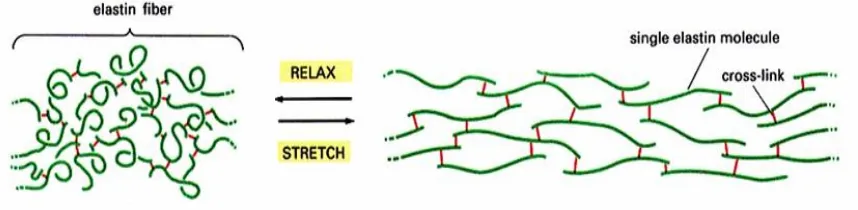
Fig. 1.4 Structure and behavior of elastin fiber under tensile load ………... 6
Fig. 1.5 Linear representation of the tensile loading of collagen and elastin fibers in artery wall ………... 7
Fig. 1.6 Collection of smooth muscle cells illustrating interlocking orientation …... 8
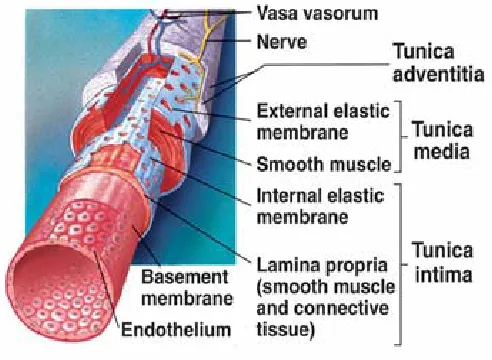
Fig. 1.7 Composition of arterial wall ………... 9
Fig. 1.8 Illustration of composite structure of arterial wall ………... 11
Fig. 1.9 Picture showing the stiff tunic media and limp tunic adventitia …………... 13
Fig. 1.10 Nonlinear stress-strain behavior of arteries ………... 14
Fig. 1.11 Circumferential and longitudinal directions ………... 15
Fig. 1.12 Biaxial stress-strain plots of the healthy abdominal aorta of patients greater tan 60 yrs old ……….. 16
Fig. 1.13 Decrease in strain and increase in diameter with respect to age ……… 17
Fig. 1.14 Areal strain of the abdominal aorta vs. age ……… 18
Fig. 1.15 Scale of MMP and TIMP activity ………... 21
Fig. 1.17 Changes in: (a) Arterial wall thickness and (b) Arterial opening angle over
time ………... 27
Fig. 1.18 Locations of (a) thoracic, (b) abdominal, and (c) cerebral aneurysms …………... 30
Fig. 1.19 Ultimate strength of aneurysm wall and healthy aortic wall ………... 36
Fig. 1.20 Biaxial mechanical properties of AAA wall ………... 37
Fig. 1.21 Orientation and microstructure of ILT within an AAA ………. 38
Chapter 3 Fig. 3.1 Unloaded and deformed configurations with displacement vector ur ……… 50
Fig. 3.2 Multiple, successive deformations with displacement vectors ur1 and ur2 ………... 53
Fig. 3.3 Visual representation of Cauchy stress tensor with its matrix form ………... 58
Fig. 3.4 The mappings of the Cauchy, 1st PK, and 2nd PK stress tensors ……… 63
Chapter 4 Fig. 4.1 Two sets of embedded fibers within a ground matrix ……… 85
Fig. 4.2 Uniaxial extension in the 11 direction ……… 98
Fig. 4.3 Cauchy stress resulting from uniaxial extension ……… 99
Fig. 4.4 Shear moduli of uniaxial extension ……… 100
Fig. 4.5 Uniform inflation of a hollow, thin-walled sphere ………... 101
Fig. 4.6 Cauchy stress resulting from uniform inflation of hollow, thin-walled sphere ………. 102
Chapter 5
Fig. 5.1 Procedure for model development ………. 105
Fig. 5.2 Diagram of biaxial tensile experimentation ………... 107
Fig. 5.3 Stress and normalized error of the new AAA model ………. 111
Fig. 5.4 Stress and normalized error for new HAA model ………... 113
Fig. 5.5 Convex energy contours of SEF ………. 114
Fig. 5.6 Change in loading ratio vs. increase in deformation ………... 116
Fig. 5.7 Comparison between AAA models and experimental data from Thubrikar et al. (2001a) ………... 118
Fig. 5.8 Comparison between models under equibiaxial strain ………... 119
Chapter 6 Fig. 6.1 Idealized aneurysm geometry and parameters ………... 126
Fig. 6.2 Inflation of a thick-walled cylinder with a constant length ……… 128
Fig. 6.3 Validation of finite element simulations with analytical solutions ……… 129
Fig. 6.4 Von Mises stress distributions along exterior surface of AAA geometry for different AAA wall models ……… 132
Fig. 6.5 Von Mises stress distributions along the x-plane interior surface of the AAA geometry for different AAA wall models ………... 133
Fig. 6.6 Von Mises stress distributions along the y-plane interior surface of the AAA geometry for different AAA wall models ………... 134
Fig. 6.7 Radial displacement along surface of AAA geometry for different AAA wall models ………... 135
LIST OF TABLES
Chapter 1
Table 1.1 Composition of different blood vessel walls ……… 11
Table 1.2 Composition of normal aorta and aneurysm wall ……… 31
Table 1.3 MMPs and their degradation targets ……… 33
Table 1.4 Wall strength of ruptured and repaired AAAs ………. 36
Chapter 3 Table 3.1 Important terms and symbols for nonlinear arterial wall models …………. 47
Table 3.2 Characteristics of the strain energy function (SEF) ………. 69
Table 3.3 Mechanical characteristics of the arterial wall ……… 72
Table 3.4 Mechanical characteristics of the aneurysm wall that differ from the healthy arterial wall ……….. 78
Chapter 4 Table 4.1 AAA model parameters ……… 92
Table 4.2 Mechanical properties of ILT ………... 93
Table 4.3 Parameters for two ILT strain energy functions ………... 94
Chapter 5
Table 5.1 AAA model coefficients ………... 110 Table 5.2 HAA model coefficients ………... 112 Table 5.3 Stress of each AAA model at maximum stretch ratio ……….. 120
Chapter 6
NOTATION AND SYMBOLS
Abbreviations
AAA Abdominal Aortic Aneurysm HAA Healthy Abdominal Aorta
FSI Fluid-Structure Interaction SEF Strain-Energy Function WSS Wall Shear Stress SMC Smooth Muscle Cell(s)
PK Piola-Kirchoff
Symbols
ψˆ Per unit volume Helmholtz free energy / Strain-Energy function
ij
F Deformation Gradient
ij
C Right Cauchy-Green stretch tensor
C C C C
C C C C
VIII VII VI V
IV III II I
, , ,
, , , ,
Invariants of right Cauchy-Green stretch tensor
ij
σ Cauchy stress tensor
ij
T First Piola-Kirchoff stress tensor
ij
S Second Piola-Kirchoff stress tensor
p Incompressible Lagrangian multiplier
ij
1. BIOLOGICAL AND MECHANICAL PROPERTIES
OF THE ARTERIAL WALL
1.1Introduction
One of the greatest challenges of computational hemodynamic simulations is to
accurately incorporate the mechanical properties of the arterial wall. The arterial wall is
itself a complex system that contains its own biomechanical processes and is a highly active
piece of multi-layered tissue. It has been shown that some of the complexities of the arterial
wall include: shape changes in response to different biomechanical stimuli, anisotropic
mechanical properties, and multi-layer composition of viscoelastic/anisotropic material.
Incorporating these complex effects in computational simulations is vital for accurate
fluid structure interaction (FSI) analyses of blood vessels. The mechanical properties of the
wall determine the deformation the wall will experience which, in turn, influences the local
hemodynamics. Multiple investigations have been conducted that incorporate some of the
arterial wall properties. These studies have reported significant differences between
investigations that used simple rather than complex characteristics of the arterial wall. Thus,
in order to achieve a new degree of realism needed for accurate FSI simulations of stented
1.2 Cellular Composition of the Healthy Arterial Wall
The cellular composition of the arterial wall provides the fundamental basis for the wall’s
mechanical behavior and characterization as a fiber-reinforced composite. Three primary
molecules play pivotal roles in the microstructure of the arterial wall: collagen, elastin, and
smooth muscle cells.
1.2.1 Collagen
Collagen is a protein that has a triple-helix polypeptide structure. The three polypeptide
chains that compose the triple-helix are given the term α-chains and are considered to be the building blocks of the collagen molecule. The α-chains contain the repetitive sequence [Gly-X-Y]n, where Gly is glycine, and X and Y are varying amino acids (usually proline). Over 20
different types of collagen fibers have been identified, each having a unique composition of
collagen α-chains and amino acids (Haaer and Dee, 2006). Types I and III are predominantly found within the arterial wall and are also targets of proteolytic enzymes for pathological
conditions such as atherosclerosis and aneurysms.
Strands of collagen form nanofibrils that are 4 – 8 nm in diameter, yet the collagen
triple-helix molecules do not contact each other in the axial direction, but are separated by a gap of
approximately 40 nm. Instead of direct axial contact, the collagen molecules are cross-linked
in a repeating, staggered pattern that has a length of 65 – 67 nm between the cross-links of
the collagen molecules (Humphrey, 2002; Haarer and Dee, 2006). Collections of nanofibrils
are then organized into fibrils, which have a cross sectional diameter of 10 – 500 nm. The
collagen fibers is dependent on the stress and strain that the surrounding tissue experiences
during physiological conditions. The collagen structure and organization is illustrated in Fig.
1.1.
Collagen fibers exhibit a nonlinear stress-strain curve. This is caused by the molecular
structure of the collagen fibers. Collagen fibers have a crimped/undulated helical shape that
remains crimped until a threshold amount of strain straightens the collagen fibers, and applies
stress to the cross links between the collagen molecules. Upon full extension of the cross
links, the collagen fiber has undergone full extension and will begin to have an exponential
increase in stress with relatively little if any strain/deformation. Figure 1.2 illustrates the Fig 1.1: Structure and Organization of Collagen within biological tissue
(vertical yellow lines are the cross-links between molecules)
From: http://courses.cm.utexas.edu/jrobertus/ch339k/overheads-1/ch6 collagen.jpg collagen fibers
surrounding tissue
α- chains
nanofibril fibril
structural forms of the collagen fibers in conjunction with its nonlinear stress-strain
relationship (Haarer and Dee, 2006).
Collagen has a relatively high failure strength and is used to reinforce the arterial wall
(preventing overstretch and rupture) (Sonesson et al. 1999; Humphrey, 2002; Haarer and
Dee, 2006). The ultimate tensile strength of collagen fibers ranges from 50 – 100 MPa, yet
has very little compliance and exemplifies a brittle failure (Haarer and Dee, 2006;
Humphrey, 2002; Fung, 1993). Although the tensile strength has a fundamental affect on the
mechanical response of collagen-reinforced tissue, the orientation of the collagen fibers play
a greater role in the overall mechanical response of the tissue. The primary method of
reporting collagen fiber distribution is by measuring the angle between the direction of the
fiber and a principle axis of the tissue that holds the fibers. Holzapfel et al. (2000, 2006)
reported the orientation of the collagen fibers as a mean angle from the circumferential
principle direction. However, the experimental work of Holzapfel et al (2002) and Sacks et Strain
Stress
Crimped collagen fiber
Fully stretched collagen fiber Moderately stretched
collagen fiber
al. (1998) have shown that collagen fibers are oriented throughout the cardiovascular system
in a multiple angular directions with respect to the circumferential principle direction (cf.
Fig. 1.3).
The mean angles displayed in Fig 1.3 indicate agreement with the trend recorded by Rhodin
(1980), ie, collagen fibers in the human aortic media orient themselves close to the
circumferential direction. However, Holzapfel (2006) reported mean collagen distributions
in a different set of human aortic tissue and found significantly different values. The mean
angle in the media was ±37.8° and the mean angle in the adventitia was ±58.9°.
Furthermore, the innermost layer of the aorta (the intima) was reported to have a mean
angular distribution of ±18.8°. Thus, it appears that variability of collagen distribution Angle from the
circumferential direction:ϕ Embedded
collagen fibers Circumferential
direction
Mean angle in the media:
o 4 . 8 ± =
M
ϕ
Mean angle in the adventitia: o 9 . 41 ± =
A
ϕ
Fig. 1.3: Collagen fiber orientation and distribution in a) human aorta media and b) human aortic adventitia
results in a significant inter-subject variability, making the exact angular distribution of the
collagen fibers patient specific.
1.2.2 Elastin
Elastin is an insoluble, tightly cross-linked polymer containing covalent bonds. Its
structure is quite random in unstretched conditions, yet straightens and forms a more ordered
structure upon tensile loading. The cross links of elastin are hydrophilic while regions in
between the cross links are hydrophobic. Because the hydrophilic regions exist only at the
cross links, most of the elastin molecule is hydrophobic. However, despite its hydrophobic
tendencies, elastin has a high degree of hydration (Haarer and Dee, 2006). Figure 1.4
illustrates the structure, cross links, and behavior of elastin under tensile loading.
The amino acid building blocks of the elastin molecule are somewhat similar to collagen.
In the order of high-to-low concentrations, the amino acids are: glycine, alanine, valine, and
proline. It is important to note that the amount of glycine found within a molecule is
correlated to the amount of elasticity/mechanical flexibility of the polypeptide chains. With
glycine being the prominent amino acid of the elastin molecule, the elastin molecule is Fig. 1.4: Structure and behavior of elastin fiber under tensile load
(red lines are the cross links between molecules)
expected to have a high flexibility and large amounts of elastic deflection (Haaer and Dee,
2006).
The mechanical behavior of elastin is considered “the most linearly elastic natural protein
material” (Haarer and Dee, 2006). The resulting tensile elastic modulus is 0.6 MPa and can
undergo uni-axial extensions of up to 150% prior to breaking (characteristic of high glycine
content); whereas collagen fibers can only undergo less than 10% extension before breaking.
Sonesson et al. (1999) reported that collagen is actually 1000 times stiffer than elastin.
Based on these material properties it is evident that elastin’s role in the arterial wall is to
ensure the wall maintains elastic deformation rather than preventing overstretch and rupture
(Haarer and Dee, 2006; Humphrey, 2002). Although the combined mechanical behavior of
elastin and collagen is non-linear, a linear representation of the differences in the two fiber’s
stiffness and their combined mechanical response is illustrated in Fig. 1.5.
1.2.3 Smooth muscle cells and ground substance
Smooth muscle cells are involuntary muscular tissue that regulates the diameter and
distensibility (dilation due to internal pressure) of arteries. The cells tend to be oriented in a Fig.1.5 Linear representation of the tensile loading
of collagen and elastin fibers in artery wall From: Raghavan (2002)
tensile
near circumferential configuration and have an approximate length of 100 μm and an average diameter of about 5 μm. Each cell has a fusiform morphology and is adjoined to other cells in an interlocking fashion (Humprey and McCulloch, 2003). Figure 1.6 illustrates the
morphology and interaction of the smooth muscle cells.
In elastic arteries (arteries closer to the heart), the smooth muscle cells (SMCs) are
organized into concentric layers 5 – 15 μm thick that are separated by elastin sheets with an approximate thickness of 3 μm. Some elastic arteries have as many as 40 to 70 concentric layers of smooth muscle tissue. Muscular arteries (those further away from the heart) usually
have a single collection of SMCs not separated by any elastin, yet the SMCs still orient
themselves in multiple concentric layers. A maximum of 25 to 35 concentric layers of have
been recorded for larger muscular arteries (Humphrey and McColluch, 2003).
Smooth muscle reacts much slower than the traditional striated, skeletal muscle. In the
arterial wall, the smooth muscle may not begin to contract until 5 – 100 ms after the initial
stimulus. The cells then take on the order of 1 – 10 s to reach the maximum contraction
stage. However, the smooth muscle cells can maintain a prolonged lower level contraction
much longer than striated, skeletal muscle and only require 0.25 – 5% of the energy required Fig. 1.6: Collection of smooth muscle cells illustrating interlocking orientation
for a comparable skeletal muscle contraction. Thus, heatlhy SMCs are well suited to perform
their roles of maintaining a homeostatic balance of stress and deformation across the arterial
wall (Humphrey and McColluch, 2003).
The ground substance/matrix of the arterial wall surrounds the collagen fibers, elastin
fibers/sheets, and the SMCs. It is a collection of elastic components such as fibronectin and
laminin, which provide the needed support for cells to remain anchored to each other. The
ground matrix also contains integrins, which provide biochemical pathways that allow the
other components of the arterial wall to communicate in other methods than the gap junctions
that are inherent of the cross linked design of collagen and elastin (Humphrey, 2002).
1.3 Biological Composition of the Healthy Arterial Wall
Most healthy, arterial walls have three distinct layers, where each layer has a different
distribution of materials and fibers (see Fig. 1.7). The two fibers that are of utmost
importance to the structure of the arterial wall are collagen and elastin. Over twenty different
types of collagen have been identified, yet the main load bearing collagen fibers present in
the arterial wall are types I and III
(Haarer and Dee, 2006; Humphrey,
2002). It is these collagen fibers
which tether the vessel to
surrounding tissue and prevent
excessive dilation of the vessel. The
elastin fibers, however, respond to
pressure and can expand or shrink in volume to maintain a steady flow of blood through the
vessel (Vito and Dixon, 2003).
The outermost layer is called the tunic adventitia and primarily contains collagen
arranged in a loosely woven pattern. Small nerve fibers, lymphatic vessels, and even smaller
blood vessels (in large arteries only) are located within this layer. Within the middle layer,
the tunic media, significant amounts of sheets of elastin and smooth muscle tissue are located
(Marieb, 1998). Types I, III, and IV collagen fibers are found to be tightly woven, almost
embedded, in the smooth muscle cells and the elastin sheets (Vito and Dixon, 2003). It is this
layer that normally is the dominant layer of the arterial wall; thus, bearing most of the
mechanical load that the artery encounters. Furthermore, the artery’s ability to dilate or
constrict is governed by the elastin sheets and smooth muscle cells within this layer. It is no
surprise that this is the layer most affected by cardiovascular diseases such as atherosclerosis
and arteriosclerosis. The layer that comes in contact with blood flow (under normal
conditions) is the innermost layer, the tunic intima. It is this layer that contains the
endothelium, a lining of simple squamous epithelial cells that align themselves to favor a
mean shear stress of about 1.5 Pa (Mariab, 1998; Barner, 2002; Rachev, 2000a).
An important note is that the distribution of fibers and tissue within each arterial layer
varies throughout the body. An example of this is how arteries more proximal to the heart
are more elastic while arteries more distal to the heart are more muscular (Holzapfel, 2000b;
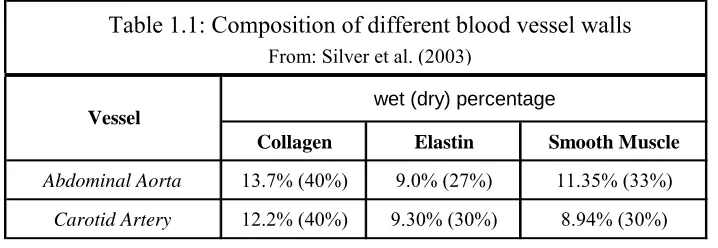
Humphrey, 2002). Silver et al. (2003) conducted a study on the porcine aorta, carotid artery,
and vena cava and reported the weight fractions of the primary mechanical components in the
wet (dry) percentage
Collagen Elastin Smooth Muscle
Abdominal Aorta 13.7% (40%) 9.0% (27%) 11.35% (33%)
Carotid Artery 12.2% (40%) 9.30% (30%) 8.94% (30%)
Vessel
Table 1.1: Composition of different blood vessel walls
From: Silver et al. (2003)
1.4 Mechanical Properties of the Arterial Wall
Some of the complexities of the arterial wall become even more evident when analyzing
the wall’s mechanical properties. As mentioned, the arterial wall is considered to be a
multi-layered anisotropic, composite material due to the different materials located within each
tissue layer and the wavy, helical orientation of the collagen and elastin fibers (Holzapfel et
al., 2000b; Li, 2004; Taber and Humphrey, 2001; Humphrey, 2002). Because each layer of
the wall has a different composition discussed in the previous section, the mechanical
properties of each layer are significantly different (Holzapfel et al., 2000b). An illustration of
these fibers is shown in Fig. 1.8.
Fiber reinforced medial layers
Fiber reinforced adventitia
Direct contributions of the very thin tunic intima on the solid mechanical properties of the
wall are very small and often negligible for young healthy arteries. Conversely, as the
arteries age, this intima layer thickens and stiffens. This stiffening and thickening becomes
even more pronounced upon the onset of atherosclerosis, which significantly changes the
mechanical properties of each layer composing the arterial wall.
The tunic media consists of the tissue that primarily determines the mechanical properties
of the entire composite structure of the healthy arterial wall (Holzapfel et al., 2000b;
Humphrey, 2002; Vito and Dixon, 2003). As shown in Fig. 1.8, elastic lamina located within
the tunic media divide the section into distinct fiber-reinforced layers (Rhodin, 1980). In
elastic arteries (those closer to the heart, ie, aorta and iliac) such layers are difficult to
distinguish from the elastic lamina itself, and can be considered as one prominent layer.
Furthermore, each fibril of collagen and elastin, the elastic laminae, and smooth muscle cells
form close junctions that collectively compose a continuous, fibrous helix. This helix is
primarily circumferentially oriented, yielding an innate ability of the tunic media to resist
both longitudinal and circumferential loads (Holzapfel et al., 2000b; Humphrey 2002).
The outermost layer of the arterial wall, the tunic adventitia, has large amounts of
variation of thickness based on the physiologic function and anatomic location of the artery
(cf. Fig. 1.7). Furthermore, the large amounts of collagen within the adventitia are also
arranged in helical patterns that have a primary contribution to the strength and stability of
the arterial wall. It is interesting to note that the adventitia provides primary reinforcement
against rupture and overstretch. The adventitia is thus somewhat limp when
the collagen fibers reach their straightened lengths (Holzapfel et al., 2000). Thus, it has been
shown that this layer plays a pivotal role in the rupture of various aneurysms throughout the
body (Vorp and Vande Geest, 2005). A photo illustrating the relaxed/unstrained tunic
adventitia and the tunic media is shown in Fig. 1.9.
1.5 Mechanical Response of the Arterial Wall
A collective analysis of the three arterial layers reveals that a healthy arterial wall forms a
highly deformable and nearly incompressible, composite structure that exhibits a non-linear
stress-strain response. Additionally, at higher loads the stress-strain response reveals
exponential stiffening due to the collagen fibers of the various layers. Fung (1993) referred
to the arterial walls as a pseudo-elastic material that exhibits hysteresis loops between the
loading and unloading of the arterial tissue (negating the definition of a true elastic material),
yet after a period of complete loading and unloading cycles, the arterial tissue yields a
repeatable stress-and-strain relationship. Holzapfel et al. (2000) clearly illustrated this
phenomenon when uni-axially testing strips of the tunic media under passive conditions. The Fig. 1.9: Picture showing the stiff tunic
results are shown in Fig. 1.10 and exhibit a pre-conditioned response, where the material
exhibits a nearly repeatable cyclic behavior after a certain number of load cycles.
Small hysteresis loops exist between the loading and unloading of the arterial wall, noting
that the energy lost due to heat is relatively small. Point one (I) in the figure corresponds to
the yield point of the arterial tissue, where elastoplastic (permanent) structural deformation
begins to occur (significant changes in the arterial wall’s mechanical behavior occur after this
point in the stress-strain diagram). A state of stress-softening (lowered stress response) exists
between points two (II) and three (III), where at point III the stress-strain curve reveals a
perfect elastic/viscoelastic response. To combine the different regions into an approximate
mechanical response curve, Holzapfel et al. (2000) constructed an engineering response
curve that neglects preconditioned responses of the artery. It should be noted that although
most of the stress in Fig. 1.10 is outside the normal physiologic range, such high stress on the
arterial wall is encountered in many vascular therapies and invasive procedures i.e. Fig. 1.10: Nonlinear stress-strain behavior of arteries
would be higher than the normal physiologic region when encountering cardiovascular
diseases, such as hypertension.
Although Fig. 1.10 illustrates the non-linear stress-strain behavior of an artery, it has been
widely shown that the arterial tissue is anisotropic and requires biaxial analyses to accurately
quantify the mechanical behavior of the arterial wall (Holzapfel et al., 2000; Humphrey,
2002; Fung, 1993; Sacks and Sun, 2003). The two primary anisotropic directions of arteries
are the circumferential and the longitudinal directions; where the circumferential direction
can be depicted by a line drawn tangent the circular cross section of artery and the
longitudinal direction is depicted as a line that is
parallel to the length of the artery (cf. Fig. 1.11). It
is sometimes difficult to interpret the physical
meaning of the circumferential stress. A good
description of this stress can be made if an imaginary slit is cut along the length of the
cylinder of Fig 1.11 in the longitudinal direction. When an internal pressure (along the inner
wall of the cylinder) is applied to the (now sliced) cylinder, the unconnected circular edges of
the cylinder would want to move apart. The circumferential stress is analogous to the stress
needed to keep circular edges of the sliced cylinder flush together when an internal pressure
is applied to the interior of the cylinder. Because this type of stress is predominantly
encountered in circular and spherical structures, the circumferential stress is often referred to
as the hoop stress. Thus, the two terms refer to the same concept of stress and have
equivalent numerical values.
Fig. 1.11: Circumferential and Longitudinal directions θθ
Figure 1.12 contains a stress-strain curve from a biaxial test, illustrating the anisotropic
response of the healthy abdominal aorta (HAA). The stress and strain in the circumferential
direction is depicted as S_TT and E_TT, respectively; while stress and strain in the
longitudinal direction is depicted as S_LL and E_LL, respectively.
The different curves in the two graphs of Fig. 1.12 represent different ratios between
circumferential and axial tensions, for the different loading ratios as given in the figure
legends as Load_TT : Load_LL. It is important to notice the different responses to the
different loading ratios. The circumferential stresses appear to have a slightly steeper
increase in stress at higher strains. A possible explanation of this could be due to the
orientation of the collagen fibers and their higher resistance to circumferential stretching than
to axial stretching. It is very important to capture these different mechanical responses in a
realistic model of the arterial wall as presented by Vande Geest et al. (2006a). Fig. 1.12: Biaxial stress-strain plots of the healthy abdominal aorta of patients greater than 60yrs old
From: Vande Geest et al. (2006a)
E_LL Strain
S
tre
ss
_
L
L
[kP
a
]
0 0.05 0.1 0.15 0.2
0 20 40 60 80 100
0.5 : 1 0.75 : 1 1 : 1 1 : 0.75 1 : 0.5
E_TT Strain
S
tr
e
ss_
T
T
[k
P
a
]
0 0.05 0.1 0.15 0.2
0 20 40 60 80 100
0.5 : 1 0.75 : 1 1 : 1 1 : 0.75 1 : 0.5 TT : LL
Another important response of the arterial wall is the changing of the wall’s mechanical
properties with respect to time. Lanne et al. (1992) conducted a study on the effects of age
on the mechanical response of the abdominal aorta. It was found that in healthy, male
subjects the mean diameter and the stiffness of the abdominal aorta increased with respect to
time. The diameter and strain data from Lanne et al. (1992) clearly reveal a change in the
aorta’s mechanical response with the progression of time (cf. Fig. 1.13).
All data was recorded in-vivo through a real-time, non-invasive echo-tracking analysis.
Strain and mean diameter were calculated from the Eqs. (1.1) and (1.2).
diastolic diastolic systolic
D D D
strain= − (1.1)
2
. Dsystolic Ddiastolic diam
mean = + (1.2)
The terms Dsystolic and Ddiastolic refer to the artery’s diameter at systolic and diastolic pressures,
respectively. To enhance the general trend of the strain and diameter data, exponential and
logarithmic trend-lines have been fit the respective curves. The corresponding R2 values are Fig. 1.13: Decrease in strain and increase in diameter with respect to age
From: Lanne et al. (1992)
R2 = 0.9858
0.00 0.10 0.20
0 20 40 60 80
Age [yrs] Age [yrs]
Str
a
in
Mean Diame
ter
[mm
]
R2 = 0.9865
0 5 10 15 20 25
also displayed on the graphs. It is important to note that the strain graph illustrates a
relatively consistent decrease in strain. While the diameter plot shows a steep increase
during developmental stages, yet begins to level off as time progresses.
Vande Geest et al. (2004) also illustrated the stiffening of the abdominal aorta by
conducting biaxial analyses on healthy abdominal aortas of different ages. Their results
illustrated a significant decrease of deformation when patients were older than 30 yrs old. A
plot illustrating their results is shown in Fig. 1.14.
The source of the discrepancy between the plots of Lanne et al. (1992) and Vande Geest et al.
(2004) is their experimental methods. Lanne et al. (1992) calculated strain from the in vivo
diameter of the abdominal aorta under systolic and diastolic pressure while the Vande Geest
et al. (2004) conducted biaxial tensile experiments on excised abdominal aortic tissue.
Furthermore, the areal strain is a combination of the deformations in both the circumferential
and longitudinal directions, whereas the strain of Lanne et al. (1992) is the circumferential
0.0 0.1 0.2 0.3 0.4 0.5 0.6 0.7 0.8
0 10 20 30 40 50 60 70 80
Age [yrs]
A
re
a
l S
tra
in
of
A
bdom
in
a
l A
o
rt
a
It has thus been shown that the mechanical response of the arterial wall is anisotropic and
dependent on the direction/orientation of the load applied to the wall. Additionally, the
mechanical response of the arterial wall changes with the passing of time and involves a vast
amount of biological processes. Thus, studies that depend on the mechanical response of the
artery will need to incorporate the afore-mentioned biological and mechanical properties of
the arterial wall.
1.6 The Process of Arterial Remodeling and Adaptation
In addition to the complex architecture and mechanical behavior of the arterial wall, the
arterial tissue has an innate ability to adapt and modify its morphological structure and
material properties in response to acutely and chronically altered loading conditions (Fung,
1993; Humphrey, 2002). The thickening of the arterial wall in response to hypertension is an
example of the adaptive capabilities of the arterial wall, but arterial adaptation is also seen in
healthy arterial conditions. Dienne et al. (2001) reported that the arterial wall of healthy
men, without any cardiovascular disease and regularly participate in endurance exercise,
exhibited a thickening behavior in response to the internal conditions during exercise.
Additionally, the smooth muscle cells within the arterial walls exhibit an active response that
contracts under periods of elevated pressure and dilates/expands under lowered lumen
pressure (Marieb, 1998)
Scientists have thus defined all adaptive behavior of the arterial wall with the terms
arterial remodeling or adaptation. However, such terms describe a very broad range of
vessel lumen to the increased production of collagen fibers to reinforce regions of the wall
undergoing increased levels of deformation. Known cells that play a pivotal role in this
adaptive process include the endothelial cells, smooth muscle cells (SMC), fibroblasts,
collagen and elastin fibers, and the extracellular matrix that contains numerous sensors for
biochemical remodeling signals. The common mechanism that triggers all forms of
remodeling is the human body’s natural desire to maintain homeostatic conditions. Arterial
walls and cells have an instinctive target for basal stress levels and the processes of arterial
remodeling are aimed to restore/maintain these basal stress levels (Glagov 1994, Alexander
and Dzau 2000, Jackson et al. 2002).
One of the primary methods for stress compensation, that does not involve any
macroscopic morphological changes to the arterial structure, is the degradation and synthesis
of different components of the arterial wall. The wall itself is living tissue and thus exhibits a
homeostatic balance between new, healthy components and old, worn components. Matrix
metalloproteinases (MMPs) are the primary enzymes that break down components of the
vascular wall, while tissue inhibitors of MMPs (TIMP) are the enzymes that regulate the
arterial wall’s response to secreted MMPs. More than twenty MMPs exist, and the entire
population of MMPs has been divided into 4 categories: collagenases, gelatinases,
stromelysins, and membrane-type MMPs (Loftus and Thompson, 2002). Recalling that the
matrix surrounding the smooth muscle cells of the arterial wall is predominantly composed
of elastin and collagen, the MMP enzymes target the degradation of these two fibers.
A careful balance between MMP degradation and TIMP inhibition must be established
strength and become too compliant or the arterial wall may become too rigid and raise stress
levels above the tensile strength of newly constructed collagen fibers (Lehoux and Tedgui,
2005). Fig. 1.14 provides a visual illustration of the careful balance between MMP and
TIMP activity.
The flow of blood through the arteries is a common stimulus of previously discussed
metabolic and anabolic activity of the arterial wall as well as significant changes in the
morphology of the arterial wall. Rachev (2000a) computationally analyzed the response of
arteries to altered blood flow and found that significant adaptations occurred in both the
lumen & wall radius and arterial wall thickness. In his study he also noted that the arteries
respond differently to an increase and a decrease in blood flow.
An increase in blood flow triggers a two step process that compensates the increased
stress levels due to more blood flowing through the artery. The first step is an acute response
that is primarily focused on the lumen diameter of the artery; while the second phase is a
chronic response that involves significant reconstruction of the arterial wall. In healthy Fig.1.15: Scale of MMP and TIMP activity
From: Lehoux and Tedgui 2005
Compliance Rigidity
MMP activation Collagen & Elastin
degradation
TIMP activation Collagen & Elastin
arteries, each phase has a feedback response that will terminate the adaptation process when
the stress levels of different portions of the arterial wall have been returned to the desired
basal level (Rachev, 2000a).
A decrease in blood flow results in a lower shear stress exerted on the endothelial cells of
the tunic intima. It is important to note that the arterial remodeling in response to decreased
blood flow does not occur within the same timescale as the artery’s response to increased
blood flow; however, a multi-stage response is still present. The first compensatory action of
the arterial wall is to raise the stress along the walls by decreasing the lumen diameter. A
persistent decrease in blood flow primarily affects the endothelium of the tunic intima. The
remodeling process causes the intima to increase in thickness and accumulate smooth muscle
cells from the tunic media. In some arteries, the basal levels of stress can never be reached;
thus, the body’s adaptive response continues to increase the intima’s thickness, creating a
permanent hindrance to blood flow known as a stenosis (Rachev, 2000a).
1.6.1 Acute remodeling and adaptation response
The vast majority of the loading on the arterial wall is due to the pulsating flow of blood
through the arterial lumen (Nichols and O’Rourke 1990). Changes or disturbances in the
flow can trigger the release of certain hormones that dilate or contract the lumen of the
artery. One of the fundamental stimuli for all acute adaptation is the shear stress along the
endothelial wall of the tunic intima, given the term wall shear stress (WSS). It has been
shown that the arteries tend to favor a mean WSS of about 1.5 Pa (Rachev, 2000a; Langille,
The WSS is directly proportional to the viscosity of the fluid and the local velocity
gradient (see Eq. (1a) and (1b)). Based on Stokes’ hypothesis for incompressible Newtonian
fluids the wall shear stress (WSS) can be written as:
( )
[
tr]
v
vr r
rr=
η
∇ + ∇τ
(1.2a)where τrr is the stress tensor, η=η
(
μ,∇vv,Ht)
is the apparent non-Newtonian blood viscosity, vr is the velocity vector,∇is the del operator, and( )
A tris the transpose of the tensor A. ForPoiseuille flow of a Newtonian fluid the wall shear stress can be written as:
L P R R
u
dr du
WSS = wall = wall = = Δ
2 :
μ
μ
τ
(1.2b)where μ is the fluid viscosity, u(r) is the axial velocity, where r is the normal/radial
coordinate, uis the average velocity, R is the tube radius, and L
P
Δ
is the constant pressure
gradient. WSS can vary greatly in areas of disturbed flow, making it a possible link to many
vascular diseases. The acute arterial response tends to be a local phenomenon, which
contributes to the localized lesions of different cardiovascular diseases (Buchanan et al.,
2003; Kleinstreuer et al., 2001).
Koller et al. (1993) revealed that an increase in blood viscosity, while maintaining
consistent physiologic flow and pressure, resulted in an increase in vasodilation (lumen
expansion due to relaxing of smooth muscle cells). Since viscosity is directly related to the
WSS, Koller also revealed the effects of increased shear stress on the endothelium when flow
and pressure are maintained at a constant level (Barner, 2002). Vallance and Chan (2001)
biochemical pathways that begin with signal transduction within the epithelial cells of the
tunic intima. The primary molecule that carries the signal for vasodilation is Nitrous Oxide.
The secretion of Nitrous Oxide (NO) is a local response and can be triggered in small
arterioles while the large arteries remain unaffected. NO can also have a global affect since
high concentrations of NO have been shown to affect both large and small arteries (Sausbier
et al, 2000).
NO is synthesized at various locations within the body, yet within the epithelial cells a
specific synthase enzyme titled epithelial nitrous synthase (eNOS) produces NO and the
byproduct L-citrulline from O2 and L-arginine. The resulting NO then diffuses out of the
epithelial cell membrane and into the smooth muscle cells (SMCs) of the tunic media.
Within the SMCs, the NO triggers guanylate cyclase (GC) to synthesize cyclic guanosine
3’,5-monophosphat (cGMP), the messenger that directly stimulates vascular tone and platelet
function. Figure 1.16 provides a visual illustration of WSS induced endothelial NO
production and resulting SMC vasodilation.
Endothelial cell
L-arginine O2
eNOS NO
L-citrulline
NO
Smooth Muscle Cell WSS
GC cGMP Vasodilation
NO has a very short half life that is less than 4 sec in biological solutions (Vallance and
Chan, 2001). To accommodate the molecule’s short existence, the body’s response to NO is
almost immediate, which explains the popular use of nitroglycerine for expanding arteries in
cases of congested heart failure and myocardial infarction.
Regardless of the body’s reaction time, eNOS can synthesize NO in multiple methods.
Ca2+, K+, Cl- ion channel activation of NO release merely takes a few seconds after the
endothelial cell is exposed to WSS. The prominent ion that drives the channels is Ca2+ that
increases in concentration during pulsatile flow conditions and can trigger intracellular
depolarizations that open the various ion channels (Vallance and Chan, 2001; Marieb, 1998).
Another method of NO synthesis is the phosphorylation of intracellular proteins, which after
hours of endothelial WSS exposure, can increase the intracellular concentration of eNOS by
up to 6-fold. The last prominent method of endothelial NO secretion is the gene transcription
of eNOS in response to changes in the WSS on the endothelial wall. Gene transcription is a
more permanent method of NO secretion, and is more similar to a chronic response rather
than an acute response.
1.6.2 Chronic remodeling and adaptation response
The chronic response is a long-term, adaptive process that can includes cell growth or
apoptosis, extracellular matrix expansion or contraction, and activation or inhibition of
specific proteolytic enzymes or glycosidases (Alexander and Dzau, 2000). It is therefore
evident that the chronic response of the arterial wall very extensive and yields alterations in
Many chronic adaptations of the arterial wall are a mere continuation of an acute
response. The stimulation for the chronic response is a persistent condition that alters the
stress on the arterial wall (Rachev, 2000a). Masuda et al. (1989) reported a compensatory
thickening of the arterial wall under a consistent increase in blood flow. The results were
subsequently supported by the research of Glagov et al., (1993), which also revealed a
thickening response of the total arterial wall associated with a persistant increase of blood
flow.
Some pathological conditions also elicit a chronic adaptation response. During sustained
hypertension, the arterial wall must develop a more permanent compensation than a constant
release of NO to dilate the arterial lumen. The elevated pressure exerted on the arterial walls
increases the accumulation of types I, III, and IV collagen fibers to counteract the increased
circumferential stress placed on the arterial wall (Intengan et al., 1999). Additionally,
Rachev et al. (1995) showed that arteries adapt to increases of blood pressure through the
growth of vascular tissue. His results revealed that the arterial wall thickness increased
monotonically until a new steady state had been established. Additionally, the residual stress
of the artery itself changed with respect to the increased pressure and revealed a
Another pathological condition that involves chronic arterial remodeling and adaptation
is atherosclerosis. One of the primary concerns of atherosclerosis is that the lesions and
plaque cause intimal thickening, and begin to hinder blood flow (Kleinstreuer, 2006).
Directly stimulated from the change in hemodynamic forces, the arteries begin to take
compensatory action and attempt to restores levels of stress in the wall. The results of such
attempts usually can be classified in two broad categories of expansive/positive or
constrictive/negative remodeling. Expansive remodeling is characterized by an increase in
wall and plaque volume that does not significantly decrease the lumen area of the blood
vessel while constrictive remodeling is used to identify an increase in wall and plaque
volume that decreases the lumen area of the blood vessel (Gyongyosi et al., 2004; Burke et
al., 2002; Pasterkamp et al., 2002).
Interesting studies have shown that although the expansive remodeling tends to not
hinder the flow of blood and create a stenosis, the plaque formed during expansive
remodeling is more susceptible to unstable atherosclerotic conditions. Some of the primary Fig. 1.17: Changes in: (a) Arterial wall thickness and
(b) Arterial opening angle over time From: Rachev et al. (1995) (a)
Time [dimensionless]
Thickness
[m
m]
0.9
0.6
(b)
Time [dimensionless]
O
penin
g An
gle
[de
gree
s] 120
116
112
observations of expansive atherosclerotic remodeling were that the plaque contained more
inflammatory cells (lymphocytes, macrophages, etc), a greater number of thrombi, and a
greater risk of being detached from the arterial wall and passed through the cardiovascular
system (Pasterkamp et al., 2002).
The endovascular treatment of stenting and the grafting of anastomoses can also produce
chronically elevated levels of stress within the arterial wall. The biological response to
vascular stenting is fueled by the arterial remodeling process. Moore and Berry (2002)
reported that an inflammation, proliferation, and remodeling phase occur in response to
stenting. Where the remodeling phase is characterized primarily by collagen deposition and
restructuring in the adventitia and media while the inflammation and proliferation target the
smooth muscle cells of the arterial wall.
Rachev et al. (2000b) computationally investigated the arterial remodeling in response to
the increased stress levels at the junctions of the stent or graft and the normal artery. The
results from their research concluded that localized, elevated levels of stress at the stent/graft
junction with the artery caused a thickening of the arterial wall at those locations until the
stress levels stabilized over time. Unfortunately, the thickening of the arterial often does not
stabilize the local stress until a majority of the vessel’s lumen is again occluded at the edges
of the stent. Thus, the arterial wall may never achieve the desired basal level of stress at
junctions between the stent and the artery, until another stenosis is formed. The term
restenosis has been given to the occlusion of a stented artery at the regions of contact
between the stent edges and the arterial wall (Frank et al. 2002). Berry et al. (2002) proposed
stent ends and arterial wall. In the study, it was shown that the stress in the junction near the
stent edges and arterial wall was not as elevated as compared to traditional stent designs.
Furthermore, the new design was investigated in a porcine medical trial where the
compliance matching design triggered a significantly less inflammatory response than
traditional stent design (Berry et al, 2002).
1.7 Arterial Wall Mechanics of Aneurysms
One of the many irreversible, pathological conditions that affect the arteries is the
aneurysm. An aneurysm is a local dilation of the blood vessel to where the lumen of the
vessel expands to at least 1.5 times the original diameter. The dilations often have complex
morphologies that range from a fusiform or a saccular shape to a more tortuous geometry that
is highly irregular. Further geometric complexities exist such as variable wall thickness and
presence of intraluminal thrombus (ILT) that lines portions of the aneurysm wall.
Aneurysms most frequently occur in the abdominal aorta (almost 90%), but numerous cases
have reported aneurysms in the thoracic aorta, the cerebrum, and the coronaries (cf. Fig.
One of the prominent dangers of an aneurysm is its tendency to rupture which results in
massive internal bleeding and a local collapse of the surrounding blood vessels. Within the
US over two million people are diagnosed each year to have an aneurysm and over 18,000
patients are annually killed by aneurysms. Furthermore, aneurysm rupture is the 13th most
common cause of death in the Western World (Choke et al., 2005). Numerous investigations
have been completed that analyze the pathology and mechanism of aneurysm rupture. The
most common agreement is that the process is multifaceted with several factors/parameters
that influence the severity of the aneurysm. Some of the common parameters agreed on by
multiple researchers are the morphological geometry of the aneurysm, the
biological/biochemical balance of normal vascular remodeling, the three dimensional
morphology of the aneurysm, and the mechanical/material properties of the aneurysm wall
(Choke et al., 2005; Kleinstreuer and Li, 2006; Vorp and Vande Geest, 2005; Lindholt et al
2001).
Kidney
Cerebral Aneurysm
1.7.1 Composition of the aneurysm wall
The foundational components of the normal arterial wall are significantly altered in the
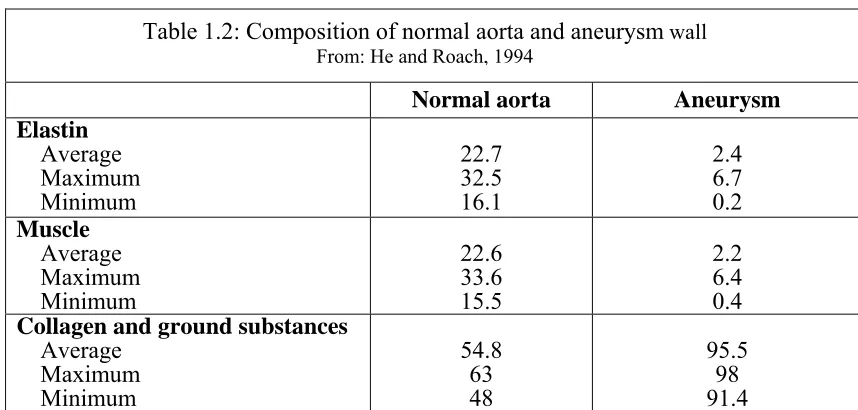
aneurysm wall. Nichols and O’Rourke (1990) reported that the normal collagen to elastin
ratio of the arterial wall is around 1.58; however, He and Roach (1994) presented data that
revealed the collagen to elastin ratio is much higher in aneurysms
(cf. Table 1.2).
Similar analyses have also reported the drastic decrease in elastin and smooth muscle within
the abdominal aortic aneurysm (AAA) wall (Gandhi et. al 1994). Baxter et al (1994)
reported that during the formation of AAAs the elastin concentration of the arterial wall
decreases while the collagen concentration of the arterial wall increases, supporting the
results of He and Roach (1994). While several investigations confirm the decrease of elastin
and smooth muscle within the aneurysm wall, analyses have yielded contradictory results
concerning the origin of the increase in collagen concentration within the aneurysm wall.
White et al. (1993) reported that the increase in collagen concentration was due to increased
Normal aorta Aneurysm
Elastin
Average Maximum Minimum
22.7 32.5 16.1
2.4 6.7 0.2
Muscle
Average Maximum Minimum
22.6 33.6 15.5
2.2 6.4 0.4
Collagen and ground substances
Average Maximum Minimum
54.8 63 48
95.5 98 91.4 Table 1.2: Composition of normal aorta and aneurysm wall
collagen synthesis and deposition within the arterial wall. However, Menashi et al. (1987)
claimed that the increased collagen concentration was caused by the massive decrease in
elastin concentration without increased collagen synthesis. Carmo et al. (2002) investigated
the cross links of collagen and elastin in both the healthy abdominal aorta and the abdominal
aortic aneurysm (AAA). Their study revealed that elastin cross links decrease by about 90%,
while the collagen cross links increased by almost 350%. However, the study also revealed
that the total content of both elastin and collagen fibers decreased by 47% and 91%
respectively. By combining these trends with histological stains Carmo et al. (2002) also
discovered a prevalence of aged type-I collagen fibers within the aneurysm wall, suggesting a
complication with the synthesis of type-I collagen fibers within the aneurysm wall.
1.7.2 Imbalance of arterial remodeling within the aneurysm wall
A contributor to the variation in both collagen and elastin of AAA-walls is an imbalance
in the biological/biochemical enzymes and proteinases that degrade or synthesize the elastin
and collagen fibers within the arterial wall. Kowalewski et al. (2006) claimed that the AAA
wall represents a severe case of unstable arterial remodeling and proteoglycan metabolism of
both elastin and collagen fibersl. One should recall from section 1.6 that normal arterial
remodeling involves the matrix metalloproteinase (MMP) enzymes that break down both
collagen and elastin fibers while tissue inhibitor MMP (TIMP) enzymes encourage collagen
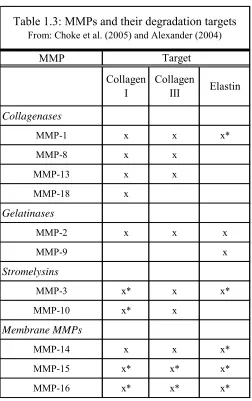
and elastin synthesis. The primary MMP enzymes that affect collagen (types I and III) and
MMP
Collagen I
Collagen
III Elastin
Collagenases
MMP-1 x x x*
MMP-8 x x
MMP-13 x x
MMP-18 x
Gelatinases
MMP-2 x x x
MMP-9 x
Stromelysins
MMP-3 x* x x*
MMP-10 x* x
Membrane MMPs
MMP-14 x x x*
MMP-15 x* x* x*
MMP-16 x* x* x*
Target
Table 1.3: MMPs and their degradation targets
From: Choke et al. (2005) and Alexander (2004)
The enzymes in Table 1.3 affect the degradation of collagen I, collagen III, and elastin
through direct interaction (x) or through indirect stimulation of another MMP that has
direction interaction with the target (x*). Several studies have shown that 2 and MMP-9 are the primary MMPs found within aortic aneurysms (Alexander, 2004). Crowther et al.
(2000) has shown that smooth muscle cells (SMCs) taken from the aneurysm wall produce
three times more MMP-2 than SMCs of age matched, healthy arteries. Peterson et al. (2002)
reported a correlation between MMP-2 and the max diameter of an aneurysm, and suggested
Conversely, MMP-9 is often found in larger aneurysms and is attributed to later stages of
elastin degradation and the inflammation of the tunic adventitia. Some investigations of
MMP-9 have reported a decreased elastin degradation and suppression of aneurysm
formation by disrupting the MMP-9 enzyme (Alexander, 2004). Studies involving
collagenase (the first group of MMPs in table 3) have shown that the enzyme targets
immature and damaged collagen fibers rather than mature fibers. Furthermore, multiple
investigators have shown that MMP-1 (a collagenase) is present in aortic aneurysms and that
the aneurysm cells do not respond to TIMP deactivation (Alexander, 2004). Thus, a
disruption in a feedback loop of the biological system is evident, and in turn also supports the
results of Carmo et al.’s (2002) research that aged collagen fibers are more prominent in the
aneurysm wall. Despite the support of the two studies, the exact mechanism and biochemical
pathways that govern aneurysm formation and severity remains unsolved. Currently, several
studies have also produced conflicting results that illustrate the need for further investigation
into the enzymes involved with the degradation of elastin and collagen within aneurysms
(Loftus and Thompson, 2002).
1.7.3 Mechanical properties of the aneurysm wall
In addition to an imbalance in arterial remodeling, aneurysms also have significantly
different mechanical properties than healthy arteries. Lanne et al. (1992) reported an
increase in the pressure strain elastic modulus (Ep) of AAAs when compared to age-matched,
healthy abdominal aortas. The equation for Ep is given in Eq (1.3) where P is the internal
pressure of the artery, D is the diameter, and the subscripts sys and dia refer to the systolic