CZAJKA, CHARLES DOUGLAS. Assessing Learning and Teaching across Geoscience Courses and Curricula. (Under the direction of Dr. David McConnell).
Discipline based education research arose out of the realization that students face unique learning challenges in the different Science, Technology, Engineering and Mathematics (STEM) disciplines and that knowledge about teaching and learning coupled with content knowledge can be used to improve student learning across STEM courses. Common education research goals across the STEM disciplines include understanding how people think and learn within a
discipline, assessing instructional strategies that enhance student learning, identifying effective strategies for guiding findings into classroom practice, and identifying approaches to make STEM education more inclusive and diverse. The work here describes three studies that contribute to these goals within the geosciences.
Efforts to promote the use of student-centered learning environments in STEM education have been tempered by a lack of professional development strategies that help faculty overcome common barriers to reform. Chapter 1 investigated the impact that adopting a suite of student-centered teaching materials had on the teaching practices and beliefs of eight geoscience faculty. Each instructor adopted 18 lessons developed as part of the InTeGrate (Interdisciplinary
centered instructional materials can have a positive impact on both the teaching practices and beliefs of college faculty.
The instructors above also collected student performance data on a sixteen question Geoscience Literacy Exam (GLE). Chapter 2 describes the impact that using socially relevant InTeGrate teaching materials had on changes in geoscience literacy of undergraduate students. The GLE was administered pre/post-course by all eight instructors during the project, and data were compared between the non-InTeGrate control semester and the InTeGrate treatment semester. While a significant difference in pre/post change scores on the GLE was not seen for the entire student population between the control and treatment semesters, two of the instructors did have significantly higher change scores among their students in the treatment semester. The use of InTeGrate teaching materials also had the effect of helping both female and Hispanic students close performance gaps that existed during the control semester.
The ability to think on geologic timescales is regarded as an important skill in the study of geology, yet little work has specifically addressed student understanding of this concept among geology students. Chapter 3 describes an exploratory, pre-experimental study
by
Charles Douglas Czajka
A dissertation submitted to the Graduate Faculty of North Carolina State University
in partial fulfillment of the requirements for the degree of
Doctor of Philosophy
Marine, Earth, and Atmospheric Sciences
Raleigh, North Carolina 2018
APPROVED BY:
_______________________________ _______________________________ Dr. David McConnell Dr. Elana Leithold
Committee Chair
DEDICATION
I dedicate this work to my grandfather. I’m glad I could share this achievement with him.
BIOGRAPHY Should our hero’s hands be holding this blackest purse?
Mom, am I failing or worse? Mom, am I failing?
ACKNOWLEDGMENTS
First and foremost I would like to acknowledge the role that my advisor David
McConnell has played in getting me to this point. All of the advice and guidance he has given me over the last six years will ensure that I am successful in all of my future pursuits.
I would also like to acknowledge my other committee members, Dr. Lonnie Leithold, Dr. Karl Wegmann, and Dr. Karen McNeal. Their valuable assistance, input, and conversations on my research and dissertation have helped to strengthen it beyond what I could have done alone.
Much of my research could not have been conducted independently, and so I need to acknowledge all the members of my research group, both past and present. This includes LeeAnna Chapman, Jason Jones, and Michael Pelch. I am grateful for your help in co-coding interviews, being available to talk through research issues and brainstorm ideas, and being the best travel companions to conferences and the associated adventures (long live the Orpheum Theater & RIP David Johnston).
Education research is also not possible without willing participants, and I’d like to thank both the InTeGrate research team and all the geology majors at NCSU. Both of these groups submitted themselves to multiple instances of either being interviewed by me, or taking an assessment multiple times. This wouldn’t have been possible without your participation, so Thank you.
TABLE OF CONTENTS
LIST OF TABLES ... vii
LIST OF FIGURES ... viii
CHAPTER 1: The Adoption of Student-Centered Teaching Materials as a Professional Development Experience for College Faculty ... 1
Introduction ... 1
Methods ... 6
Results ... 11
Teaching Practices... 11
Teaching Beliefs ... 13
Qualitative Results by TBI Questions ... 14
Discussion... 18
Practices ... 18
Beliefs ... 20
Belief changes through the Interconnected Model ... 21
Limitations ... 23
Conclusions ... 24
Acknowledgements ... 24
Funding ... 25
References ... 26
CHAPTER 2: Can Teaching the Geosciences in the Context of Societal Issues Have an Impact on Student Geoscience Literacy Gains? ... 31
Introduction ... 31
Methods ... 34
Study Participants ... 34
Study Design ... 35
Quantitative Instrument ... 35
Results ... 39
Discussion... 45
Demographic Factors ... 47
Limitations ... 48
Conclusions ... 49
Funding ... 51
References ... 52
CHAPTER 3: An Exploratory Study Examining Geology Students’ Conceptions Related to Geologic Time and Rates ... 56
Introduction ... 56
Research Design and Methods ... 59
Study Population ... 59
Study Design ... 60
Instrument Design ... 61
Data Analysis ... 64
Results ... 65
Quantitative Results ... 65
Alluvial Fan ... 69
U-Shaped Valley ... 71
Event Timeline ... 72
Discussion ... 74
Implications and Future Work ... 79
Limitations ... 81
Conclusions ... 82
Acknowledgements ... 82
References ... 83
Appendices ... 87
Appendix A ... 87
LIST OF TABLES
CHAPTER 1: The Adoption of Student-Centered Teaching Materials as a Professional Development Experience for College Faculty
Table 1 Study Participants ... 6 Table 2 Teaching Practices Inventory (TPI) categories and points ... 8 Table 3 Teaching Beliefs Interview Questions ... 10 CHAPTER 2: Can Teaching the Geosciences in the Context of Societal Issues Have an
Impact on Student Geoscience Literacy Gains?
Table 1 Study Participants ... 34 Table 2 InTeGrate modules and units utilized by the participating instructors ... 35 Table 3 Test statistics from the pre-test administration during the control semester.
Sample size n = 343 students. The desired values are those suggested by Ding and Beichner (2009). * = correlation of difficulty and discrimination indices
(respectively) between semesters ... 38 Table 4 Summary of ANOVA results on GLE normalized change scores. Asterisks
indicate significant main effects (*) and significant interaction effects (**) at
the 95% confidence level ... 40 CHAPTER 3: An Exploratory Study Examining Geology Students’ Conceptions Related to Geologic Time and Rates
Table 1 Participant Demographic Characteristics. Fr = Freshman, So = Sophomore, Ju = Junior, Se = Senior, M = Male, F = Female ... 60 Table 2 Subscales and concepts present on the pre-post assessment instrument ... 62 Table 3 Test statistics calculated from the post-test administration in Historical
Geology. Sample size n = 52 students. The desired values are those suggested by Ding and Beichner (2009) ... 63 Table 4 Themes identified from each question during think aloud interviews and the
LIST OF FIGURES
CHAPTER 1: The Adoption of Student-Centered Teaching Materials as a Professional Development Experience for College Faculty
Figure 1 The Interconnected Model of Professional Growth from Clarke and
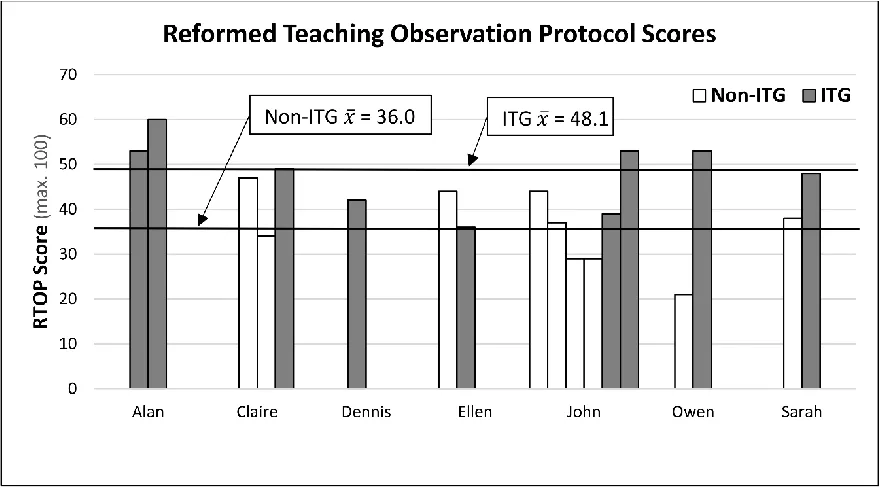
Holllingsworth (2002) ... 4 Figure 2 Teaching Practices Inventory scores for each instructor ... 12 Figure 3 Reformed Teaching Observation Protocol scores from seven of the eight
instructors. One instructor was not observed ... 12 Figure 4 Teacher Beliefs Interview scores for all four interviews from each instructor ... 13 Figure 5 Histograms showing the distribution of codes on the pre- and post-InTeGrate
interviews for all seven TBI questions. Questions in the left column show substantial change from pre- to post-ITG, questions in the middle column show moderate change, and questions in the right column show no change ... 14 CHAPTER 2: Can Teaching the Geosciences in the Context of Societal Issues Have an
Impact on Student Geoscience Literacy Gains?
Figure 1 Line plot showing mean normalized change scores for male and female students from control to treatment. Population sizes: Control Male (n=88),
Control Female (n=155), Treatment Male (n=98), Treatment Female (n=135) ... 42 Figure 2 Line plot showing mean normalized change scores for Hispanic and
Hispanic students from control to treatment. Population sizes: Control Non-Hispanic (n=181), Control Non-Hispanic (n=46), Treatment Non-Non-Hispanic (n=159), Treatment Hispanic (n=60) ... 43 Figure 3 Line plot showing mean normalized change score by student race from control
to treatment semester. Population sizes: Control = White (n=133), Black (n=51), American Indian (n=8), Asian American (n=20); Treatment = White
(n=120), Black (n=41), American Indian (n=4), Asian American (n=22) ... 44 Figure 4 Line plot showing mean normalized change score for by student academic rank
from control to treatment semester. Population sizes: Control = Freshman (n=59), Sophomore (n=84), Junior (n=73), Senior (n=28); Treatment =
CHAPTER 3: An Exploratory Study Examining Geology Students’ Conceptions Related to Geologic Time and Rates
Figure 1 Pre-Post test results from all courses and faculty experts who were only tested once. The score form each subscale of the assessment is shown within each bar. * = significant gains from pre- to post- on the subscale (p<0.05). ⁑ = significant gains from pre- to post- on the entire assessment (p<0.0005). Subscales are scored out of 7 points, except for the Geo Time Concepts which is scored out of 13 points ... 66 Figure 2 Histograms showing the distribution of scores for Physical Geology students,
geology majors, and faculty experts. Dashed lines represent the means of each
group, and the differences between all means were significant (p<0.001) ... 67 Figure 3 Percent correct for each topic area on the assessment for the final attempt by all
geology majors in the study and from faculty experts ... 68 Figure 4 Example timelines from student interviews, a) represents a student who used
CHAPTER 1: The Adoption of Student-Centered Teaching Materials as a Professional Development Experience for College Faculty
Introduction
Student-centered teaching strategies play an important role in increasing undergraduate student learning (Freeman et al., 2014; Freeman, Haak, & Wenderoth, 2011; NRC, 2015). Student-centered classrooms typically feature teaching strategies that require active participation from the learner, often in collaboration with peers, and may include answering questions, peer discussion, problem solving, writing, and reflection on learning (Mcconnell et al., 2017). Such strategies can also help reduce the achievement gap among student populations, and have been shown to yield positive results for minority and first-generation students (Freeman et al., 2014; Haak, HilleRisLambers, Pitre, & Freeman, 2011). Various stakeholders have called for the increased adoption of these instructional strategies in college STEM (Science, Technology, Engineering, and Mathematics) courses (Handelsman et al., 2004; NRC, 1999; PCAST, 2012). However, survey results reveal that the systematic implementation of student-centered teaching is still some distance in the future as approximately half or less of faculty across a variety of STEM disciplines report using these methods (Borrego, Froyd, & Hall, 2010; Henderson & Dancy, 2009; Manduca et al., 2017).
presented in team-based or collaborative models, where instructors work with peers or
instructional coaches (Czajka & McConnell, 2016; Gast, Schildkamp, & Veen, 2017). Henderson et al. (2011) reviewed strategies to promote instructional change in undergraduate STEM
education and concluded that effective change required adopting programs that are uniquely tailored to each institution, occur over a semester or longer period, and align with or change the beliefs of the instructors. The National Research Council (NRC, 2012) proposed that changing instructional practice required programs that included two of the following strategies: (1) sustained, focused efforts, lasting from 4 weeks to a semester, or longer; (2) feedback on
instructional practice; and (3) a deliberate focus on changing faculty conceptions about teaching and learning.
Henderson et al. (2011) and the NRC (2012) report share two features, a relatively lengthy professional development process and a focus on the beliefs of instructors. Various hypotheses have been proposed to explain the relationship between an instructor’s pedagogical
beliefs and their teaching practices. Several of these hypotheses view the relationship in a very linear fashion, where a change in beliefs is what drives a change in practice (Fullan, 1982) or, alternatively, that positive classroom outcomes resulting from instructional changes and/or reflection on practice drive a change in instructional beliefs (Eley, 2006; Guskey, 1986). The concept that beliefs are a determinant of practices is supported by research showing that
instructional beliefs can impact the implementation of curricula (G. H. Roehrig & Luft, 2004; G. Roehrig & Kruse, 2005) and that changes in an instructor’s beliefs leads to a change in their
practice (Ho, Watkins, & Kelly, 2001). Alternatively, teaching practices driving changes in beliefs is supported by research showing that instructors’ beliefs about teaching and learning
complex and nuanced relationship between beliefs and practices is not well understood (Devlin, 2006), and there is often a disconnect between an instructor’s teaching beliefs and their
classroom practices (Mansour, 2013)
Clarke and Hollingsworth (2002) proposed the Interconnected Model of Teacher Professional Growth (Figure 1) to describe the internal and external factors that influenced the complex relationship between an instructor’s beliefs and practices. They proposed four domains that comprised key aspects of the teaching experience. In this model the instructor’s knowledge,
beliefs, and attitudes (Personal Domain) are influenced by information or stimuli form external sources (External Domain, e.g. workshops, feedback from colleagues, etc.), by things that happen in the teaching environment (Domain of Practice), and by the successes or failures of the students as measured by course outcomes (Domain of Consequence; Figure 1). Unlike other models that require changes in beliefs to drive changes in practice, or vice versa, the
Figure 1. The Interconnected Model of Professional Growth from Clarke and Holllingsworth (2002).
between geoscience and society, and utilize real-world, authentic geoscience data sets. The curricula used here are divided into six modules that each focus on one geoscience topic (e.g. Human’ Dependence on Earth’s Mineral Resources). The modules are customizable, and each is
composed of six units equivalent to individual lectures or lessons. Each unit features several related activities, and the modules can be broken down and incorporated into a course at a variety of scales. All materials are designed around measurable learning objectives, a variety of formative and summative assessments and student-centered classroom activities, and are publically available via the InTeGrate website (http://serc.carleton.edu/integrate).
The participating instructors were tasked with adapting and incorporating 18 units (out of a possible 36) of InTeGrate teaching materials into their courses. Instructors were free to select the units that best fit their course and were not required to use all units from a module. While not the focus of this paper, the faculty also collected data on students’ attitudes toward the
geosciences, performance on a pre-post geoscience literacy exam, and performance on short essays related to interdisciplinary and systems thinking. This paper focuses on examining the impact of the teaching material adoption process on the teaching beliefs and practices of the participating faculty. The following questions were of interest to this project:
1. What impact did adopting the InTeGrate curricular materials have on the instructional practices of geoscience faculty?
Methods
The participating instructors were recruited in the spring of 2015 from a pool of applicants who responded to a call for proposals. The call was sent out through various email channels associated with the National Association of Geoscience Teachers, the Science
Education Resource Center (SERC, serc.carleton.edu), and the InTeGrate project. The notice was also posted as a news item on SERC-related websites and disseminated through SERC and InTeGrate social media sites. Applicants were selected based on the quality of their application, the number of students that would be impacted, the type of courses they taught, and their
potential for continued use of InTeGrate materials in the future. Experience in the use of student-centered teaching strategies was not a criterion in the selection process. Selected participants attended a three-day orientation meeting in the summer of 2015 to familiarize them with the InTeGrate teaching resources and the characteristics of the research project. The initial group of participants included 11 instructors, however, three chose not to continue with the project after the orientation meeting. The remaining eight instructors taught a variety of introductory
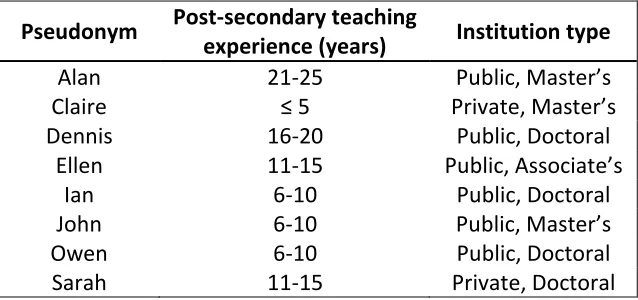
geoscience courses - Earth Science (n=2), Physical Geology (3), Environmental Science (2) and Oceans, Atmosphere and Climate (1) – at eight different institutions (Table 1).
Table 1. Study Participants.
Pseudonym Post-secondary teaching
experience (years) Institution type
Alan 21-25 Public, Master’s
Claire ≤ 5 Private, Master’s
Dennis 16-20 Public, Doctoral
Ellen 11-15 Public, Associate’s
Ian 6-10 Public, Doctoral
John 6-10 Public, Master’s
Owen 6-10 Public, Doctoral
The research project occurred in three phases over the subsequent three semesters. The first semester (Fall 2015) served as a control where participants taught their courses using the materials and methods that they had employed in prior versions of the class. During the subsequent spring semester, participants piloted a revised version of their course by
incorporating InTeGrate materials and replacing many of their standard materials. The pilot semester allowed the instructors to become familiar with the InTeGrate materials and their use and to address any issues that might arise when using new materials for the first time. The final semester (Fall 2016) served as the treatment semester with instructors using the InTeGrate units in their course for the second time. The research project compared learning outcomes among students in the two fall classes (2015 vs. 2016).
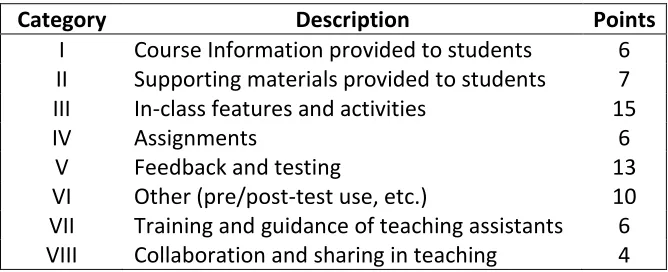
Table 2. Teaching Practices Inventory (TPI) categories and points.
Category Description Points
I Course Information provided to students 6
II Supporting materials provided to students 7
III In-class features and activities 15
IV Assignments 6
V Feedback and testing 13
VI Other (pre/post-test use, etc.) 10
VII Training and guidance of teaching assistants 6
VIII Collaboration and sharing in teaching 4
Teaching observations were conducted using the Reformed Teaching Observation Protocol (RTOP, Sawada & Piburn, 2002) along with a supplemental rubric used to ensure greater reliability among observers (Budd, van der Hoeven Kraft, McConnell, & Vislova, 2013). The RTOP is a 25-item observational protocol used to characterize the level of reformed
teaching during a class period. The items are grouped into five sub categories: (1) lesson design and implementation, (2) content propositional knowledge, (3) content procedural knowledge, (4) classroom culture communicative interactions, and (5) classroom culture student-teacher
relationships. Each item is scored from 0 if it never occurred to 4 if was very descriptive of that lesson. The RTOP provides a total score from 0-100, with scores equal to or less than 30 representing teacher-centered instruction, 31-49 being considered transitional, and lessons scoring 50 or greater are considered student-centered (Budd et al., 2013).
RTOP and TPI measure two different constructs, there are some similarities between the two instruments. The practices an instructor reports using in Category III of the TPI (In-class features and activities) would likely influence observational data from the RTOP’s categories of Content
Procedural Knowledge and Classroom Culture Communicative Interactions. Instructors who report frequent use of student-centered practices on the TPI would likely score higher in these two RTOP categories which deal with student engagement in classroom activities and student-student interactions. Conversely, the TPI surveys a range of strategies that would not be captured by a classroom observation (e.g., learning objectives provided to students, the nature of work assigned outside of class). Similarly, the RTOP captures aspects of student-centered instruction (e.g., whether a lesson was directed by student ideas, the nature of teacher-student relationships, etc.) that would not be recorded by the TPI.
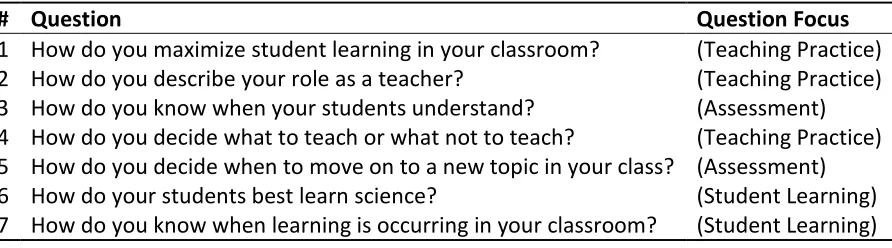
Qualitative interview data regarding the teaching and learning beliefs of the instructors were collected using the Teacher Beliefs Interview (TBI, Luft & Roehrig, 2007). The PI
conducted four TBI interviews with each participant prior to each semester and at the end of the project. The TBI is a seven question, semi-structured interview designed to capture an
instructor’s beliefs about teaching practice, student learning, and assessment (Table 3). All
interviews were audio recorded, transcribed, and coded using the coding protocol provided by Luft and Roehrig (2007). The coding protocol utilizes thematic analysis whereby one of five category classifications is assigned to each question’s response. The five categories ranging from
impacted your teaching in any way? Did you use any new teaching practices while you were employing the Integrate materials?).
Table 3. Teaching Beliefs Interview Questions.
# Question Question Focus
1 How do you maximize student learning in your classroom? (Teaching Practice)
2 How do you describe your role as a teacher? (Teaching Practice)
3 How do you know when your students understand? (Assessment)
4 How do you decide what to teach or what not to teach? (Teaching Practice)
5 How do you decide when to move on to a new topic in your class? (Assessment)
6 How do your students best learn science? (Student Learning)
7 How do you know when learning is occurring in your classroom? (Student Learning)
Two procedural steps were used to ensure reliability in the coding process. First, to eliminate confirmation bias, no interviews were coded until the end of the study, and all interviews were anonymized and randomized to prevent coders from knowing the instructor’s identity and which of their four interviews was being coded. Second, to establish reliability of the PI as primary coder, co-coding was conducted with two additional raters. Both co-raters were independent of the research, and while one had experience coding TBIs, the other was new to the process. Co-coding was done four interviews at a time, with all three raters coding each
interview. Using the numeric integer assigned to the five ordinal codes, each raters’ coding for
each question of the four interviews was used to calculate a reliability measure in IBM SPSS 24 (Statistical Package for the Social Sciences Software) using a two-way mixed intra-class
Results – Teaching Practices
The instructors showed little to no change in their scores on the self-reported Teaching Practices Inventory (TPI) over the course of the project (Figure 2). There was a statistically insignificant mean increase from pre- to post-scores of 2.38 points (t(7)=2.13, p=0.071). The observations of instructors’ classroom practices indicate that they became more student-centered and earned significantly higher RTOP scores. Five of the instructors were observed prior to adopting the InTeGrate materials and the nine lessons taught in Fall 2015 had a mean RTOP score of 35.9 (Figure 3). In contrast, seven instructors were observed using the InTeGrate
materials in Fall 2016 and their nine lessons had a mean score of 48.1 (Figure 3). This represents a statistically significant mean increase of 12.2 RTOP points (t(8)=4.12, p=0.003). Instructors scored a mean 3.69 points higher (out of 20) in the Classroom Culture: Communicative
Figure 2. Teaching Practices Inventory scores for each instructor.
Teaching Beliefs
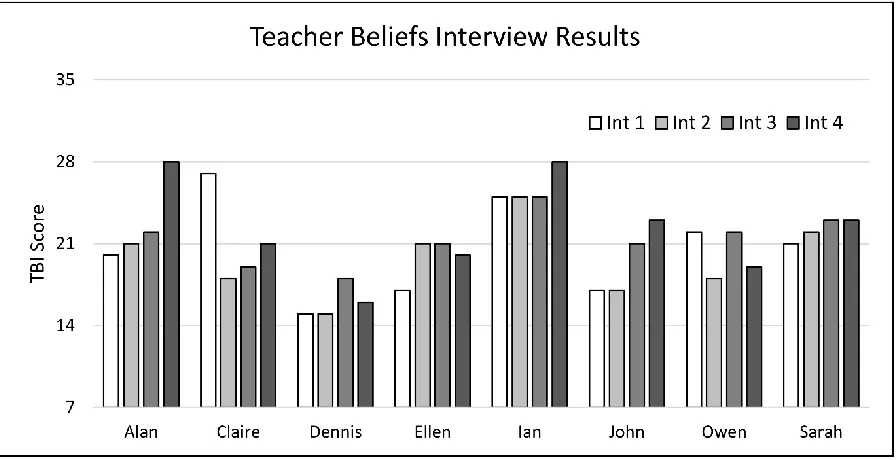
Figure 4 shows the TBI scores on all four interviews for each of the eight instructors. Six of the eight participants made at least a modest shift toward more student-centered beliefs (<6 TBI points) after the use of InTeGrate teaching materials, and two of those instructors made substantial shifts toward more student centered beliefs (≥6 TBI points, Alan and John). While
one instructor, Claire, showed an initial sharp drop in TBI over the first two interviews, her scores showed small increases over the remainder of the project. She began with a high initial TBI of 27, dropped down to 18 on her second TBI and increased to 19 on her third interview and 21 on the final TBI. The other instructor to not show a directional change was Owen, who fluctuated between a score of 22 on his first and third interviews, and 18 and 19 on his second and fourth.
are illustrated in Figure 5. The most substantial shift in beliefs toward a student-centered perspective occurred in response to the first two questions (How do you maximize student
learning in your classroom? How do you describe your role as a teacher?). The responses to three questions showed a moderate shift toward more student-centered beliefs (How do you know when your students understand? How do your students learn science best? How do you know when learning is occurring?), while two questions saw no real change in the beliefs of the
instructors (How do you decide what to teach and what not to teach? How do you decide when to move on to a new topic in your class?).
Figure 5. Histograms showing the distribution of codes on the pre- and post-InTeGrate interviews for all seven TBI questions. Questions in the left column show substantial change from pre- to post-ITG, questions in the middle column show moderate change, and questions in the right column show no change.
Qualitative Results by TBI Question
How do you maximize student learning in your classroom? During the first two
the instructors talked about creating a hands-on classroom with activities that involved the student, with a focus on the importance of the activities. For example, in his first interview, Alan said ‘I try to get them to be as hands on as possible where we’re doing activities, activities where maybe they’re making calculations, or looking at maps and interpreting maps, or they’re reading essays…’ Many would also mention the use of activities that involved electronic response
systems (clickers) or quizzes.
During interviews three and four, 50% of the responses were coded as responsive (Figure 5). Many of the instructors stressed not just the importance of activities for maximizing learning, but also the interaction between students in the classroom during activities. During his final interview, Alan’s reply to the question was ‘I think one of the things is to try to get the students
to interact with each other so they can sort of bounce ideas or what they understand off of each other and figure it out in that way.’
How do you describe your role as a teacher? While a majority of responses to this question coded as transitional both before and after InTeGrate adoption, 44% of the
post-InTeGrate responses received a student-focused code of either responsive or reformed (Figure 5). Owen’s pre-InTeGrate responses contained elements that were traditional, focusing on
information delivery ‘My role as a teacher, I think it is to be a conduit of knowledge. I need to make sure that I’m doing a good job, a complete job, in transferring the knowledge that we know.’ His responses on the post-InTeGrate interviews were more typically transitional focusing
on the idea of student understanding and development of skills such as critical thinking, but he also gave a reformed coded response in his third interview stressing the importance of students’ backgrounds and interests and using that to connect with the content, ‘I try to make it relevant…I
interested in…But I can relate that as well to their majors…it will make them be more interested and aware of different consequences of an activity…’
How do you know when your students understand? The instructors showed a moderate positive shift on this question, with half of all the pre-InTeGrate responses being coded as instructive (Figure 5), focusing on correct responses on questions, quizzes, or exams. As Dennis said in his first interview ‘The two main ways of seeing that are with the course response system answers and with answers on the exam.’ On his third interview, he gave a more transitional response, where students are engaged and active as a sign of understanding ‘…the level of noise
in the classroom, the students speaking with me and with them to understand what they’re getting and what they’re not getting.’
How do your students learn science best? Responses showed a moderate shift toward a student focused mindset with a 20% increase in the number of responsive codes (Figure 5). A transitional response was the most common answer on the early interviews as instructors expressed some form of students learn science best by doing it. As John said on his first
interview ‘I feel like if they’re actually doing something, I mean if they’re actually seeing it and going out in the field and doing stuff like that.’ Post-InTeGrate more responses were coded as
responsive, indicating that students should not only be doing something procedural, but that they should also be interpreting their observations and drawing their own conclusions about them.
I give back all their quizzes and exams, that’s when I really know if they learned it or not.’
During interviews three and four, John seemed to have moved toward more student-centered beliefs, expressing the importance of student initiated interactions about the topic as indicators of learning: ‘…when they start asking questions beyond what I specifically wanted them to know. That’s when I start to understand that they’re at least getting interested in it, and that interest –
actually, to me, it shows that they’re actually learning something.’
How do you decide what to teach and what not to teach? The distribution of codes to this question remained relatively unchanged from control to treatment semesters (Figure 5). Half of all the responses coded as transitional, with instructors mentioning some decision based on what they think their students will be interested in. The other half are split between instructive codes where the decision is made based on their own interest or comfort, and responsive codes where the instructors are using student feedback to partially decide what they will teach.
Discussion - Practices
While the dataset on practices from this project is limited, it reveals that the instructors as a group were teaching in a more student-centered way when using the InTeGrate materials. Using the three categories described by Budd et al. (2013), the 48.1 mean RTOP score of the instructors using the InTeGrate materials would be classified as transitional, just a few points below the boundary with student-centered practices. The group’s mean RTOP score during the control semester (35.9) was below the average scores reported for instructors in geoscience classrooms by both Budd et al. (2013) and Teasdale et al. (2017; x ̅=41.5 and x ̅=39.6
respectively). Based on observer notes, Teasdale et al. (2017) describe mean transitional
classrooms (RTOP score = 36-41) as commonly utilizing ‘shout out’ response questioning, often with little wait time, some student interaction to make predictions or hypotheses, , and instructors reviewing previously covered material but not assessing student knowledge of that material. These practices were commonly observed in the instructors during the control semester. In the treatment semester, the instructors were beginning to use more of the practices seen in student-centered classrooms such as students interacting with each other in groups, students asking questions and volunteering ideas, utilizing data, graphs, and maps, and instructors circulating the room to formatively assess student understanding (Teasdale et al., 2017).
activities on his post-TPI, an outcome that is likely recorded by his much higher post-RTOP score, but he also reported that he no longer used articles from the scientific literature, assigned homework, and he used fewer short answer questions on exams. These tradeoffs may have kept his TPI score relatively similar while explaining the increase in his RTOP score. Similar trends were not observed for all instructors though, so this explanation doesn’t fully explain the
relatively stable TPI scores and increased RTOP scores.
Beyond the inherent contrasts between the instruments, the inconsistency in scoring patterns may be explained by how effectively new teaching strategies were employed. Smith et al. (2014) suggested that the TPI is limited in its ability to distinguish between the quality of use of a given research-based instructional strategy. For example, an instructor may have reported using small group discussions on the TPI both before and after InTeGrate adoption, but any difference between the quality of discussion or amount of time students are given to achieve their goals would likely be discerned by application of the RTOP instrument in both versions of the class. The more highly structured learning activities embedded in the InTeGrate materials may have played a role in the improved quality of use hinted at in the RTOP observations.
Beliefs
The shift toward more student-centered beliefs for six of the eight instructors involved in the project is indicative that participation represented a positive professional development
experience. The greatest change seen in the instructors’ beliefs about teaching and learning came
on TBI questions related to teaching practice (Figure 5). This is the area where one would expect to see the greatest shift based on involvement in a project where new, student-centered teaching materials are being adopted. The RTOP data provides evidence that adaption of the InTeGrate materials resulted in these instructors using more student-centered teaching methods. Moderate to no changes in beliefs were seen on TBI questions related to assessment and student learning. It is perhaps not surprising that no change was seen in the instructors’ beliefs in these areas (i.e.
How do you decide what to teach? How do you decide when to move on to a new topic?) when they are being asked to teach using a specific suite of curricular resources within the context of a standard semester/term.
Belief changes through the Interconnected Model
If we examine the instructors’ experiences through the lens of the
Interconnected Model of Professional Growth (Figure 1), there is evidence of interactions between multiple domains for many of the instructors. The willingness to participate in adopting InTeGrate materials represented engagement between the External Domain and the Domain of Practice and represents a willingness to change some aspects of their teaching. Evidence for subsequent change in the other domains is apparent from interview responses and is reflected in the observation data that indicates specific changes in teaching practices. For example, the InTeGrate materials required the application of teaching practices that the instructors may not have used before. When asked about new teaching practices that he used during the project, Alan reflected on the use of jigsaw activities and gallery walks:
‘And then, you know, it sort of shows an understanding when one of the groups is looking at something that maybe a bunch of things that other people have put down and then they’re sort of synthesizing that with what they’ve already thought. So, I think that’s been very effective, which is something I had not done before.’
Here Alan is reflecting on the outcome of these practices and seeing the value in these activities for student learning. This reflection has impacted Alan’s beliefs, as evidenced from his response
to question seven on the final interview where he expressed the belief that he knows learning is occurring:
‘…when they’re working in groups, the willingness to sort of engage in discussion within the group and then even often times take it beyond, because with the different groups sometimes they finish the actual assignment at different times and then they’ll sort of take the discussion a little further.’
Many of the InTeGrate modules feature activities that utilize real world data that students analyze and interpret. John reflected on the use of these activities in his final interview ‘the plate
almost too in-depth for the students, but when I tried it, it actually worked better than I thought it would.’ This illustrates how John’s use of a new practice and reflection on the resulting outcome
(Domain of Consequence) may have altered his belief (Personal Domain) on what students are capable of in his classroom. For Ian, who held more student-centered beliefs coming into the project, the use of activities involving real data was seen as prohibitive due to situational factors, ‘I definitely didn’t teach with real data nearly as much in my large intro class, simply because it’s a challenge to do that in a class where you have at least 60 or more than 100 people, and the
learning curve is steep, and things can easily go off the rails.’ Yet, when reflecting on using data-rich resources he mentioned that having the activities and data pre-packaged were a great help, ‘I think that was really important for getting me to take the plunge to try it. I think that it improved the student experience a lot.’ For Ian, the External Domain had influenced the Domain of
Practice, bringing his practice more in line with his beliefs. For both John and Ian, using these activities were positive experiences that changed how they viewed both the practices they were comfortable using and the student outcomes of such practices.
When asked on the final interview if involvement in the InTeGrate project had impacted their teaching, two common themes emerged from the instructor responses. One was the desire to use practices that would encourage more student activity and engagement, a theme mentioned by four of the instructors. For Ellen, she was ‘now more interested in hands-on activities,
interactions, you know, moving the students around the classroom, not so concerned with memorizing.’ The other main theme mentioned by five of the instructors in response to this
application of science, and I think that that was something that’s really strengthened and
improved the relevance of what I’m bringing to the student that’s not a geology major that hopefully they’ll carry with them outside of their college experience.’ Reflecting on the
enactment of new practices and the resulting outcomes has resulted in changes to the instructors’ personal beliefs and attitudes about their teaching and student learning. These interactions between multiple domains of the Interconnected Model imply that this was a positive experience of professional growth for the instructors.
Limitations
This study is limited due to the non-random method by which the instructors who participated were recruited. The recruitment process used was also likely to attract participants who were already familiar with the InTeGrate project and teaching materials. Applicants would have likely been on one of the SERC, NAGT, or InTeGrate related email lists or visited a related website. By having this connection to the geoscience education community, applicants were potentially more open to or interested in changing their teaching practices. This may have had the consequence of instructors with more malleable beliefs being recruited for participation.
Conclusions
Implementation of InTeGrate teaching materials led to a shift toward more student-centered teaching practices and beliefs for nearly all the group of eight instructors involved in this project. This suggests that the yearlong experience of adopting well crafted, student-centered teaching materials can be an effective professional development experience for college faculty and can promote change toward more student-centered teaching beliefs and practices. Changes in the beliefs of the instructors may ensure that these instructors will persist in the use of student-centered teaching practices that align with their newfound beliefs.
There is now an even more diverse suite of eleven InTeGrate modules composed of 65 units or lessons (https://serc.carleton.edu/75235). These customizable curricular materials incorporate a variety of teaching strategies that fall under the banner of ‘student-centered
instruction’ and can help provide a pathway to guide more instructors toward the use of effective
teaching strategies that support student learning. The challenge lies in finding ways to get them into the hands and classrooms of college geoscience faculty to better facilitate the transformation of undergraduate STEM education
Acknowledgements
Funding
References
Borrego, M., Froyd, J., & Hall, T. (2010). Diffusion of engineering education innovations: A survey of awareness and adoption rates in US engineering departments. Journal of Engineering Education, 99(3), 185–207.
Budd, D., van der Hoeven Kraft, K., McConnell, D., & Vislova, T. (2013). Characterizing teaching in introductory geology courses: Measuring classroom practices. Journal of Geoscience Education, 475, 461–475.
Clarke, D., & Hollingsworth, H. (2002). Elaborating a model of teacher professional growth. Teaching and Teacher Education, 18(8), 947–967.
Czajka, C. D., & McConnell, D. (2016). Situated instructional coaching: a case study of faculty professional development. International Journal of STEM Education, 3(1), 10.
Desimone, L. M., & Garet, M. S. (2015). Best Practices in Teachers’ Professional Development in the United States. Psychology, Society & Education, 7(3), 252–263.
Devlin, M. (2003). A solution focused model for improving individual university teaching. International Journal for Academic Development, 8(1–2), 77–89.
Devlin, M. (2006). Challenging accepted wisdom about the place of conceptions of teaching in university teaching improvement. International Journal of Teaching & Learning in Higher Education, 18(2), 112–119.
Eley, M. G. (2006). Teachers’ conceptions of teaching, and the making of specific decisions in planning to teach. Higher Education, 51(2), 191–214.
United States of America, 111, 8410–5.
Freeman, S., Haak, D., & Wenderoth, M. P. (2011). Increased course structure improves performance in introductory biology. CBE Life Sciences Education, 10, 175–186. Fullan, M. (1982). The Meaning of Educational Change. New York: Teachers College Press. Garet, M. S., Porter, a. C., Desimone, L., Birman, B. F., & Yoon, K. S. (2001). What makes
professional development effective? Results from a national sample of teachers. American Educational Research Journal, 38(4), 915–945.
Gast, I., Schildkamp, K., & Veen, J. T. Van Der. (2017). Team-Based Professional Development Interventions in Higher Education : A Systematic Review. Review of Educational Research, 87(4), 1–32.
Guskey, T. R. (1986). Staff Development and the Process of Teacher Change. Educational Researcher, 15(5), 5–12.
Haak, D. C., HilleRisLambers, J., Pitre, E., & Freeman, S. (2011). Increased Structure and
Active Learning Reduce the Achievement Gap in Introductory Biology. Science, 332(6034), 1213–1216.
Handelsman, J., Ebert-May, D., Beichner, R., Bruns, P., Amy, C., DeHaan, R., … Wood, W. B. (2004). Scientific teaching. Science, 304, 521–522.
Hativa, N. (2000). Becoming a better teacher : A case of changing the pedagogical knowledge
and beliefs of law professors. Instructional Science, 28, 491–523.
Henderson, C., Beach, A., & Finkelstein, N. (2011). Facilitating change in undergraduate STEM instructional practices: An analytic review of the literature. Journal of Research in Science Teaching, 48(8), 952–984.
introductory quantitative physics in the United States. Physical Review Special Topics - Physics Education Research, 5(2), 20107.
Ho, A., Watkins, D., & Kelly, M. (2001). The Conceptual Change Approach to Improving Teaching and Learning : An Evaluation of a Hong Kong Staff Development Programme.
Higher Education, 42(2), 143–169.
Kastens, K. A., & Manduca, C. A. (2017). Using Systems Thinking in the Design,
Implementation, and Evaluation of Complex Educational Innovations, With Examples From the InTeGrate Project. Journal of Geoscience Education, 65(3), 219–230.
Landis, J. R., & Koch, G. G. (1977). The Measurement of Observer Agreement for Categorical Data. Biometrics, 33(1), 159–174.
Luft, J. A., & Zhang, C. (2014). The Pedagogical Content Knowledge and beliefs of newly hired secondary science teachers: the first three years. Educación Química, 25(3), 325–331. Luft, J., & Roehrig, G. (2007). Capturing science teachers’ epistemological beliefs: The
development of the teacher beliefs interview. Electronic Journal of Science Education, 11(2).
Manduca, C. A., Iverson, E. R., Luxenberg, M., Macdonald, R. H., Mcconnell, D. A., Mogk, D. W., & Tewksbury, B. J. (2017). Improving undergraduate STEM education: The efficacy of discipline-based professional development. Science Advances, 3(February), e1600193. Mansour, N. (2013). Consistencies and Inconsistencies Between Science Teachers’ Beliefs and
Practices. International Journal of Science Education, 35(7), 1230–1275.
NAGT. (n.d.). Geoscience Literacies. Retrieved November 19, 2017, from https://nagt.org/nagt/teaching_resources/literacies.html
National Research Council. (1999). Transforming Undergraduate Education in Science, Mathematics, Engineering, and Technology. Washington, DC: The National Academy Press.
National Research Council. (2012). Discipline-based education research: understanding and improving learning in undergraduate science and engineering. Washington, D.C.: The National Academies Press.
National Research Council. (2015). Reaching Students: What Research Says About Effective Instruction in Undergraduate Science and Engineering. Washington, D.C.: National Academy Press.
President’s Council of Advisors on Science and Technology. (2012). Engage to Excel: Producing
One Million Additional College Graduates with Degrees in Science, Technology, Engineering, and Mathematics. Executive Office of the President.
Roehrig, G. H., & Luft, J. a. (2004). Constraints experienced by beginning secondary science teachers in implementing scientific inquiry lessons. International Journal of Science Education, 26(1), 3–24.
Roehrig, G., & Kruse, R. (2005). The role of teachers’ beliefs and knowledge in the adoption of
a reform-based curriculum. School Science and Mathematics, 105(8), 412–422. Sawada, D., & Piburn, M. (2002). Measuring reform practices in science and mathematics
classrooms: The reformed teaching observation protocol. School Science and Mathematics, 102(October), 245–253.
Improving Our Teaching. Retrieved January 1, 2017, from http://serc.carleton.edu/52104 Smith, M. K., Vinson, E. L., Smith, J. a., Lewin, J. D., & Stetzer, M. R. (2014). A Campus-Wide
Study of STEM Courses: New Perspectives on Teaching Practices and Perceptions. Cell Biology Education, 13, 624–635.
Stes, A., Min-Leliveld, M., Gijbels, D., & Van Petegem, P. (2010). The impact of instructional development in higher education: The state-of-the-art of the research. Educational Research Review, 5(1), 25–49.
Teasdale, R., Viskupic, K., Bartley, J. K., McConnell, D., Manduca, C., Bruckner, M., …
Iverson, E. (2017). A multidimensional assessment of reformed teaching practice in geoscience classrooms. Geosphere, 13(2), 608–627.
Wieman, C., & Gilbert, S. (2014). The Teaching Practices Inventory: A New Tool for
Characterizing College and University Teaching in Mathematics and Science. Cell Biology Education, 13, 552–569.
CHAPTER 2: Can Teaching the Geosciences in the Context of Societal Issues Have an Impact on Student Geoscience Literacy Gains?
Introduction
Human society is facing a number of grand challenges, many of which are relevant to the geosciences and will require geoscientific solutions. These challenges include availability of mineral resources (Vidal, Rostom, François, & Giraud, 2017), energy needs and security
(Thomas, Partridge, Harthorn, & Pidgeon, 2017), anthropogenic induced climate change (Mann et al., 2017), and the availability of clean water (Flörke, Schneider, & McDonald, 2018) among others. The Earth is a dynamic system, and interactions between the various spheres of the
system link many of these challenges (Flörke et al., 2018; Holland et al., 2015). Additionally, our desires and needs for resources are often entangled in political policy (Ryan, 2017) and can have severe impacts for developing nations (Maystadt, De Luca, Sekeris, & Ulimwengu, 2014). It is vital that we provide the global citizenry with the geoscience literacy needed to properly evaluate, discuss, and address these challenges.
Ocean researchers were concerned that the National Science Education Standards (National Research Council, 1996) released more than twenty years ago contained minimal mention of topics related to the ocean. This led to an effort by a coordinated group of educators, scientists, policy makers, and federal agencies to draft a list of principles that students and the public should know in order to be literate about the oceans (Schoedinger, Tran, & Whitley, 2010). They produced a list of seven principles of ocean literacy (NOAA, 2006) and this effort inspired similar collaborations that resulted in the subsequent creation of documents on
Earth science literacy (Wysession et al., 2012). An important focus of these literacy initiatives is dissemination that seeks to promote the incorporation of the literacy principles into formal educational settings.
For many undergraduate students, an introductory geoscience course may represent the last exposure they have to learning about the Earth system. It then becomes imperative that these courses provide students with the literacy needed to evaluate geoscience-related challenges and to make scientifically informed decisions regarding these issues. This task is made difficult by the fact the most students who enroll in introductory geoscience courses are non-science majors and select the course mainly to fulfill a general education requirement. As such, these students come into geoscience courses with low motivation (Gilbert et al., 2012). It becomes important then, that geoscience instructors are intentional in deciding how they will teach their courses in order to engage these students and provide them with the knowledge and skills to think
scientifically.
research-validated teaching practices, emphasize the connection between geoscience and society, and utilize real-world, authentic geoscience data (Pelch & McConnell, 2017). Some of these materials were designed for introductory geoscience courses and are divided into modules that each focus on one geoscience topic (e.g. Humans’ Dependence on Earth’s Mineral Resources)
and contain three to six units that are each equivalent to one individual lecture period or class lesson. All of the materials are designed around measurable learning objectives, student- centered classroom activities, a variety of formative and summative assessments, and are publicly available via the InTeGrate website (http://serc.carleton.edu/intergrate).
The study described herein sought to investigate the efficacy of using the InTeGrate teaching materials on the geoscience literacy of undergraduate students at a variety of post-secondary institutions. Eight participating faculty members were tasked with incorporating approximately 18 units of InTeGrate teaching materials into their courses, and were free to select from up to 39 units that best fit their courses. Student geoscience literacy was assessed using a 16 question pre-post geoscience literacy exam. While not the focus of this paper, the faculty also collected data on students’ attitudes toward the geosciences, performance on a variety of module
related assessments, and performance on two short essays related to interdisciplinary and systems thinking. The following research question guided this project:
1. Does the use of InTeGrate teaching materials lead to greater gains in the geoscience literacy of undergraduate students as measured using the Geoscience Literacy Exam? 2. Do the effects of InTeGrate material use on Geoscience Literacy Exam scores vary
Methods - Study Participants
Geoscience instructors were recruited to participate in the spring of 2015 from a pool of applicants who responded to a call for proposals. The call was sent out through various email channels associated with the National Association of Geoscience Teachers, the Science
Education Resource Center (SERC, serc.carleton.edu), and the InTeGrate project. The notice was also posted as a news item on SERC-related websites and disseminated through SERC and InTeGrate social media sites. Applicants were selected based on the quality of their application, the number of students that would be impacted, the type of courses they taught, and their
potential for continued use of InTeGrate materials in the future. Experience in the use of student-centered teaching strategies was not a criterion in the selection process. Selected participants attended a three-day orientation meeting in the summer of 2015 to familiarize them with the InTeGrate teaching resources and the characteristics of the research project. The initial group of participants included 11 instructors, however, three chose not to continue with the project after the orientation meeting. The remaining eight instructors taught a variety of introductory
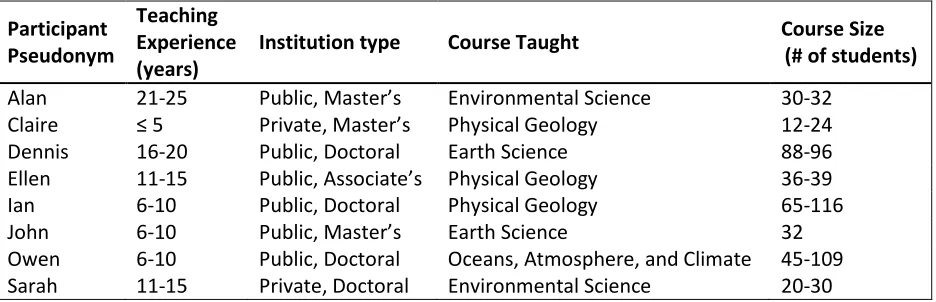
geoscience courses at eight different institutions. Instructor pseudonyms as well as information about their teaching experience, institution, and courses are provided in Table 1.
Table 1. Study Participants.
Participant Pseudonym
Teaching Experience (years)
Institution type Course Taught Course Size (# of students)
Alan 21-25 Public, Master’s Environmental Science 30-32 Claire ≤ 5 Private, Master’s Physical Geology 12-24 Dennis 16-20 Public, Doctoral Earth Science 88-96 Ellen 11-15 Public, Associate’s Physical Geology 36-39
Ian 6-10 Public, Doctoral Physical Geology 65-116
John 6-10 Public, Master’s Earth Science 32
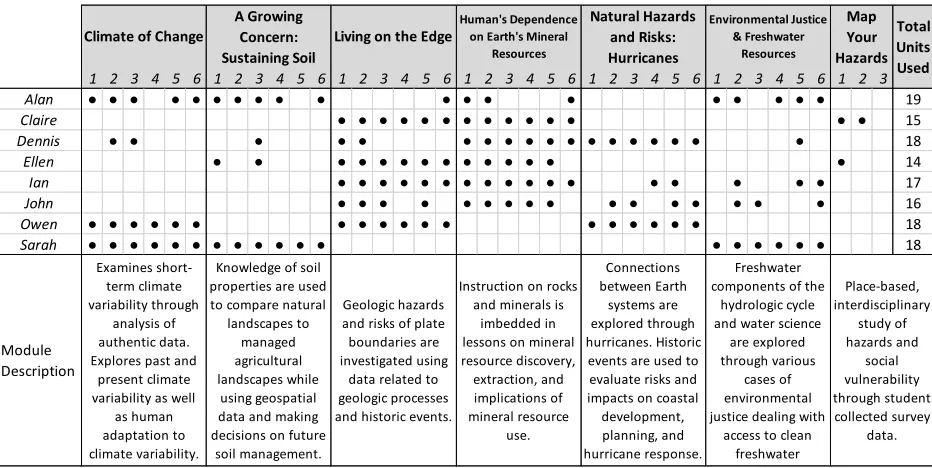
At the time of the study, seven completed InTeGrate modules were available for use by the instructors. Each module contains six units of material (except Map Your Hazards which has three units), and each unit was designed as a single lesson for one 50 minute class period. It was suggested that the instructors adopt 18 total units of material, and they were free to select the units that best fit their course. A brief description of each module can be seen in Table 2. After piloting the InTeGrate materials in their spring 2016 courses, the number of units used by the instructors ranged from 14-19 units (Table 2). Consequently, the InTeGrate resources were present in approximately 40% of the lessons for each course.
Table 2. InTeGrate modules and units utilized by the participating instructors.
Study Design
The research project utilized a quasi-experimental, non-equivalent groups design and occurred over three subsequent semesters following the summer 2015 meeting. The first
semester (fall 2015) served as a control semester, where the participating instructors taught their courses using the materials and methods that they had employed in prior versions of the class. In
1 2 3 4 5 6 1 2 3 4 5 6 1 2 3 4 5 6 1 2 3 4 5 6 1 2 3 4 5 6 1 2 3 4 5 6 1 2 3
Alan ● ● ● ● ● ● ● ● ● ● ● ● ● ● ● ● ● ● ● 19
Claire ● ● ● ● ● ● ● ● ● ● ● ● ● ● 15
Dennis ● ● ● ● ● ● ● ● ● ● ● ● ● ● ● ● ● ● 18
Ellen ● ● ● ● ● ● ● ● ● ● ● ● ● ● 14
Ian ● ● ● ● ● ● ● ● ● ● ● ● ● ● ● ● ● 17
John ● ● ● ● ● ● ● ● ● ● ● ● ● ● ● ● 16
Owen ● ● ● ● ● ● ● ● ● ● ● ● ● ● ● ● ● ● 18
Sarah ● ● ● ● ● ● ● ● ● ● ● ● ● ● ● ● ● ● 18
Module Description Map Your Hazards Total Units Used Examines short-term climate variability through analysis of authentic data. Explores past and
present climate variability as well
as human adaptation to climate variability.
Knowledge of soil properties are used to compare natural
landscapes to managed agricultural landscapes while
using geospatial data and making decisions on future
soil management.
Geologic hazards and risks of plate boundaries are investigated using
data related to geologic processes and historic events.
Instruction on rocks and minerals is
imbedded in lessons on mineral resource discovery, extraction, and implications of mineral resource use. Connections between Earth systems are explored through hurricanes. Historic events are used to evaluate risks and impacts on coastal development, planning, and hurricane response.
Freshwater components of the
hydrologic cycle and water science
are explored through various
cases of environmental justice dealing with
access to clean freshwater Place-based, interdisciplinary study of hazards and social vulnerability through student collected survey data. Climate of Change
A Growing Concern: Sustaining Soil
Living on the Edge
Human's Dependence on Earth's Mineral
the following spring 2016 semester, participants piloted a revised version of their course by incorporating InTeGrate materials and replacing many of their standard materials. The pilot semester allowed the instructors to become familiar with the InTeGrate materials and their use, while addressing any issue that might arise when using new materials for the first time. In an effort to ensure similar student populations, the project plan was to compare assessment results among students in the two fall semesters (control 2015 vs. treatment 2016). Fall 2016 served as the treatment semester, and instructors used the InTeGrate materials for the second time while making appropriate adjustments based on their experiences in the pilot semester.
Quantitative data was collected using a pre-post geoscience literacy assessment during each semester. Students also completed a pre-post attitudinal survey (InTeGrate Attitudinal Instrument, IAI) that provided student demographic information on gender, ethnicity, race, rank, and age. Each participating instructor administered a paper version of the quantitative pre-post assessment in their courses, and all assessment data was sent to the SERC office for data processing and digitization. The IAI survey was completed online by students at the beginning and end of each course.
Quantitative Instrument
GLE questions that targeted Earth (4 questions) and climate literacy (1 question). The remaining three questions were taken from the Geoscience Concept Inventory (GCI, Libarkin and
Anderson, 2006) and targeted concepts related to plate tectonics. The rationale for including additional Earth literacy and GCI questions was to improve alignment between the assessment and InTeGrate content used by the participating instructors, since the Living on the Edge and Earth’s Mineral Resources were the most widely used modules (Table 2).
All GLE questions are classified as either level 1 or level 2. Level 1 questions are single option multiple choice questions at the “remember” and “understand” level of Bloom’s
taxonomy (Bloom, Engelhart, Furst, Hill, & Krathwohl, 1956). Level 2 questions are multiple mark type questions and classify at the “applying” and “analyzing” levels of Bloom’s taxonomy.
Of the 16 GLE questions contained in the instrument, nine were level 1 and seven were level 2. Multiple mark items were scored using a partial credit algorithm which improves the reliability and discriminatory power of the items versus using dichotomous scoring where all options must be marked or unmarked correctly to get full credit. The formula used is method six as described by Hsu et al. (1984), and assumes that incorrect choices are the result of guessing. Partial credit is determined by subtracting the probability for incorrect choices from the proportion of correct choices (marked answers and unmarked distractors) made.
All data analysis was conducted using IBM Statistical Package for the Social Sciences (SPSS) 25. Only data form students with paired pre- and post-test GLE results were used in the analyses. Alan’s post-GLE data from his treatment semester was incomplete, so the results from
the average gain. These data points were eliminated from analysis, as it is improbable that they would regress this much after completing a geoscience course and their post-test GLE results are reflective of a lack of effort and not their true ability.
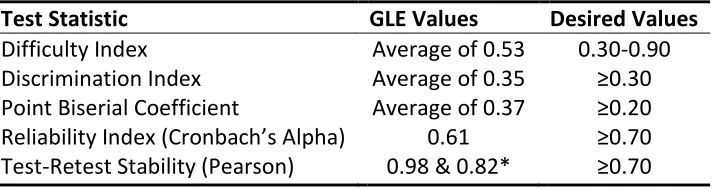
Classical Test Theory was used to establish measures of reliability and discriminatory power of the instrument for the pre-test administration during the control semester. Test statistics for three item-analysis and two test-analysis measures are provided in Table 3, along with
recommended values from Kline (1998) and Ding and Beichner (2009). The difficulty, discrimination and point biserial all represent item level statistics and fall within the desired values. The Cronbach’s alpha reliability value is below the desired value, but Adams and
Wieman (2011) caution that a high internal consistency is not the best indicator of reliability for an assessment that is measuring multiple constructs or concepts. They suggest a test-retest stability coefficient as an alternative measure of reliability, where retesting is done using two similar student populations as opposed to administering the same test twice to a single group. To accomplish this, pre-test values from students in the control and treatment semesters were compared. Since these populations were of different sizes (n = 343 and 254), a Pearson
correlation was determined by correlating the 16 difficulty and discrimination indices form the control semester with the values from the treatment semester.
Table 3. Test statistics from the pre-test administration during the control semester. Sample size n = 343 students. The desired values are those suggested by Ding and Beichner (2009). * = correlation of difficulty and discrimination indices (respectively) between semesters.
Test Statistic GLE Values Desired Values
Difficulty Index Average of 0.53 0.30-0.90
Discrimination Index Average of 0.35 ≥0.30
Point Biserial Coefficient Average of 0.37 ≥0.20
Reliability Index (Cronbach’s Alpha) 0.61 ≥0.70
Results
Normalized change scores were calculated for each student with paired pre- and post-test data and used in the majority of comparison analyses. Normalized change accounts for post-test scores that are lower than pre-, by normalizing for the amount of points that could have been lost. It provides an advantage over the single formula normalized gain (post-pre/100-pre) in comparing the change in performance between groups (Marx & Cummings, 2007). Independent t-tests were run to compare pre-test, post-test, and normalized change between all students in both the control and treatment semesters. Values reported represent mean ± the standard deviation. Students in the control semester (n=327) had higher scores on the pre-GLE
(11.83±3.24) than did students in the treatment semester (n=254) (11.19±3.24), a statistically significant difference of 0.64 points (t(579)=2.35, p=0.019, d=0.2). Students in the control semester also had higher post-GLE scores (13.34±3.27) than students in the treatment semester (12.83±3.55), but this was a non-significant difference of 0.51 points (t(579)=1.8, p=0.073, d=0.15). Students made significant gains from pre- to post-GLE in both the control (1.51±2.94 points, p<0.001, d=0.46) and treatment semesters (1.64±2.78 points, p<0.001, d=0.48).
Normalized change scores were non-significantly different (t(579)=-0.42, p=0.678) between students in the control (0.13±0.235) and treatment (0.138±0.231) semesters.
Factorial analyses of variance (ANOVA) were conducted to examine if the effects of InTeGrate materials on GLE normalized change scores vary depending on the instructor or on demographic characteristics of the classes. Table 4 provides a summary of the ANOVA results for both main effects and interaction effects. A significant main effect indicates that an
interaction effect indicates that the effect of one independent variable on the dependent variable depends on the level of the other independent variable. In the case of a significant interaction effect, simple main effects were analyzed with a post hoc test to explore all pairwise
comparisons among the independent variables.
Table 4. Summary of ANOVA results on GLE normalized change scores. Asterisks indicate significant main effects (*) and significant interaction effects (**) at the 95% confidence level.
There was a statistically significant interaction between InTeGrate use (control vs. treatment) and instructor on normalized change score. An analysis of simple main effects for instructor revealed that there was a significant difference in normalized change scores from control to treatment for students in Owen’s (F(1,567)=9.79, p=0.002, partial η2=0.017) and Sarah’s (F(1,567)=8.35, p=0.004, partial η2=0.015) courses. Using only data from within Sarah
Source Type III SS df F p ηp2
Phase 0.024 1 0.473 0.492 0.001
Instructor 2.347 6 7.845 < 0.001* 0.077
Phase * Instructor 1.056 6 3.529 0.002** 0.036 Corrected Total 31.572 580
Phase 0.007 1 0.132 0.716 0.0
Gender 0.38 1 7.245 0.007* 0.015
Phase * Gender 0.225 1 4.292 0.039** 0.009
Corrected Total 25.397 475
Phase 0.133 1 2.568 0.11 0.006
Ethnicity 0.359 1 6.916 0.009* 0.015
Phase * Ethnicity 0.133 1 2.555 0.111 0.006 Corrected Total 23.415 445
Phase 0.136 1 2.562 0.11 0.007
Race 0.512 3 3.227 0.023* 0.024
Phase * Race 0.279 3 1.759 0.155 0.013
Corrected Total 21.448 398
Phase 0.066 1 1.244 0.265 0.003
Rank 0.465 3 2.909 0.034* 0.018
Phase * Rank 0.006 3 0.037 0.99 0.0
Corrected Total 25.269 471
and Owen’s courses, independent t-tests were run to compare normalized change scores between
the control and treatment semesters. These tests reveal significant differences with a moderate effect size in Owen’s course (t(149)=-3.41, p=0.001, d=0.56) and a large effect size in Sarah’s
course (t(41)=-2.577, p=0.014, d=0.80). No other instructors saw significant GLE gains in their courses between the control and treatment semesters.
There was a statistically significant interaction effect between gender and InTeGrate use (Table 4, Figure 1). An analysis of simple main effects for gender was performed, with all pairwise comparisons being run for each simple main effect with p-values Bonferroni-adjusted within each simple main effect. Females had normalized change scores 0.052 points higher in the treatment semester than in the control semester, a slightly nonsignificant difference (p=0.052). Males had normalized change scores 0.037 points lower in the treatment semester than in the control semester, which was also non-significant (p=0.274). Males had normalized change scores 0.103 points higher than females in the control semester, a statistically significant difference (F(1,472)=11.28, p=0.001, ηp2=0.23). The difference of 0.013 points in the Treatment semester