Applicability of Advanced Design Method of Graphite Components by
Microstructure-Based Brittle Fracture Model
Masahiro Ishihara, Tsuneo Takahashi and Satoshi Hanawa
Japan Atomic Energy Research Institute
ABSTRACT
An analytical investigation of a Microstructure-based brittle fracture model was performed. The fracture model was applied to the strength prediction of graphite under varying stress gradient from tensile to bending test; the stress
gradient was produced by changing different stress combination of tensile and bending stresses. The parameters using the fracture model are grain size, pore size and pore distribution etc., and these were determined from image analysis data by the microstructural observation of the graphite. Obtained analytical result was compared with experimental data. For the tensile and bending strengths the fracture model had a fairly good prediction of not only an average strength but also strength distribution. On the other hand, the fracture model predicted a slightly lower strength than the experimental datafor the combined tensile and bending stress condition. The Weibull theory was also applied to the strength prediction under the stress gradient condition. The theory had almost the same strength as the fracture model.
INTRODUCTION
In general, there are two major methods in a design of graphite structure, deterministic and probabilistic approaches. The deterministic approach is widely applied to a metallic structural design as well as a graphite structural design. In the approach stress in the structure is limited with several categorized conditions such as membrane stress, bending stress and/or peak stress [ 1,2]; these stress limits are stipulated from an empirical viewpoint of the structural integrity so that the structure does not fracture under stress gradient condition. On the other hand, in the probabilistic approach the stress in the structure is normally limited taking into consideration of allowable risk of fracture for the structure from a viewpoint of the total plant safety.
In both approaches it is necessary to obtain a great number of strength data in order to define the fracture condition of the structure; normally the data are obtained from specimens with simple geometry under simple stress condition, e.g. a round shaped specimen with uniform tensile stress condition and so on. Furthermore, it is also necessary to conduct detail stress analysis using a finite element method etc. to obtain the stress profile in the structure. Generally, the obtained stress in the structure has a complex profile due to complex geometry as well as complex loading conditions. Actually, to get categorized stresses it is necessary to recalculate using the obtained stress profile in the structure.
However, the categorized stresses have a different stress gradient compared with stren~h data obtained in the material testing. Namely, the categorized stress have various kinds of stress gradients, but on the other hand stren~h data in experiment is very limited condition such as tensile as well as bending test conditions; it is well known that the strength of graphite is affected by the stress gradient, so called stress gradient effect on the strength [3]. Consequently, from a limitation of material testing condition large safety margin is normally compelled to introduce with these approaches. From a viewpoint of advanced component design philosophy it is important to eliminate the needless safety margin.
There are several promising models to evaluate the strength of graphite with statistical approach; e.g. the Weibull theory [4,5], competing risk-based fracture model [6] etc. The Weibull theory treats only macroscopic stren~h with probabilistic procedure taking into consideration of the stress profile. The competing risk-based fracture model is similar to the Weibull strength model, moreover it can treat different macroscopic fracture modes, e.g. surface flaw dominated fracture mode as well as internal flaw dominated one. Recently, Burchell proposed an excellent fracture model, microstructure-based brittle fracture model, being applicable to the tensile strength [7]. In the model, grain size, pore size and pore distribution in the graphite body are treated on the basis of the linear fracture mechanics with
SMiRT 16, Washington DC, August 2001
Paper # 1920
probabilistic approach, and it is possible to predict, moreover, the macroscopic stren~h, not only average strength but also strength distribution. Nakanishi et al. [8] and Takahashi et al. [9] promoted the model so as to predict a bending strength.
From a standpoint of the brittle fracture of graphite components it is expected that the more realistic fracture model will have an advantage to predict the strength under complex stress profile. Therefore, the applicability of the microstructure-based brittle fracture model to the complex stress profile was investigated in an analytical approach. The model was applied to the strength under varying stress gradient condition from tensile strength to bending strength, and the predicted strength by the model was compared with experimental results. Moreover, the Weibull theory was also applied in the same stress gradient condition, and the prediction result is compared with the estimated strength by the microstructure-based brittle fracture model.
ANALYSIS
Microstructure-Based Brittle Fracture Model (1) Uniform Stress Condition (Burcheli model [7])
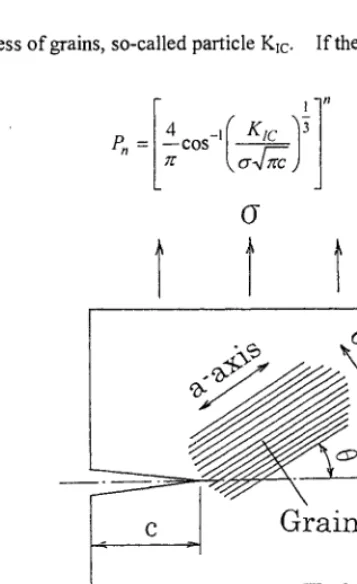
The grain of graphite consists of a stack of parallel hexagonal net planes as schematically shown in Fig. 1. Since weak van der Waais force operating in the c-axial direction and strong covalent bonds connection in the a-axial direction, cleavage within the grain occurs easily in the c-axial direction. If the inherent flaw in the graphite body faces a grain having inclination angle 0 as shown in Fig.l, the crack would deviate from its extension direction. When the uniform stress a acts inherent flaw size c, probability of one grain will fracture, Pf, is:
1
4
1( KIC :)3
Pf = t a c o s -
(1)
where, KIc is a fracture toughness of grains, so-called particle Kxc. all grain will fail, Pn, is:
P.-
cos-'
,c')
(7
t
t
If there are n grains in the entire low, probability of
(2)
r I
c-axis : van der Waals force a-axis :covalent bonds
Fig. 1
(Y
Here, it is assumed that the flaw will extend at a grain size, a, if the entire low with n grains fail. Therefore, the Eq(2) is thought to be the probability that the flaw size c will extend fi'om length c to length c+a. The probability that the flaw will extend from c to c+ia, i.e. fracturing i rows of grains, is then expressed as:
( )lln
Pn = i=0 cos-1
cr~fir(K2+ ia)
(3)
where, this may be approximated to
F ( ) l
4In Pn = n
Iln --cos -tK1c
o L :¢
cr4~'(C + ia) ~ di
(4)Now, when the probability f(c)dc means that initial flaw size has a length between c and c +dc, the probability that one tip of a single flaw will fracture under applied stress a may be written as:
oo
I f ( c ) . p,, (cr, c)dc
0
(5)
Then, the survival probability Ps is given as:
oo
P, = 1- [f(c). p,(o-,c)dc
0
(6)
Here, when N is the number of pores per unit volume and V is the specimen volume, the total survival probability of the volume V under stress ~ , having 2NV flaw tips is (Ps) 2Nv. Therefore, the total fracture probability of the specimen may be written as:
Pfto, = 1-(Ps) 2NV = 1- 1- f ( c ) . pn(cr, c)dc
0
(7)
(2) Stress Gradient Condition (Expanded Model with Divided Small Elements [9])
If the specimen has a large stress gradient, it would be necessary to divide into small elements so as to regard almost the uniform stress within the small elements as schematically shown in Fig.2. When the stress and volume of (kk,jj) element are cr (kk,jj) and V(kkjj), respectively, the survival probability of the element is:
Ps(kk,jj)= 1- f(c). pn{cr(kk,jj),c
0
(8)
Therefore, the total fracture probability of the specimen may be written as:
I,.,, j., oo
'°tot
= 1 - H U
1- f(c).p,,
(kk,jj),c dc
k=kl J=Jt
(kk ,Jj )
Weibull Strength Theory
If tensile stress and bending stress are applied simultaneously as shown in Fig.3, the neutral axis will move, and the tensile stress region will expand. When y' denotes the moving distance of the neutral axis, y' is:
b h 3
y ' = ~ . c r t (10)
12M
where, b and h are width and height of the specimen, respectively, and M and o t are applied moment and tensile stress, respectively. Therefore, the risk of rupture Rtb defined by Weibull is:
, <
when y h/2
~2 ICrbWO'tl m Rtb= o- y' k, 0"'0 .... J dv
h --" ~bh3
12M
12M m
=bh3~ Y + o" t
dr 0 • l . b . d y (11)
1 b . h . l 1
(cr0)m 2(m + 1) O'bmax
r t + O'max )m+l
when y' > h/2
Rtb = .. d v
2"
12M m
h 7 y + cr t
=~~-
~o .z.b.ayl b . h . ,
1 ~
)m+,
)m+,}
= - - - - - - O't + O"b max -- (O't -- O"b max
(o. 0)m 2(m + 1)O'bmax
(12)
where, m and cr o are the Weibull modulus and scale parameter in the Weibull probability, respectively, crb and l are the bending stress and length of the specimen, respectively, and cr bmax is the maximum bending stress defined by:
6M
(13)
O'b max = ) ) h 2'
Here, the risk of rupture for the tensile stress under same specimen volume is"
h
w
dv
Rt = \ cr o ,)
h 2
_ 1
),,,
_ (o.0),,---;-(o-, .b.h.z
(14)
[
t
k=kt to knJ
r ! , l , l i
\
I'
'\O" (kk,jj)"*- V(kk,jj)
Stress
Tensile Bending
C o m b i n e d
Y
• h / 2 1 + 2
h / 2 ~
h/20 t Y Sbmax Y~St Sbma,~
0 U 9 0 / U
-
ta/2
0
Fig.2 Application ofmicrostructure-based brittle Fig.3 fracture model to stress gradient condition.
Application of Weibull theory to combined tensile and bending stress condition.
RESULTS AND DISCUSSIONS
Pure Tensile Test
The tensile strength of nuclear grade graphite, H-451, was estimated by the Eq.(7) on the basis of the microstructure-based brittle fracture model. Input parameters are summarized in Table 1. In the table Microstructural parameters were obtained by BurcheI1 from an image analysis with microstructural observation, and specimen parameter was determined by the specimen size [ 10]. Here, pore size distribution f(c) in Eq.(7) was assumed to be a log-normal statistical distribution, and standard deviation parameter was determined so as to fit the mean tensile strength in the analysis. Figure 4 shows the prediction and experimental results. We can see from this figure that the microstructure-based brittle fracture model has a fairly good prediction of the tensile strength distribution.
Table 1 Input parameters of H-451 graphite.
Parameter value
Mean grain size ( tz m) 500* Bulk density (~cm 3)
Mean pore size ( tz m) Standard deviation parameter of pore size Mean pore area ( tz m 2)
Number of pores per
v o l u m e ( m "3)
Specimen volume (m "3) Specimen breadth(mm) Grain fracture toughness
(MN/m 3/2)
*:from ref.r71. **'from ref.
1.79" 42* 2.3
700* , . . 2.97xi0 s*
4.65x10 "v** 10.29"*
0.285*
lOl
Fig.4
I00
0 • E x p e r i m e n t [10] 0 f ~
• Analysis 0
._. 70
>,
•
~ 60
5o
-~
= ~40
~~
o 30
'0 20
10 H-451 graphite
0 . . . . [ ... 1 . . . . I . . . . I . . . .
0 5 10 15 20 25 30
Tensile strength (MPa)
Pure Bending Test
Microstructure-based brittle fracture model was applied to the four point bending test by Eq.(9). The predicted analytical result is plotted with experimental data [ 10] in Fig.5. We can see from this figure that the model has a good bending stren~h prediction, although the predicted variance of the bending strength is somewhat smaller than the experiment; namely, the expanded model with divided small elements is applicable to the bending strength condition.
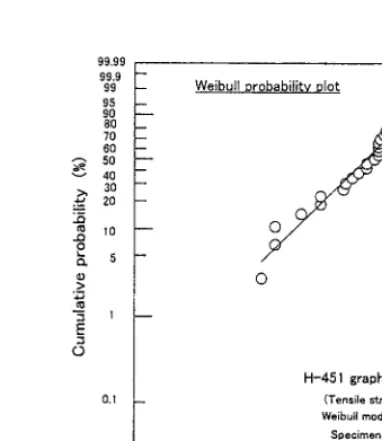
The prediction by Weibull theory was also carried out to the bending strength condition. If we set cr t=0 in Eq.(11), it is possible to predict the pure bending strength by Weibull theory using Eq.(11) and Eq.(14). Here, the Weibull modulus, m, is determined by the tensile strength data [ 11 ] from a Weibull probability plot as shown in Fig. 6. The predicted mean bending strength by Weibull theory was 22.1 (MPa), which is a fairly good prediction compared with experimental mean bending strength of 22.0 (MPa). However, it is not possible to predict the stren~h distribution such as the microstructure-based brittle fracture model; this is thought to be a disadvantage of the theory from a viewpoint of an assessment of structural integrity.
100
90 8070
,,._,, >, • *"- 60 e~0 ~- 50 e~ ._> _.~ 40
E 0 30
2O
10
o: Experiment [11o ~
--
: Analysis o / j /
O l
/ o °°
o
H-'451 graphite
, , , ~ - i ! I i i ,
10
20
30
40
Bending strength (MPa)
i t
1
5O
99.99 99.9 - -
99 - - 95 - - 9 0 - - 8 0 _ 70 - - 60 - - 50 _ - - " ~ " 4 0
30 - - 20 - - . Q
0 5 -
° _
E 0
0 . 1 _
0.01 0.5
Fig. 5 Prediction of four point bending strength Fig. 6 of H-451 graphite by microstructure-based
brittle fracture model.
W e i b u l l p r o b a b i l i t y p l o t
/
©
H - 4 5 1 g r a p h i t e ( T e n s i l e s t r e n g t h data) Weibutl m o d u l u s m=8.6
S p e c i m e n " n=25
I I I I I I I I I 06 0.7 0.8 0.9 1.0 1.! 1.2 1.3 1 4 .5
M e a n s t r e n g t h ( S L / S t m e a n )
Weibull probability plot of tensile stren~h of H-451 graphite [ 10].
Combined Tensile and Bending Test
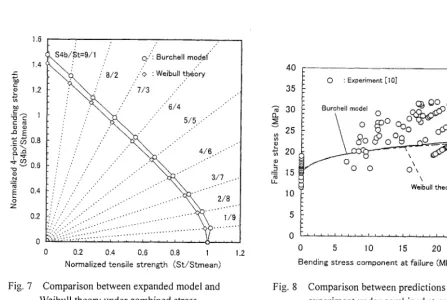
The expanded model with divided small elements was applied to the several kinds of stress gradient conditions produced from a combination of tensile and bending stresses; the stress gradients was changed into nine conditions in this study. The predicted result was plotted in Fig.7 by normalized mean tensile strength. The Weibull theory was also applied to the combined stress gradient condition, and also plotted in Fig.7. From this figure we can see that both predictions have almost a good agreement, although the expanded model has a slightly higher strength prediction. Namely, fracture of the grain treated in the microstructure-based brittle fracture model may correspond to the link in the Weibull theory, so-called weakest link theory; i.e. the link in the Weibull theory may be equally treated as the grain in the microstructure-based brittle fracture model.
Both prediction results were compared with experimental data [10], and the failure stress is plotted in Fig.8 as a function of applied bending stress component; here, the bending stress component corresponds to the stress gradient. From comparison between predictions results and experimental data the prediction shows smaller failure stress than the experiment.
In the experiment combined strength test was performed as following two manners:
was applied until the specimen was fractured.
(ii) Bending stress preloading test; first bending stress was applied at certain stress level, then the tensile stress was applied until the specimen was fractured.
One of the reason why the smaller prediction might be thought from the experimental difficulty. Namely, combined
pre- and post-loading might interfere with each other; the bending load produced curvature in the specimen, on the other
hand tensile load reduced the curvature. As a result of the interference experimental data might be larger than the
predicted ones.
1.6 i " :' ."" ' ,-"" t=9/1 :: o,": Burehell mod.ef 1.4
[ ~ ' ,"' 8/2 ,."o : Weibull the'ory
£
~ 1.2 f [" " ~ \ / " ~ ,," 7/3 , " ,,
bll
=5 c- 1 '" ~ < ,,,'"" 5 / 5 . . " " "
m E
4-a 4.J = m 0.8
"5 ~ 13.-.13 [ / ." ..'" ,'" ~ ' ~ ,.'"'" 4/6 ...
"~" ".~ 0.6
. . .
N
,.'"
, , " "Z . ' "
.'. .-
0
0 0.2 0.4 0.6 0.8 1 1.2 Normalized tensile strength (St/Stmean)
Fig. 7 Comparison between expanded model and
Weibull theory under combined stress condition at fracture.
40
35
30 CL
25 ~" 20
° i
x_
• == 15
la_
10
Fig. 8
O " Experiment [10] O OO cp 6 ~ ° -
,,mo e, o
\
o ~ oqzOW~ ..#~- O
\ o o o oo~ ~o 0 0 O \
\ WeJbull theory
I _ L I I I I I I I ! | I I ! I [ [ I I ! I ! I I ! I I I ! !
0 5 10 15 20 25 Bending stress component at failure (MPa)
Comparison between predictions and experiment under combined stress
condition at fracture.
i
3O
C O N C L U S I O N S
The applicability of the microstructure-based brittle fracture model under stress gradient condition was
investigated in an analytical approach. The fracture model was applied to the strength of graphite under varying stress
gradient condition from tensile to bending test. The stress gradient was produced from changing different stress
combination of tensile and bending stresses. The obtained results in this study are as follows:
- the fracture model had a fairly good prediction in tensile and bending strengths not only average strength but also strength distribution,
- for the combined stress condition, the fracture model predicted a slightly lower stren~h than experimental data,
- predicted strength under combined stress condition by the fracture model was almost the same as the Weibull theory.
It could be expected that the more realistic prediction of graphite strength will be achieved from the microstrucmre-based brittle fracture model, because the model can treat fundamental microstructural feature closely
related to macroscopic strength. It is concluded from a viewpoint of general application that the fracture model has an
N O M E N C L A T U R E
a
b c
f(c)
h
1
m M n N
Kic
Pf
Pn Ps
Ptot
Rtb
Rt V y'
(7
Ob
o bm,× = maximum bending stress
o t = tensile stress
cr o = scale parameter
= grain size
= width of the specimen
- inherent flaw size
= flaw size distribution
= height of the specimen
= length of the specimen
- Weibull modulus
= moment
-- number of grains in the low
- number of pores per unit volume
= fracture toughness of grain
= probability of one grain fracture
= fracture probability o f n grains in the entire low
= survival probability with one tip of single flaw
= total fracture probability of the specimen
= risk of rupture of combined tensile stress and bending stress condition
= risk of rupture of tensile stress
= specimen volume
= moving distance of neutral axis
= uniform applied stress
= bending stress
R E F E R E N C E S
1. Iyoku, T., Shiozawa, S., Ishihara, M., Arai, T. and Oku, T., "Graphite core structures and their structural design
criteria in the HTTR", Nuclear Engineering and Design, Vol. 132, 1991, pp.23-30.
Svalbonas, V., Stilwell, T. and Zudans, Z., "Evaluation of the structural integrity of high temperature gas-cooled reactor (HTGR) core and core support elements", F-C4230, 1976.
Brocklehurst, J.E., "fracture in polycrystalline graphite", TRG Report 2302(s), 1973.
Weibull, W., "A statistical theory of the strength of materials", Proceedings of Royal Swedish Institute for Engineering Research, No.151, 1953.
Price, R.J. and Cobb, H.R.W., "Application of Weibull statistical theory to the strength of reactor graphite", CONF701105, 1970, pp.547-566.
Ishihara, M., Iyoku, T. and Shiozawa, S., "New approach for fracture assessment of graphite", Transactions of the 13 th International Conference on Structural Mechanics in Reactor Technology, Port A l e g e , Brazil, August, Vol.2, 1995 pp.491-496.
Burchell, T.D., "A Microstructurally based fracture model for polygranular graphites", Carbon, Vol.34, No.3, 1996, pp. 297-316.
Nakanishi, K., Arai, T. and Burchell, T.D., "Assessment of brittle fracture theory based on mesoscopic fracture mechanics of multiple grain/pore systems in graphite and SIC", Extended Abstracts of International Symposium on Carbon Science and Technology for New Carbons, pp.332-333, Tokyo, 1998.
Takahashi, T., Ishihara, M., Baba, S. and Hayashi, K., "Effects of grain and pore size distributions on strength of graphite", Abstracts on EUROCARBON 2000, 1 St World conference on Carbon, July, Berlin, 2000.
10. General Atomic, " HTGR generic technology program fuels and core development", GA-A15093, 1978, pp.3-1 to 3-17 & pp. 3-52 to 3-70.