ABSTRACT
LAMPRON, LAUREN ANNELIES. The Perceptions of Parents of Children Who Live in the Attendance Zone of a Title I Elementary School Regarding the Implementation of Word
Analysis Technology. (Under the direction of Dr. Bonnie C. Fusarelli and Dr. Michael E. Ward). This study explored the willingness of parents of children, ages birth to three, who lived in the attendance zone of Title 1 elementary schools, to implement language environment analysis technology and to change behaviors in order to increase the literacy skills of their children. Interest in these activities was moderate to high.
I found limited statistically significant relationships among the willingness to engage in the various activities and parental demographic characteristics. There were 6 statistically
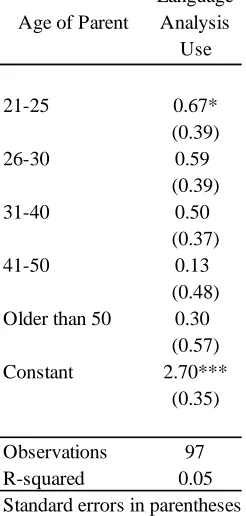
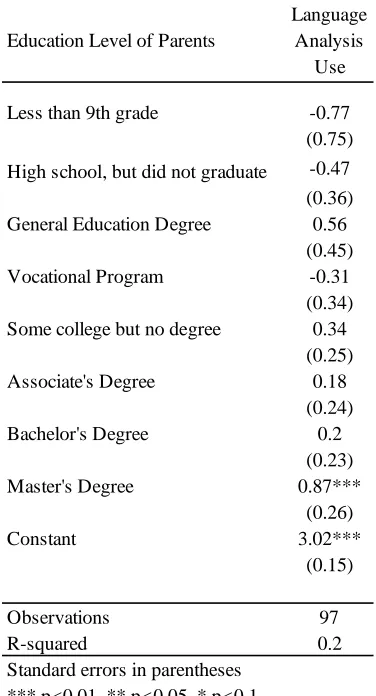
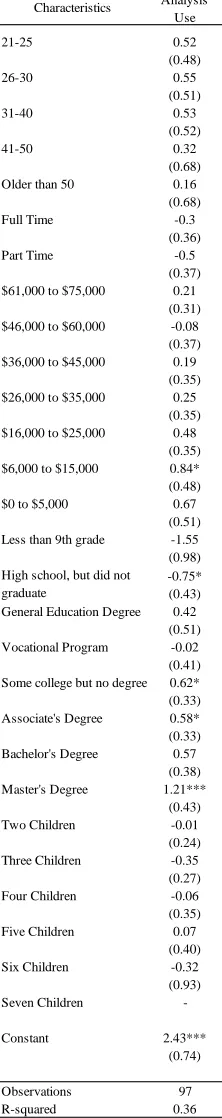
significant results. Parental education levels demonstrated an effect as related to interest in word analysis technology components as follows: there was a decrease in interest for parents who attended high school but did not graduate and an increase in interest for parents with
an associate’s degree and some college but no degree (p<.1). At the p<.01 level, parents with a master’s degree reported an elevated level of interest in word analysis components. In addition, there was a statistically significant increase in interest in word analysis technology among parents reporting the annual household income in the low income range of $6,000 to $15,000 range (p<.01).
Parent participants who attended high school but did not graduate were less willing to change behaviors to improve the literacy skills of their children than parents who graduated from high school; this difference was statistically significant (p<.01). Though not statistically
The generally high level of interest in language environment analysis technology and willingness to change daily behaviors that are evident in this study warrant the attention of policymakers and practitioners. Additional research is also in order to address some of this study’s limitations. It is important to determine how to effectively support low-income parents to
The Perceptions of Parents of Children Who Live in the Attendance Zone of a Title I Elementary School Regarding the Implementation of Word Analysis Technology
by
Lauren Annelies Lampron
A dissertation submitted to the Graduate Faculty of North Carolina State University
in partial fulfillment of the requirements for the degree of
Doctor of Education
Educational Administration and Supervision
Raleigh, North Carolina 2019
APPROVED BY:
_______________________________ _______________________________ Dr. Bonnie C. Fusarelli Dr. Michael E. Ward
Committee Co-Chair Committee Co-Chair
DEDICATION
BIOGRAPHY
After graduating from West Chester University with a Bachelor of Science in
Psychology, Lauren Annelies Lampron joined the eastern North Carolina Corps of Teach for America. She earned her teaching credentials through the alternative licensure program at East Carolina University. Subsequently, she earned a Master of School Administration degree at NC State University as a Northeast Leadership Academy Fellow. Her educational background
includes teaching 7th and 8th grade English and Social Studies, obtaining high school experience through a year-long principal internship, and being a middle school administrator. Sharing a passion for education reform, she and Phillip, her husband, reside in Edgecombe County, North Carolina, where they are both administrators. Lauren currently serves as the principal
ACKNOWLEDGMENTS
Giving all Glory to God, I am most thankful for the love He has gifted in my life. Sharing a life with my best friend, I am grateful for Phillip’s ongoing support and for always reminding me that “joy comes in the morning.”
I am thankful for the reassurance from family to finish this dissertation. Entertaining Luca while I worked, my mother and Mike provided time and encouragement for me to complete my work. Their love, support, and homemade dinners made me confident that I could finish. Offering support via our Three Musketeers group chat, my father and Aunt Gail provided
reassurance that I would make it through to the end of this process and that it would be worth the time invested.
Always offering encouragement, I thank my W.A. Pattillo Middle School family for their support. God truly aligned our workplace to be able to engage in meaningful work as we live our motto of “learning for all…whatever it takes.” Our team’s willingness to share additional duties allowed me to be closer to graduation, each day.
What a blessing it has been to have the support of such talented, passionate individuals to serve on my committee: thank you to Dr. Bonnie Fusarelli, Dr. Bill Harrison, and Dr. Colleen Paeplow. A continued thank you to Dr. Timothy Drake for his encouragement, willingness to meet virtually, and answering each email sent his way, each with the subject “final question.” Overwhelmingly, I am grateful for co-chair Dr. Mike Ward’s ability to simultaneously inspire me to complete thousands of his recommended edits while remaining relentless in encouraging me to meet deadlines.
TABLE OF CONTENTS
LIST OF TABLES ... viii
LIST OF FIGURES ... x
CHAPTER 1: INTRODUCTION ... 1
Chapter Introduction ... 1
Statement of the Problem ... 3
Programmatic Attempts to Address Literacy Deficiencies ... 5
Measuring Word Interactions ... 9
Purpose of the Study ... 10
Research Questions ... 13
Definition of Terms ... 14
Justification for the Study ... 17
Organization of the Study ... 18
Chapter Summary ... 19
CHAPTER 2: LITERATURE REVIEW ... 20
Chapter Introduction ... 20
Background for the Study ... 20
Literacy Gaps and Related Programmatic Responses over Time ... 21
The Role of Word Interaction and the Impact of Poverty on Word Interaction ... 27
Socioeconomic Status and Historic Patterns in Literacy Achievement ... 29
Contemporary Policy Context ... 33
Theoretical Framework ... 36
Pertinent Research and Professional Perspectives ... 39
Socioeconomic Correlates with Literacy ... 40
Socioeconomic Status and Parenting ... 41
Socioeconomic Status and Brain Development ... 44
Effects of Socioeconomic Status on Proficiency Scores ... 45
Early Literacy ... 47
Parent Education to Close the Gaps in Literacy ... 50
Literacy Education for Parents ... 51
Chapter Summary ... 59
CHAPTER 3: METHODOLOGY ... 60
Chapter Introduction ... 60
Research Design ... 60
Research Questions and Hypotheses ... 61
Research Questions ... 62
Hypotheses ... 63
Study Participants ... 63
Variables Addressed by the Study ... 64
Quantitative Methods ... 66
Data Collection ... 66
Instrumentation for Collection of Quantitative Data ... 66
Analysis of Quantitative Data ... 69
Quasi-Qualitative Methods ... 69
Data Collection ... 70
Instrumentation for Collection of Qualitative Data ... 70
Instrument Validity and Reliability ... 71
Instrument Validity ... 71
Study Procedures ... 73
Limitations of the Study ... 75
Assumptions of the Study ... 76
Chapter Summary ... 76
CHAPTER 4: FINDINGS ... 77
Chapter Introduction ... 77
Quantitative Results for Participant Demographics ... 77
Results for Research Questions ... 83
Research Question 1 ... 84
Research Question 2 ... 118
Chapter Summary ... 157
CHAPTER 5: DISCUSSION ... 159
Chapter Introduction ... 159
Summary of Findings ... 160
Discussion of Study Findings ... 166
Hypotheses ... 171
Researcher Reflections ... 172
Limitations of the Study ... 174
Recommendations for Research, Practice, and Policy ... 176
Recommendations for Future Research ... 176
Recommendations for Practice and Policy ... 178
Chapter Summary ... 180
REFERENCES ... 182
APPENDICES ... 205
Appendix A: The Words Count Survey ... 206
Appendix B: Expert Panel Validity Questionnaire ... 211
Appendix C: Request to Superintendent for Permission to Conduct the Study ... 215
LIST OF TABLES
Table 4.1: Number of Children and Number of Adults in Participant Households ...79
Table 4.2: Age of Parents Participating in the Survey ... 80
Table 4.3: Yearly Income of Parents Participating in the Survey ... 82
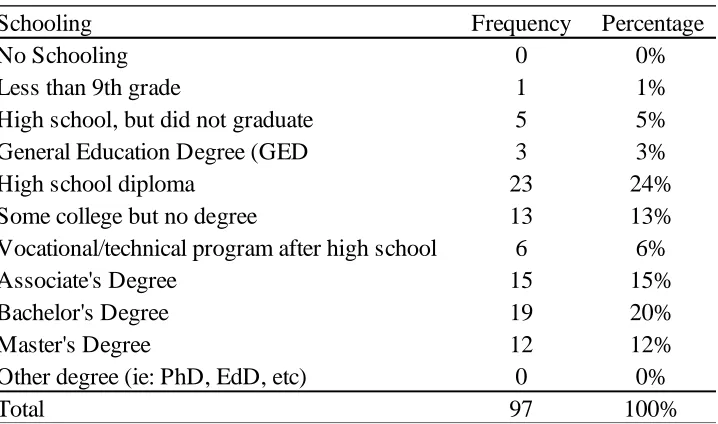
Table 4.4: Participants’ Highest Level of School Completed... 83
Table 4.5: Qualitative Responses to Using Language ENvironment Analysis Technology ... 86
Table 4.6: Participants’ Reported Interest Language Analysis Technology ... 88
Table 4.7: Research1 and Research2 Variables Explained ... 89
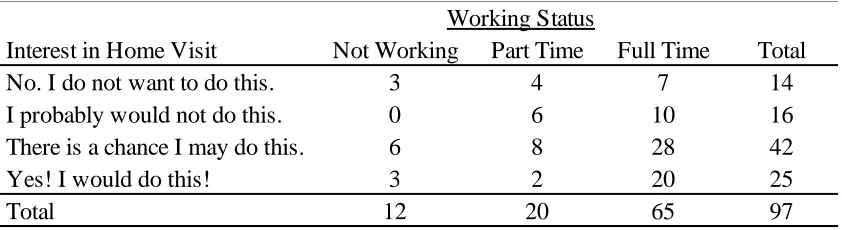
Table 4.8: Interest in Language Analysis Technology: Working Status and Home Visits ... 90
Table 4.9: Interest in Language Analysis Technology – Working Status and Clip On ... 90
Table 4.10: Interest in Language Analysis Technology – Working Status and Use App ... 91
Table 4.11: Interest in Language Analysis Technology – Working Status and Plugging in Device ... 92
Table 4.12: Regression among variables – Working Status and Interest in Language Analysis Technology Use ... 93
Table 4.13: Interest in Language Analysis Technology – Number of Children and Home Visits ... 94
Table 4.14: Interest in Language Analysis Technology – Number of Children and Device ... 95
Table 4.15: Interest in Language Analysis Technology: Number of Children and App ... 95
Table 4.16: Interest in Language Analysis Technology – Number of Children and Plugging in Device ... 96
Table 4.17: Regression among Variables – Number of Children and Interest in Language Analysis Technology Use ... 98
Table 4.18: Interest in Language Analysis Technology – Household Income and Home Visit ... 99
Table 4.19: Interest in Language Analysis Technology – Household Income and Clipping on Device ... 100
Table 4.20: Interest in Language Analysis Technology – Household Income and the App ... 100
Table 4.21: Interest in Language Analysis Technology – Household Income and Plugging in Device ... 101
Table 4.22: Regression of Household Income and Interest in Language Analysis Technology Use ... 103
Table 4.23: Interest in Language Analysis Technology – Age and Home Visits ... 104
Table 4.24: Interest in Language Analysis Technology – Age and Clipping on Device ... 105
Table 4.25: Interest in Language Analysis Technology – Age and Using the App ... 105
Table 4.26: Interest in Language Analysis Technology – Age and Plugging in Device ... 106
Table 4.27: Regression among Variables – Age of Parent and Interest in Language Analysis Technology Use ... 107
Table 4.28: Interest in Language Analysis Technology – Education Level and Home Visit ... 108
Table 4.29: Interest in Language Analysis Technology – Education Level and Clipping on .... 109
Table 4.30: Interest in Language Analysis Technology: Education Level and the App ... 110
Table 4.31: Interest in Language Analysis Technology – Education Level and Plugging in Device ... 110
Table 4.33: Regression of all Parental Demographic Characteristics and Interest in Language
Analysis Technology Use ... 114
Table 4.34: Willingness to Complete Actions that Foster Language Development ... 120
Table 4.35: Willingness to Change: Working Status and Text Messages ... 121
Table 4.36: Willingness to Change – Working Status and Support Group ... 121
Table 4.37: Willingness to Change – Working Status and the Library ... 122
Table 4.38: Willingness to Change – Working Status and Reading ... 123
Table 4.39: Willingness to Change – Working Status and Talking ... 123
Table 4.40: Willingness to Change – Working Status and Learning ... 124
Table 4.41: Regression among Variables – Working Status and Willingness to Change Behaviors ... 125
Table 4.42: Willingness to Change – Number of Children and Text Messages ... 126
Table 4.43: Willingness to Change – Number of Children and Support Group ... 126
Table 4.44: Willingness to Change – Number of Children and the Library ... 128
Table 4.45: Willingness to Change – Number of Children and Reading ... 128
Table 4.46: Willingness to Change – Number of Children and Talking ... 129
Table 4.47: Willingness to Change – Number of Children and Words ... 130
Table 4.48: Regression among Variables: Number of Children and Willingness to Changing Behaviors ... 131
Table 4.49: Willingness to Change – Household Income and Text Messages ... 132
Table 4.50: Willingness to Change – Household Income and Support Groups ... 133
Table 4.51: Willingness to Change – Household Income and the Library ... 133
Table 4.52: Willingness to Change – Household Income and Reading ... 134
Table 4.53: Willingness to Change – Household Income and Talking ... 135
Table 4.54: Willingness to Change – Household Income and Words ... 136
Table 4.55: Regression among Variables – Household Income and Willingness to Change Behaviors ... 137
Table 4.56: Willingness to Change – Age and Text Messages... 138
Table 4.57: Willingness to Change – Age and Attending Support Group... 139
Table 4.58: Willingness to Change – Age and the Library... 139
Table 4.59: Willingness to Change: Age and Reading More ... 140
Table 4.60: Willingness to Change – Age and Talking More ... 141
Table 4.61: Willingness to Change – Age and Words ... 142
Table 4.62: Regression among Variables – Age of Parent and Willingness to Change ... 143
Table 4.63: Willingness to Change – Education Level and Text Messages ... 144
Table 4.64: Willingness to Change – Education Level and Parent Support Group ... 144
Table 4.65: Willingness to Change – Education Level and the Library ... 145
Table 4.66: Willingness to Change – Education Level and Reading ... 146
Table 4.67: Willingness to Change – Education Level and Talking ... 147
Table 4.68: Willingness to Change – Education Level and Words ... 147
Table 4.69: Regression among Variables: Education Level and Willingness to Change Behavior ... 149
Table 4.70: Regression of all Parental Demographic Characteristics and Willingness to Change ... 151
LIST OF FIGURES
CHAPTER 1: INTRODUCTION Chapter Introduction
The National Commission on Excellence in Education’s landmark 1983 A Nation at Risk report prompted researchers to explore the field of education for areas of deficiencies. With language such as, “society being eroded as a rising tide of mediocrity” and “committing an act of unthinking, unilateral educational disarmament.” The repercussions of the 1983 report of “A Nation at Risk” moved public education to the top of the national policy agenda. Early studies regarding achievement gaps between White and Black students concluded that Black students’ “stereotype threats” created barriers to educational success while testing as Black students have
added concerns regarding how their test scores may confirm negative stereotypes associated with their race (Roach, 2000). However, these studies failed to elaborate on the fact that much of the gap was created prior to middle school and high school test-taking environments. Later studies found that the gaps in achievement (coined “achievement gap”) were rooted in gaps in language skills in elementary school (Snow, Burns, & Griffin, 1998). Useful research regarding the literacy gap in education is found within Hart and Risley’s (1995) findings regarding the 30 Million Word Gap. This gap occurs between the number of words heard by preschoolers in low and high-income households (Hart & Risley, 1995). The researchers recorded language
interactions in 42 households across a continuum of low, middle, and high-income levels. The longitudinal study lasted over two and a half years and the researchers found the number of words with which children interact was related directly to income levels and contributed to the rate in which children’s vocabulary grow.
relatively new innovation. Language environment analysis technology provides insight into the number of words spoken in the home as a means to educate parents about ways that they can increase the interaction their children have with words (Hoff & Naigles, 2002; Gilkerson &
Richards, 2009). When the device is used with birth to pre-K children, the language
environmental technology allows a child’s conversational talk turns with adults and the child’s babbling, to be converted into data. In turn, the feedback from the data allows parents or guardians to be more aware of the number of talk turns in which their child interacts (LENA Research Foundation, 2016b). A recent study demonstrated that children’s language interactions, specifically child directed speech and talk turns, correlates with building brain language regions independent of poverty levels. By focusing on increasing exposure to words, parents can utilize the benefits of malleable neural plasticity (Romeo et al., 2018).
Early pioneers in language environment analysis technology include researchers who attempted to study how deaf and hard of hearing children acquired speech (VanDam, Ambrose, & Moeller, 2012). In 1980, SALT (Systematic Analysis of Language Transcripts) was created to allow Madison School District’s speech language pathologists to use a computer to transcribe and interpret linguistic analyses efficiently. This advancement was needed as the technology allowed pathologists to receive data at a much greater rate than they could code by hand (Miller, 2017).
are to change their daily interactions with their child(ren) in order to read more and talk more with their child(ren). The willingness was matched with their parental demographic
characteristics to determine if a correlation was present between parental demographic characteristics and willingness to change.
The following sections address the statement of the problem, which includes historically low proficiency scores in North Carolina as determined by the Early Childhood Longitudinal Study, the National Assessment of Educational Progress, and North Carolina Department of Public Instruction End of Grade tests. The tests also demonstrate a correlation between
socioeconomic status and proficiency. The sections review a failed attempt to overcome the word gap with an initiative of parent training and measuring word interactions. Finally, the purpose of the study, definitions, and research questions are presented.
Statement of the Problem
Changes Lives by the National Literacy Trust, “in times of economic instability, low literacy makes individuals and communities more vulnerable to inequality, increasing the risk of social exclusion and undermining social mobility” (Dugdale & Clark, 2014, p. 5).
In a similar way to the efforts in the UK, researchers in the United States found comparable results regarding reading skills at the school entry level in Kindergarten. Reading skills have been used to predict future success (Duncan et al., 2007). The ability to read is a compounding process that occurs throughout a child’s educational experience. The Early Childhood Longitudinal Study found that many students who scored in the lowest one third of Kindergarteners in reading continued to score in the lowest one third in reading as third graders. This suggests that an intentional intervention may need to be in place in order for the lowest Kindergarten students to experience a level playing field at the time of entry in Kindergarten. The same results were found for the highest one-third of participants. For example, 65% of the highest scoring third grade students (as identified by the end of grade reading tests) were the same students who scored the highest in their respective end of year Kindergarten reading tests (Princiotta, Flanagan, & Hausken, 2006). It can be concluded that children who are proficient in early reading continue to remain proficient as their education continues.
between schools with 50% of more poverty and being rated as a D or F on an A-F scale in which A is the highest rank (NCDPI, 2016a). Using the rationale from the Early Childhood
Longitudinal Study, it is evident that intervention in high poverty communities needs to occur prior to children entering Kindergarten. This will help to ensure that students do not remain at the lower level of the state’s school rankings. The study assessed the perspectives of parents in low income communities and their receptiveness to language analysis technology to provide such intervention.
Programmatic Attempts to Address Literacy Deficiencies
Language development in the preschool period must be accelerated to disrupt the low proficiency levels across eastern North Carolina. The word gap, which has subsequent impact on children emerging into adolescence, is produced most markedly during the pre-school years. Word deficiency not only affects vocabulary growth and acquisition as children mature, but also impacts the exposure to amount of words in which the child interacts. For this reason, the first two to three years of life are the most important determining predictor of IQ, future school success, and future reading and speaking ability (Hart & Risley, 1995). As stated in their
research, “With few exceptions, the more parents talked to their children, the faster the children’s vocabularies were growing and the higher the children’s IQ test scores at age three and later” (Hart & Risley, 1995, p. 144).
A vocabulary equity gap has been observed in the degree to which the exposure to words differs across income levels (Hart & Risley, 1995). The researchers found that:
the average child in a professional family hears 2,153 words per hour; in four years,
the average working class child hears 1, 251 words per hour; in four years, the child
will interact with 26 million words.
the average child on welfare hears 616 words per hour; in four years, the child will
interact with 13 million words.
These fundamental findings of the research completed by Hart and Risley in 1995 came to be known as the 30 Million Word Gap. The researchers coined the name from their conclusion about the difference in word interaction; the subtraction of the 13 million words heard in the welfare recipient’s household from the 45 million words heard in the professional family’s household produces a difference of just over 30 million words (Hart & Risley, 1995). Critics may not argue that the tests are flawed as numerous research studies have confirmed that exposure to words impacts a child’s access to vocabulary growth and language acquisition as they mature into adolescence (Bayliss, 2015; Clark, 2007; Hart & Risley, 1995). It is apparent that the vocabulary deficiencies among low-income children and the gaps between them and their higher income peers begin at home. Among the 42 children observed in Hart and Risley’s (1995) study, the key findings included (a) a prediction of IQ based on the number of words a child hears from their parent, (b) a finding that advanced children had parents who talked more than those of the children who were determined to be almost as advanced, and (c) a positive correlation between the amount of talk heard from birth to three and success at age 10.
had significantly higher reading scores than students whose parents indicated that they did not enjoy reading (Mullis, Martin, Foy, & Drucker, 2012).
Programmatic reforms began to occur throughout the country to address pre-literacy deficits and the word gap. Such efforts resulted in the creation of Head Start and Early Head Start at the federal level. State-specific innovations in North Carolina have included programs like Smart Start and More at Four.
In 1965, President Johnson created Head Start to foster the development of literacy skills (Head Start, 2017). Using a focus on the whole child model, children who attended the program received regular access to dental and medical care along with the program’s specific framework
to create a school-ready child. Eventually, the program developed a Home Start component that led to caretakers and employees being partners in the education of the enrolled child (Head Start, 2012). Throughout the years, Head Start added various programs such as Early Head Start and the federal Fatherhood Initiative (Head Start, 2017). In 2007, President Bush signed the Improving Head Start for School Readiness Act of 2007 to increase components of a child’s approaches to learning including an increase in literacy skills (Improving Head Start for School Readiness Act of 2007, 2007).
State initiatives have also targeted early literacy. Smart Start began in North Carolina in 1993 as a means for all children aged 0 to 5 to be school ready; unlike Head Start, no
Similar to the positive longitudinal results obtained by Smart Start through the Frank Porter Graham Child Development Institute’s research, More at Four also had positive effects on third-grade reading proficiency (Ladd, Muschkin, & Dodge, 2014). North Carolina’s More at Four Program targeted and served more than 49,000 at risk children between 2002 and 2006 (Peisner-Feinberg & Schaaf, 2007). Impact studies of More at Four resulted in a deeper
understanding of at-risk children remaining behind their peers at the end of the intervention year (Peisner-Feinberg & Schaaf, 2007).
The preceding studies suggest that, while programs such as the federal Head Start initiative, Smart Start, and More and Four have positively impacted pre-literacy skills,
inadequate early reading deficits persist. In addition to making these programs more effective in this dimension of service delivery, it is arguable that additional innovations are needed. An option through which low-income parents might alter the trajectory of their children’s reading achievement is to capitalize on creating word rich environments in their own homes (Hart & Risley, 1995; Gilkerson & Richards, 2009). Parents need to be trained on ways that will enable them to increase child-directed conversations. Such conversations with children from birth to age 3 impact the future success of the child (Hart & Risley, 1995). Within the text of policy
priorities, the Children’s Defense Fund (2016) organization contends that the cognitive outcomes of the first five years of a child’s life are foundational for future cognitive development in the child’s rapidly developing brain.
higher income, western region of the state (NCDPI, 2016a). A low-performing district has more than half of the schools in the district that are low performing. The northeast and north central regions contain three districts each that are low-performing; the other regions include one that contains two low-performing districts, and two with one low-performing district each. The remaining three regions have no low-performing districts (NCDPI, 2016b).
Measuring Word Interactions
There are varying language skills that should be measured to determine the progress of language in children. For example, Systematic Analysis of Language Transcripts (SALT) is technology that is used by speech and language pathologists to identify problems and deficits in the spoken language by technology codes a narrative from an audio tape or digital recording (Nittrouer, Caldwell, & Holloman, 2012). The SALT Program stores language samples of over 6,000 speakers (Miller & Iglesias, 2008). The database has become a beneficial clinical tool for professionals assisting children with speaking impairments (Heilmann, Miller, & Nockerts, 2010).
Starling is another word analysis technology. Starling’s website claims that it is the first wearable word counter. Using a plastic word counter the size of a pacifier, VersaMe’s Starling synchs with a mobile application to count adult words and suggest age-specific activities for the adult to do with the child (VersaMe, 2017). An example of an age-specific activity, listed on the Starling website, is for parents to place the Starling device on the child in the morning and to practice the names of the child’s body parts throughout the day, starting with the adult dressing the child, pointing to each body part, and saying the child’s body part as he/she wipes off the food on her/his face (VersaMe, 2017). As the parents continue throughout the day, they are able to log into the product’s online application and see immediate feedback regarding the number of
words their child has heard that day.
Creating a means for low-income parents to have real-time feedback on the number of words their children are hearing and with which they are interacting has been found to be a useful means of increasing pre-Kindergarten literacy skills (Gilkerson & Richards, 2009).
Researchers and developers contend that by employing language analysis technology, parents can play an integral part in closing the word gap (LENA Research Foundation, 2016b). The LENA and Starling tools and methodology were the focus of this study.
Purpose of the Study
word interaction deficits. Additionally, I assessed how willing parents were to change their daily interactions in order to read more and talk more with their child; this willingness to change was correlated with parental demographic characteristics. The study incorporated quasi-qualitative case-study elements to achieve some of these purposes.
The methodology for the study encompassed a mixed methods research design. The central constructs included parents’ perspectives about potential implementation of language environment analysis technology. The study also examined variables that impacted the interest of parents in implementation of the technology’s components. Such variables included race, socio-economic status, age, maternal education level, employment status, and number of children in the home.
The body of knowledge surrounding language analysis technology has evolved and is used in many fields. Language analysis technology has been used by researchers to understand the ways that cochlear implants allow deaf children to hear and experience language acquisition (Leffel, Suskind, & Suskind, 2013). Language analysis technology has also allowed researchers to study adult word count at a school containing children on the autism spectrum and correlate the number of words spoken by adults and teacher burnout (Irvin, Hume, Boyd, Mcbee, & Odom, 2013). Recently, language analysis technology has become available for at-home use as a way for parents to have meaningful feedback on how to improve their child’s access to hearing words (Suskind et al., 2015). As there is a gap in literature addressing using such technology in the home, the study may help to fill deficiencies in the past literature surrounding aspects of the language analysis technology that appeal to low-income parents.
child since they do not have quantifiable data to measure. By evaluating talk turns, parents have worked to create enriched word environments which provide cognitive increases across many aspects of a child’s development (LENA Research Foundation, 2016a). The study addressed dimensions of language analysis technology and determined which dimensions of the program parents believed would yield potential benefits to children. The study further examined archival data from preschool programs such as Head Start, Early Head Start, Smart Start, and More at Four programs. While examining archival data, I reviewed previous attempts to reduce pre-school word interaction deficits. A survey instrument containing a Likert-type scale examined the perspectives of parents of minority, at-risk low-income students. These participants were asked to reflect upon the potential benefits of the four major components of the language environment analysis program.
Research Questions
The study’s purpose addressed multiple constructs related to the perceptions of parents regarding the potential benefits of language analysis technology. In order to carry out the intent of the study, the following research questions were addressed:
1. What are the perceptions of parents of children, ages birth to three, who live in the attendance zone of Title 1 elementary schools in a northeastern North Carolina school district regarding the potential implementation of language environment analysis technology in their households?
a. Are the perceptions related to the different components of the language analysis technology?
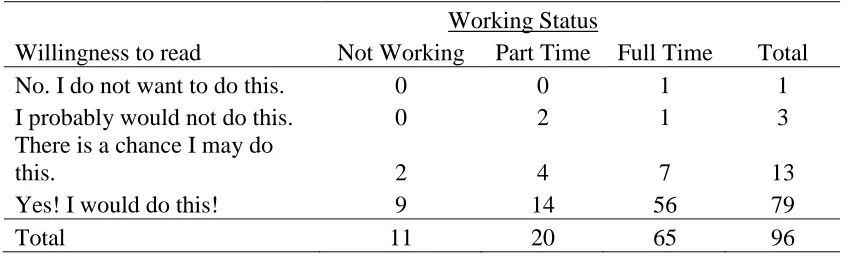
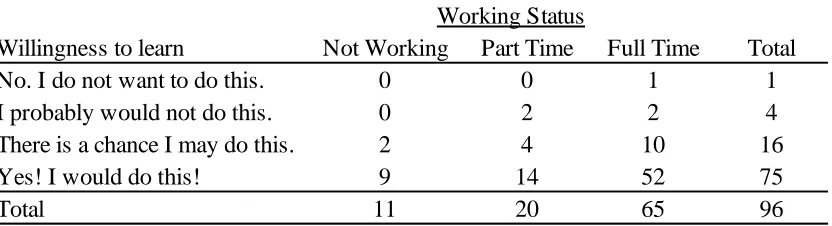
b. Are the perceptions of parents related to their working status (not employed, part-time, full-time)?
c. Are the perceptions related to the reported number of children?
d. Are the perceptions related to the reported level of household income? e. Are the perceptions related to the reported age of the parent?
f. Are the perceptions related to the reported education level of the parent? 2. To what extent are parents of children, ages birth to three, who live in the attendance
zone of Title 1 elementary schools in a northeastern North Carolina school district willing to change daily behaviors in order to improve literacy skills of their children?
a. Is this willingness related to their working status (not employed, part-time, full-time)?
d. Is this willingness related to the reported age of the parent?
e. Is this willingness related to the reported education level of the parent? Definition of Terms
The following terms are used throughout the chapters. Some are technical terms that are specific to either the technologies or variables that were the focus of the study. Some were specifically adapted for use in this study.
1. Application: A program or piece of technology designed and written to fulfill a particular purpose of the user (Merriam Webster Online Dictionary, n.d.) For
example, LENA and Starling are applications designed for use in verbal interactions. 2. Approximate yearly income: A family’s annual inflow of money within income
level ranges ($0 to $5,000, $6,000 to $15,000, $16,000 to $25,000, $26,000 to
$35,000, $30,000 to $45,000, $46,000 to $60,000, $61,000 to $75,000, over $75,000) 3. At-risk student: Student who is at risk for dropping out of school early due to low
educational attainment (Chen & Kaufman, 1997).
4. Child-directed speech: Baby talk; adult use of high pitched speech with accented facial expressions when communicating with young children (Weisleder & Fernald, 2013).
6. Early intervention: Providing assistance to at-risk children, birth to age three, as a means of preventing or lessening word gaps (High, LaGasse, Becker, Ahlgreen, & Gardner, 2000).
7. Education level: The highest level of school completed as defined by the following ranges: no formal schooling, less than 9th grade, some high school but no diploma, GED, high school diploma, vocational/technical program after high-school, some college but no degree, AA, BA, MA, graduate or professional degree
8. Emergent literacy: The knowledge that a child possesses about reading and writing before he/she knows how to read and write (Lonigan & Shanahan, 2009).
9. Growth: The degree to which schools exceeded, met, or did not meet cohort
achievement improvement expectations as defined and calculated in Education Value Added Assessment System (EVAAS) (NCDPI, 2016a).
10.Language analysis technology: Technology used to analyze use of words and talk turns (LENA Research Foundation, 2016a).
11.Language ENvironment Analysis (LENA): Proprietary hardware and technology package designed by the LENA Research Foundation to be used to share timely feedback with parents to increase number of words heard by child (LENA Research Foundation, 2016b).
12.Parent: A person primarily responsible for raising a child. In most instances, this is the mother and/or father, but may include another relative or appointed guardian. 13.Proficiency: Test rating that determines passing score; rating of 3, 4, 5 on
14.Receptive language: Ability to understand words and the meaning of what is said (Bryant et al., 2003)
15.School readiness: Skills, attitudes, and knowledge needed to enter Kindergarten successfully (Bayliss, 2015; Magnuson & Waldfogel, 2005)
16.Socioeconomic status (SES): Economic description used by the National School Lunch Program (NSLP) to determine lunch status based on the current level of income; students are eligible for free, reduced, or full price meals at school. The NSLP was founded after the National School Lunch Act was signed by President Truman (National School Lunch Program, 2017).
17.Starling: Wearable word counter with application that provides tracking and talk suggestions of when and what to talk with the child about (VersaMe, 2017a).
18.Talk turns: The conversation between a child and an adult; could be through the use of actual words or babbling (Hart & Risley, 1995; Suskind & Leffel, 2013)
19.Thirty Million Word Gap: The gap between words encountered by children in professional families and welfare families (Hart & Risley, 1995).
20.Whole child: Reference to creating a well-rounded citizen and placing emphasis on content area skills, as well as developing character traits such as empathy, creativity, and determination (Head Start, 2017; Viadero, 2000).
21.Word analysis technology: A technology tool designed for use of calculating the number of words spoken to a child. For example, LENA and Starling are word analysis technologies designed for use in verbal interactions.
Justification for the Study
The research was a direct result of the persistent debate over universal pre-K and the limited access to related funding for low-income communities. The debatable question for policymakers is not related to the effectiveness of universal pre-k, the question is whether it is financially possible (Kelleher, 2011; Reynolds, Temple, Robertson, & Mann, 2002). Programs such as Head Start and More at Four have addressed gaps in school readiness; however, gaps in school readiness continue to exist (Cannon & Karoly, 2007; Magnuson, Meyers, Ruhm, & Waldfogel, 2004; Magnuson & Waldfogel, 2005). The results can be used to provide
policymakers with research that discloses the interest in the use of language analysis technology in low-income households to better ensure the preparedness of preschool children.
A study of the perceived benefits and the perceived barriers to implementation of the language environment analysis tool may contribute to policy discussions around strategies for the elimination or narrowing of gaps in school readiness. The research may benefit practitioners as, depending upon the results, schools may choose to invest in pairing low performing pre-k
through third grade students and their parents with LENA tools. In addition, the benefits can also extend to parents and their children. There is potential value in parents being receptive to
language analysis technology as research has shown that toddlers who had increased access to child-directed speech were able to understand familiar words and comprehend novel words with greater ease (Weisleder & Fernald, 2013).
application, is limited. This study adds to the relevant body of knowledge regarding the creation of word rich home environments. The potential value of this study to future researchers is multi-fold. It allows for further examination of whether policymakers should invest in language analysis tools. Additionally, future researchers have a research protocol to guide inquiry into other language analysis tools and in other contexts.
Organization of the Study
The following chapters address the degree to which parents in low income eastern North Carolina communities perceive language analysis technology as potentially beneficial to their daily practices in child rearing. Chapter 2 includes a comprehensive literature review of language analysis technology as well as an understanding of the literacy gap and related programmatic responses over time. Literature related to the central research constructs was synthesized. Pertinent research and the contemporary policy context were discussed.
Chapter 3 details the research design and procedures. It discusses the quantitative and qualitative methods used in the process of evaluating parent’s interest in using language analysis technology. The research questions and related hypotheses are provided. The study participants and the procedures to recruit them and to safeguard their anonymity are outlined. The study consisted of a quasi-qualitative case-study design. Instruments and the statistical tools to analyze data derived from them are discussed.
Chapter Summary
According to Weisleder and Fernald (2013), speech that is addressed directly to the child yields an increase in the child’s acquisition of vocabulary. This research into the existing body of knowledge asserts that children need more than simply overhearing adult conversations in order to learn to speak capably. Children need to be intentionally spoken to in order to foster language-decoding skills (Weisleder & Fernald, 2013). Additional research identifies the home
environment as a catalyst for promoting language skills that are precursors to reading skills like comprehending narratives (Whitehurst & Lonigan, 1998).
Due to the cost of implementing high quality pre-k programs, there is a need for a feasible way in which to close the word gap. The developers of LENA technology contend that the tool allows parents of preschoolers to change the future of their children by intentionally teaching these parents how to create word rich environments in their own homes (LENA Research Foundation, 2016b). Parents need to be trained in behaviors that will enable them to increase child-directed conversations.
The research continues to suggest that child-directed language increases cognitive ability later in life; therefore, it is necessary that parents have opportunity be empowered with this information (Majorano, Rainieri, & Corsano, 2012; Wasik & Jacobi-Vessels, 2016). The use of the LENA tool acknowledges the need for accountability and support to aid parents in the development of their children’s brains. Through the use of language analysis technology,
researchers offer a potential solution to an ongoing problem; therefore, there was a need to study the degree to which parents of at-risk, low-income children are receptive to the major
CHAPTER 2: LITERATURE REVIEW Chapter Introduction
Chapter 2 provides a comprehensive review of the body of knowledge related to the study topic and purpose. In the following sections, I described and synthesized literature related to relevant background and contemporary public policies. The theoretical framework used to provide a foundation for the study is addressed. The study’s topic, research constructs, and research aims are explored within the context of pertinent research and expert perspectives from the field.
Previous studies articulate the pivotal role that parent interaction plays in a child’s school
readiness (Bayliss, 2015; Bornstein, Tamis-LeMonda, Hahn, & Haynes, 2008; High et al., 2000). Word analysis technology works to eliminate word gaps by educating parents about how to interact with their children to help them develop strong literacy skills (Foster-DeMers, 2012). It was therefore worthwhile for this study to examine parent perceptions of the potential benefits of interacting with word analysis technology.
Background for the Study
interaction in the home and to apply technology to this process. The section closes with a description of the policy context in which the study occurred.
Literacy Gaps and Related Programmatic Responses over Time
Given the importance of literacy to a child’s prospects, and given persistent problems
with literacy among children in poverty and children of color, federal and state initiatives have been implemented (Johnson & Lee, 2003; Miller, 1987; Peisner-Feinberg & Schaaf, 2007). The following sub-sections profile the three most prominent such programs in North Carolina over the past few decades.
Head Start. As the country anticipated desegregation in the 1960s, there were concerns about literacy gaps for African American and poor children. Education reformers attempted to alleviate pre-literacy deficits and engage parents in supporting the cognitive development of their children by creating Head Start programs. President Johnson was clear in his desire to use
education to end the cycle of poverty and in 1965, he announced the creation of Project Head Start (Miller, 1987). A major component of the literacy initiative was to encourage culturally responsive teaching. In its first summer in operation, 560,000 children throughout the United States participated in an eight-week programs in Head Start Child Development (Smith & Bissell, 1970). Using the whole child model, participants received in home assistance to the family to foster child’s development, nutrition assistance, and mental, dental and physical care. A year later, due to the success of the summer program, the Head Start program was funded for another year (Head Start, 2017).
additional policy manual, 70.2, The Parents, led to staff members threatening to leave Head Start programs because the policy mandated a structure to allow parents transparent access to the decision-making process. It was mandated that parents would assist in classrooms and interact with staff (Head Start Bureau, 1970). In 1973, the trend to encourage parents to have a greater emphasis in their child’s life occurred through the presence of Home Start, which allowed Head Start employees to provide services at the homes of children attending Head Start. The
employees assisted in the continued development of parent-child relationships and offered connections to resources in the community (Head Start, 2012).
Over a period of 20 years, Head Start was reauthorized numerous times and continued to receive additional funding and expand the scope of services in order to adapt to changing needs. Program enhancements included bilingual education, accommodations for students with
disabilities, introducing nutrition services, and salary improvements for employees. In 1994 - 1995, Congress reauthorized Head Start to include Early Head Start for women who were pregnant, infants, and toddlers (Head Start, 2017).
Celebrating its 30th anniversary in 1996, the federal Fatherhood Initiative caused Head Start to provide an intentional emphasis on including fathers into the mission (Head Start, 2017). According to technical reports from Head Start, fathers and father figures from families that were involved in Head Start were more likely to participate in Head Start related child development activities than control families (Love et al., 2002). The activities included picking the child up from Head Start, participating in home visits, parenting classes, and parent-child group activities (Love et. al, 2002).
government (Ripple, Gilliam, Chanana, & Zigler, 1999). Additionally, researchers began to question the positive long-term effects of Head Start (Currie & Thomas, 1995, 2000; Ludwig & Miller, 2007).
In 2007, 42 years after the program was founded, President Bush proposed, and Congress enacted, a law titled Improving Head Start for School Readiness Act of 2007 to “promote the school readiness of low-income children by enhancing their cognitive, social, and emotional development” (Improving Head Start for School Readiness Act of 2007, para 1). An intended outcome of Head Start was to grow several components of a child’s approaches to learning, including acquisition of literacy skills. Head Start has specific approaches to strengthening the pre-literacy skills of children including a mandatory requirement that every Head Start location enabled ongoing training in language and emergent literacy for teachers. Additionally, families were provided with literacy services and workshops (Head Start, 2017).
The Head Start Child Outcomes Framework was created to ensure that “at children, at a minimum, progress in language, literacy, mathematics, science, cognitive abilities, approaches to learning, social and emotional development, creative arts, physical development and the
acquisition of the English language” (Improving Head Start for School Readiness Act of 2007, 2007). Education reformers attempted to alleviate pre-literacy deficits and the word gap by creating Head Start programs, which currently serve 35% of low-income children at a cost of $7,600 per child (Manley, 2015). Despite only investing in pre-Kindergarten experiences for less than half of low-income children, the cost to taxpayers for Head Start is $8 billion annually (Manley, 2015).
children. They wanted to see the outcome if parents were offered financial incentives to attend parent academies to learn early childhood cognitive development skills. Nearly $1 million was distributed across 257 families (Fryer, Levitt, & List, 2015). The research demonstrated the power that parents possess to change the trajectory of proficiency levels in their children.
According to the study, “We searched for existing curricula that would teach parents to help their children with both cognitive skills (such as spelling and counting) as well as non-cognitive skills (such as memory and self- control)” (Fryer et al., 2015, p. 7). The data on the impact of increased parent involvement showed a statistically significant increase in non-cognitive scores, along with low levels of increase of cognitive scores. Related to the cost of Head Start, the program from Fryer, Levitt, and List cost approximately $3,600 per child participant; therefore, nearly double the number of children could be served for about the same outlay of money (Fryer et al., 2015; Manley, 2015).
Most recently, a study of Head Start found that the children of children who attended Head Start had a decreased likelihood in teen pregnancy and reduced participation in a crime. Additionally, the children of the children who attended Head Start had an increase in educational gains; specifically, the children were more likely to graduate from high school and go to college (Barr & Gibbs, 2017).
used as a significant supplement to the state of North Carolina’s $200 million annual
contribution (McNeil, 2008). The Smart Start initiative was started in 1993 as a means for all children aged 0 to 5 to be school ready. Unlike Head Start, the Smart Start program did not target families within the low-income range; children of all socioeconomic status were targeted to receive services (Bryant et al., 2003).
Throughout the years, the Frank Porter Graham Child Development Institute at the University of North Carolina at Chapel Hill has released numerous studies regarding the positive effects of Smart Start (Bryant et al., 2003; Maxwell et al., 1999; Taylor & Bryant, 2002). In a 2003 study surrounding child care quality, the researchers found that child care quality at Smart Start increased over the years since Smart Start was established. It also found a positive
correlation between classroom quality and children’s outcomes related to “receptive language, print awareness, book knowledge, applied math, and counting one-to-one” (Bryant et al., 2003, p. 12). In the evaluation, the number of high-quality classrooms had doubled since 1993; however, nearly 50% of all Smart Start facilities remained below the rating of “good” as measured by the researchers (Bryant et.al, 2003). Despite the Smart Start facilities receiving a good rating, a high percentage of North Carolina’s before-Kindergarten child care services remained below average in quality. These gaps created the need for More at Four to attempt to close learning gaps.
first five years in 2002-2006 (Peisner-Feinberg & Schaaf, 2007). The State’s More at Four program targeted at-risk children who were unable to participate in a pre-k program.
Peisner- Feinberg and Schaaf (2007) studied the impacts of the program at the five-year anniversary of More at Four. The study assessed children’s language and literacy skills,
including receptive language, rhyming, story concepts, letter naming. The children were
categorized into risk groups by More at Four’s eligibility guidelines, including groups defined by income as determined by free lunch status, limited English proficiency, identified disability, and chronic health condition. The data demonstrated a notable difference in the children in the lowest-risk group. This group of children made statistically significant gains compared to their peers on rhyming skills. The researchers concluded this area of phonological awareness may require higher cognitive abilities. Children sorted into the higher-risk group demonstrated greater gains than their peers in receptive language (Peisner-Feinberg & Schaaf, 2007). In each
subsection of areas of literacy, math, and general knowledge, the children at greater risk entering the More at Four program continued to be at the lower levels at the end of the year. For example, there were no significant differences noted among the cohorts of highest and lowest risk children from the tests in the fall; however, “the highest-risk group scored significantly lower than the other groups in the spring” (Peisner-Feinberg & Schaaf, 2007, p. 58).
Reading assessment data across the decades demonstrates the impact of poverty on achievement (Fernald, Marchman, & Weisleder, 2012; Hart & Risley, 1995; Kennedy, 1986; Rowe, Raudenbush, & Goldin-Meadow, 2012). A key focus of school-ready initiatives like Head Start, Smart Start, and More at Four has been to improve pre-literacy skills. Positive effects have been demonstrated throughout the years; however, gaps in literacy persist. Additional
The Role of Word Interaction and the Impact of Poverty on Word Interaction
Word interaction among very young children has become better understood as a factor that is associated with pre-literacy literacy development (Roberts, Jurgens, & Burchinal, 2005). In the 1970s, researchers Carey and Barlett studied how children acquire new words by the rate of exposure (Carey & Bartlettt, 1978). The study considered patterns as to how children learn a new, single word. The study was based on previous pilot studies of both the researchers to
produce a deeper understanding of how children learn a new word (without explicitly teaching it) and observing whether the presence of fast mapping, or learning a new idea after seeing it one time, occurred (Carey et al., 1978). In the study, children interacted with a new word with their teacher to allow the researchers to record how word interaction caused an understanding of the new word. According to the Linguistic Society of America, based on research from Neil Smith (1989), Jean Pecchi (1994), and Steven Pinker (1994), all children acquire language without direct instruction (Birner, n.d.). Children learn new words simply by interacting with words when adults talk with children. “Children who are never spoken to will not acquire language. And the language must be used for interaction with the child; for example, a child who regularly hears language on the TV or radio but nowhere else will not learn to talk” (Birner, n.d., p. 2).
In 1995, researchers Betty Hart and Todd Risley found what they asserted was one of the fundamental causes of gaps among children in reading proficiency. They concluded, based upon intensive research, that the number of words with which a child interacts varies greatly across income levels. They further concluded that the development of pre-literacy skills was related to a child’s interaction with words. Since children in poverty tend to have significantly less
peers (Hart & Risley, 1995). Despite having access to education, they posited, children in poverty are prevented from being as school-ready as they might otherwise be by the lack of developmentally appropriate word interaction. This research illustrates the importance of intentionally developing vocabulary in children growing up in low-income households.
Contemporary research through Stanford University further illustrates a vocabulary gap, discernible by socioeconomic status, (SES) in children as young as 18 months old. Furthermore, the researchers found that by age 2, there is an observable 6-month gap in critical thinking and vocabulary building skills among children born into varying socioeconomic strata (Fernald & Weisleder, 2013). Studies like this and that conducted previously by Hart and Risley (1995) provided compelling evidence that socioeconomic status is related to the level of word interaction and, hence, to language acquisition.
The role of cognitive neuroscience and learning a language is of great importance, as a child is cognitively predisposed to learn a language at a young age. Children are able to begin to build their vernacular at 30 months (Rowe et al., 2012). The brain has a distinct period of malleability and receptiveness to learning languages before a child reaches the age of 10 (Eliot, 2001). As children are exposed to new words and experiences, synapses continue to form bonds in their brains.
adolescence are lost if the brain connections are unused. This has implications for subsequent reading achievement.
Socioeconomic Status and Historic Patterns in Literacy Achievement
The National Assessment of Educational Progress (NAEP) is a key measure of
subsequent reading achievement. The assessment is conducted in grades 4, 8, 12 and determines achievement trends in reading and math among American students. NAEP reading and math tests are completed once every two years to assess rates of student proficiency (NCES, 2015a). In 2015, only one third of fourth- and eighth-grade students performed at or above the Proficient level in reading. In fact, North Carolina was one of three states to see a statistically significantly decrease from 2013 to 2015 in both grade 8 NAEP scores for math and reading (NCES, 2015b).
While the data disclose relatively low levels of proficiency for North Carolina, the data also demonstrate the correlation between poverty and proficiency. For 8th grade students who took NAEP and were eligible for the National School Lunch Program (NSLP) the average reading scale score was 253; students who took NAEP and were not eligible for the National School Lunch Program had an average reading scale score of 277. When reviewing the 4th grade reading scores, one notes that the scale score difference was more significant. Fourth grade students who participated in the NSLP had an average reading scale score of 209 on NAEP; on the other hand, 4th grade students who did not participate in the National School Lunch Program had an average reading scale score of 237 (NCES, 2016).
Trends in NAEP reading achievement data are mirrored in the results from North
and student achievement. School Performance Grades are represented by the 80/20 model. Eighty percent of the grade is a performance grade composite based on the school’s proficiency scores; 20% of the performance grade composite is calculated by a school’s growth according to the Educational Value Added Assessment System (EVAAS) (NCDPI, 2015).
EVAAS provides a growth measure that uses data from current and previous student testing results to measure if students are increasing growth throughout their years in school. Schools are given three possible ratings: exceeded expected growth, met expected growth, and did not meet expected growth (NCDPI, 2016a). According to DPI’s statistical summary report, in 2015, 27.5% of school exceeded growth, 46.1% of schools met expected growth, and 26.4% of schools did not meet expected growth (2016a). The designations for School Performance Grades in 2015 were a 15-point scale in which: A = 85–100, B = 70–84, C = 55–69, D = 40–54, F = 39 or Less (NCDPI, 2016a). Reading grades across North Carolina are correlated with School Performance Grades; schools with 50% or more students living in poverty were a D or F school (NCDPI, 2016a). There are 160 northeast North Carolina schools; 29.4% of these schools do not meet growth as established by EVAAS (NCDPI, 2016a).
North Central, includes a number of schools that are also low-performing. These ratings are juxtaposed with those in the state’s Western state education district, which contains no F schools; 42% of the schools have a grade of B in reading (NCDPI, 2016a).
The northeast state education district, as outlined by the North Carolina State Board of Education (2015), includes school systems in Beaufort, Bertie, Camden, Chowan, Currituck, Dare, Gates, Halifax, Hertford, Hyde, Martin, Northampton, Pasquotank, Perquimans, Pitt, Roanoke Rapids, Tyrrell, Washington, and Weldon. The North Central state education district includes the local school systems of Chapel Hill-Carrboro, Chatham, Durham, Edgecombe, Franklin, Granville, Harnett, Johnston, Lee, Nash, Orange, Person, Vance, Wake, Warren, and Wilson Counties. The Western state education district contains schools from the following districts: Asheville, Buncombe, Cherokee, Clay, Graham, Haywood, Henderson, Jackson, Macon, Madison, Polk, Rutherford, Swain, Transylvania (North Carolina State Board of Education, 2015).
A school is deemed as low-performing when it receives a School Performance Grade of 'D' or 'F' and a growth status of 'Met' or 'Not Met'. In 2015, there were 489 low performing schools in North Carolina (NCDPI, 2016a). More specifically, there were 109 of 544 schools (20%) in the North Central state education district that were low-performing. There were 57 of 171 schools (33%) in the Northeast state education district that were low-performing.
A school system is considered performing if over 50% of its schools are
performing school systems. Eighty-three percent of Northampton County’s schools are low-performing; this is the case with 80% of Washington County’s schools and 77.8% of Martin County’s schools (NCDPI, 2016b). In the state education district that neighbors the Northeast, the North Central’s 3 school systems also had districts with high percentages of low-performing
schools. Warren County had 62.5% low-performing schools, Nash-Rocky Mount had 58.3% of the schools as performing, and Wilson County had 54.2% of schools that were
low-performing (NCDPI, 2016b).
This interaction between socioeconomic status and literacy attainment seems to be
evident in third grade End of Grade (EOG) test scores in high-poverty schools across eastern
North Carolina (Burross, 2008). The EOG data disclose an observable distinction in the way in
which schools perform on third grade tests in low-income areas in comparison with schools in
higher income districts. The deficits in reading cause low-income elementary schools to offer
more transitional classrooms than are offered by elementary schools in higher income districts.
According to the NCDPI, “The 3/4 Transition and Fourth Grade Accelerated Classes are
intended to be classes where students receive the 4th grade standards and curriculum with an
intense focus on reading to move the student to proficiency in reading” (NCDPI, 2016, p. 7).
Contemporary Policy Context
Contemporary practices associated with the improvement of early literacy skills and reading achievement have evolved across multiple decades and multiple policy initiatives. The first of many laws surrounding educational opportunities for schools in low-income districts was signed into law by President Johnson in 1965. The Elementary and Secondary Education Act (ESEA) was a civil rights law that offered grant opportunities for low-income districts to improve public educational facilities by funding textbooks and library books, offering
scholarships for college students, and financial contributions towards special education centers (Gamson, McDermott, & Reed, 2015). Through subsequent reauthorizations of ESEA, including No Child Left Behind (NCLB) and the recently enacted Every Student Succeeds (ESSA),
intentional literacy and reading skills improvement aims were implemented. Fiscal support has been provided through resources such as Title I and grants such as Reading First, Early Reading First, and the William F. Goodling Even Start Family Literacy Programs (United States
Department of Education, 2017).
association with the Common Core, the standards continued to heavily influence their curricula (Ujifusa, 2016).
The Improving America's Schools Act of 1994 (IASA) reauthorized ESEA and included a focus on four key initiates: increased “1) high standards for all students; 2) teachers better
trained for teaching to high standards; 3) flexibility to stimulate local reform, coupled with accountability for results; and 4) close partnerships among families, communities, and schools” (United States, 1995, p. 3). The IASA revisions of ESEA also included more accountability for schoolwide Title 1 programs to overcome school deficits based on factors of poverty (United States, 1995). Initiatives to close literacy gaps by race and poverty have been implemented at the federal, state, and local levels. Such policies provide the relevant contextual backdrop in which the study will occur.
With respect to federal policy, mention has previously been made of the Elementary and Secondary Education Act. Among the most recent reauthorizations of ESEA, No Child Left Behind, which was enacted during the George W. Bush administration, created a requirement for universal proficiency in reading (Kim & Sunderman, 2005). The No Child Left Behind waiver process, undertaken by the Obama administration, maintained strong accountability provisions relative to reading proficiency. North Carolina has been operating under a No Child Left Behind waiver and will continue to do so until the accountability provisions of the newest iteration of ESEA, the Every Student Succeeds Act accountability, are approved.
fourth grade. Research has shown that “children who do not demonstrate grade level proficiency in grade three are four times less likely to graduate from high school” (Workman, 2014).
Across the United States, an expansion of high-stakes testing and related accountability systems has caused teachers to focus instruction more heavily on assessment content and item types; i.e., to teach towards the test. This practice is more pronounced in schools that serve students of color and economically disadvantaged students (Kesler, 2013; McNeil, 2000). In reaction to this trend of teaching toward state and federal tests, there are teachers who are changing their pedagogy to incorporate less test preparation and a greater focus on effective teaching practices and culturally relevant pedagogy (Powell, Cantrell, & Rightmyer, 2013). However, much of the student-centered teaching is replaced with test preparation due to the high stakes exams (Jones et al., 1999). High-stakes testing has also caused teachers and administrators to cheat by artificially augmenting student scores through erasures and corrections (McNeil, 2000). An example of the testing pressure prominent in schools is found in McNeil’s article, which includes an anecdote of a principal replacing a teacher’s lesson plans aligned with the
state curriculum with the current Texas Assessment of Academic Skills (TAAS) preparatory books (McNeil, 2000). The article further asserts that the pressure is more pronounced in schools that serve students of color and economically disadvantaged students. In 2015, eleven teachers in Atlanta were sentenced to prison after being found guilty of changing student answers on
North Carolina has invested relatively considerable resources into early childhood programming and K-2 initiatives. The initiatives include the previously discussed Head Start, Early Head Start, Smart Start, and More at Four programs. As noted previously, these programs have produced increases in early literacy. Pre-k experiences have been found to correlate to positive social and emotional benefits as well as gains in achievement for the country’s most vulnerable children (Neuman, 2007; Puma et. al., 2010). According to the January 2015 Mayor’s Report Card on Education for 33 cities around the United States, “the data show 94 percent of districts offer some level of pre-k services to students, and 52 percent deliver pre-k to all four-year-old students within district boundaries” (George W. Bush Insitute, 2015, p. 8).
In summary, historical developments, programmatic responses, and related research acknowledge the pivotal role of literacy in a child’s academic success, and the essential role of word interaction in creating literate children. Furthermore, the research connects circumstances in low-income households and patterns of suppressed reading achievement, which are
compounded through adolescence. Although there have been programmatic responses to support students in poverty, including Head Start, Smart Start, and More at Four, the achievement gap continues to persist in low-income areas. Contemporary accountability policies have augmented the importance of closing literacy gaps. Deficiencies in reading proficiency have profound implications for the nation’s economic well-being and civic health, for perceptions about schools and educators, and, most importantly, for the well-being of individual students.
Theoretical Framework