Transactions of the 17th International Conference on
Structural Mechanics in Reactor Technology (SMiRT 17) Prague, Czech Republic, August 17 –22, 2003
Paper # H03-4
The Influence of Vertical Input on the Horizontal Restoring Force
Characteristics of Shear Wall
Hideo Ono1), Koichi Maekawa2), Yoshio Kitada3) and Shiro Mitsugi1)
1) Taisei Corporation, Japan 2) The University of Tokyo, Japan
3) Nuclear Power Engineering Corporation, Seismic Engineering Center, Japan
ABSTRACT
This paper describes the test and the simulation analysis results of the simultaneous horizontal and vertical loading tests on RC box shear wall specimens, performed as a part of the project entitled “Model Tests of Multi-Axis Loading on RC Shear Walls” [1]. In the test, varying vertical load was applied to two box shear wall specimens during cyclic loading in a horizontal direction. Through this test, we confirmed that the variation of the axial load affected the horizontal restoring force characteristics.
The simulation analysis was carried out using a computer program of elasto-plastic FEM with concrete constitutive laws. The merit of this FEM program is in the installation of four way multi-directional active crack model [2] [3]. The purpose of the analysis was to confirm whether or not the program could estimate the effect of the axial load variation. The analytical results considerably well agreed with the test results.
In order to confirm whether or not the above effect can stand under the dynamic loading condition, we have carried out a dynamic inelastic analysis of box shear wall model using the computer program by applying vertical motion together with horizontal motion. With the purpose of evaluating the effect of vertical motion to the horizontal restoring force characteristics, the same dynamic inelastic analysis was also carried out without vertical motion. KEY WORDS:shear wall, multi-axis loading, model test, vertical input, restoring force characteristics
INTRODUCTION
In the current seismic design of nuclear power plant (NPP) buildings in Japan, seismic design loads in horizontal two directions are obtained independently and the load in the vertical direction is evaluated statically, whereas actual seismic forces simultaneously jolt the buildings in the three directions. Therefore in order to evaluate the seismic margin properly, it is important to grasp the seismic response characteristics of an NPP building for three-dimensional earthquake excitation up to the ultimate state. Nuclear Power Engineering Corporation (NUPEC), Japan, has been conducting a project entitled “Model Tests of Multi-Axis Loading on RC Shear Walls” to clarify the elasto-plastic characteristics of the RC seismic shear wall, and to study a method of evaluating restoring force characteristics under multi-directional seismic loading conditions. The objective of this part of the study is to evaluate the influence of vertical input on the horizontal restoring force characteristics of shear wall by the model tests and the simulation analysis.
STATIC TEST LOADED SIMULTANEOUSLY IN THE HORIZONTAL AND VERTICAL DIRECTIONS
Description of the test
400
1000
500
750 750
750
750
1
350
1350
φ900
75
1350 1350
Top Slab Wall Base Slab Fig. 1 Specimen The static loading tests are conducted using two RC box specimens consisting of four
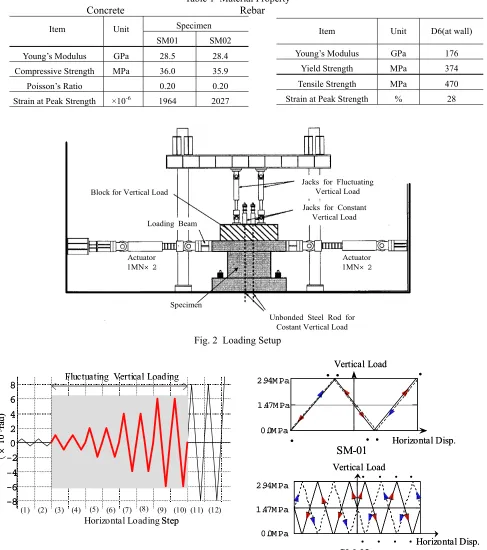
face shear walls with stiff top and base slabs. The specimens have the same configurations and dimensions with those used in the horizontal loading test [1] performed as a part of the project, "Model Test of Multi-Axis Loading on RC Shear Walls." Figure 1 shows a drawing of the specimen. The wall has a thickness of 75mm and the approximate reinforcement ratio of 1.2%. Table 1 shows the property of the concrete and the rebar used.
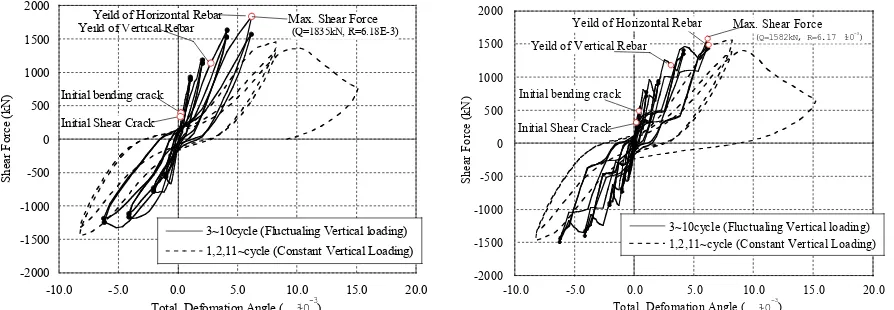
These specimens are loaded horizontally with reverse cyclic pattern to the top slab while varying vertical load is applied. The vertical load is varied in the range of ±1g (gravity force) from the ordinal axial stress of 1.47 MPa to a typical shear wall in NPP buildings.
Figure 2 shows the loading setup for the test. Two jacks give varying vertical load to the specimen, while the other four jacks keep the constant vertical load of 1.47 MPa.
loading. On the other hand the specimen “SM02” is given eight cycles of vertical loading during a cycle of horizontal loading. The vertical load is not changed in the cycles where the total deformation angle is larger than 6×10⁻³.
Table 1 Material Property Concrete Rebar
Specimen
Item Unit
SM01 SM02
Young’s Modulus GPa 28.5 28.4
Compressive Strength MPa 36.0 35.9
Poisson’s Ratio 0.20 0.20
Strain at Peak Strength ×10-6 1964 2027
Item Unit D6(at wall)
Young’s Modulus GPa 176
Yield Strength MPa 374
Tensile Strength MPa 470
Strain at Peak Strength % 28
Specimen
Jacks for Fluctuating Vertical Load
Jacks for Constant Vertical Load Block for Vertical Load
Loading Beam
Actuator 1MN× 2
Actuator 1MN× 2
Unbonded Steel Rod for Costant Vertical Load
Fig. 2 Loading Setup
SM-01
Vertical Load2.94M Pa
1.47M Pa
0.0M Pa
• • • Horizontal Disp.
• • •
SM-01
Vertical Load2.94M Pa
1.47M Pa
0.0M Pa
• • • Horizontal Disp.
• • • -8 -6 -4 -2 0 2 4 6 8 D ef or m at io n A ngl e ( × 10 -3ra d)
(1) (2) (3) (4) (5) (6) (7) (8) (9) (10) (11) (12) Horizontal Loading Step
Fluctuating Vertical Loading
-8 -6 -4 -2 0 2 4 6 8 -8 -6 -4 -2 0 2 4 6 8 D ef or m at io n A ngl e ( × 10 -3ra d)
(1) (2) (3) (4) (5) (6) (7) (8) (9) (10) (11) (12) Horizontal Loading Step
Fluctuating Vertical Loading
SM-02
2.94M Pa
1.47M Pa
0.0M Pa
Horizontal Disp. Vertical Load • • • • • • • •
SM-02
2.94M Pa
1.47M Pa
0.0M Pa
Horizontal Disp. Vertical Load • • • • • • • •
Fig. 3 Loading Patterns
Test Results
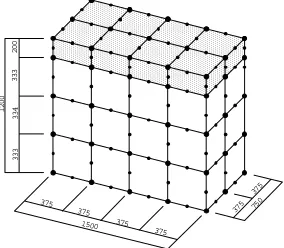
The relationships between shear force and total deformation angle of the specimens SM01 and SM02 are shown respectively in Fig. 4. In order to make the relationship clear, the cycle of the total deformation angle of 6×10⁻³ (the
cycle of the maximum force) is extracted from Fig. 4 and shown in Fig. 5. In each case of SM01 and SM02, the shear force increases when the vertical force increases; it decreases when the vertical force decreases.
skeleton curve calculated using the equation described in the Japanese technical guidelines for seismic design (JEAG) of NPPs [4]. The value of compression stress of 0 MPa, 1.47 MPa, or 2.94 MPa is substituted in the equation for each of varying vertical loads of –1g, 0g, and +1g respectively. The relationship of the shear force and total deformation angle of the test results is almost equal to the calculated result with the JEAG equation where the vertical load is kept constant at any of the three values. Thus it is confirmed that the relationship between horizontal shear force and displacement under varying axial force is estimated by substituting a constant axial force, equal to the varying force at the moment, to the JEAG equation.
-2000 -1500 -1000 -500 0 500 1000 1500 2000
-10.0 -5.0 0.0 5.0 10.0 15.0 20.0
3~10cycle (Fluctualing Vertical loading) 1,2,11~cycle (Constant Vertical Loading)
Sh ea r F or ce ( kN )
Total Defomation Angle ( ~10-3)
Initial bending crack
Initial Shear Crack
Yeild of Vertical RebarYeild of Horizontal Rebar Max. Shear Force(Q=1835kN, R=6.18E-3)
-2000 -1500 -1000 -500 0 500 1000 1500 2000
-10.0 -5.0 0.0 5.0 10.0 15.0 20.0
3~10cycle (Fluctualing Vertical loading) 1,2,11~cycle (Constant Vertical Loading)
Sh ear F or ce ( kN )
Total Defomation Angle ( ~10-3) Initial Shear Crack
Initial bending crack
Yeild of Vertical Rebar (Q=1582kN, R=6.17~10 -3
)
Max. Shear Force Yeild of Horizontal Rebar
Fig. 4 Test Results (Relationship between Shear Force and Total Deformation Angle)
●:
σ
=2.94MPa ○:σ
=1.47MPa ▲:σ
=0MPa‚ q i ~10-3 j
-2000 -1000 0 1000 2000
-6 -3 0 3 6
S hear F or ce (k N ) SM01 9-cycle
‚ q i ~10-3 j -2000
-1000 0 1000 2000
-6 -3 0 3 6
SM02 9-cycle S hear F or ce (k N )
‚ q i ~10-3 j -2000
-1000 0 1000 2000
-6 -3 0 3 6
SM01 10-cycle S hear F or ce (k N )
‚ q i ~10-3 j -2000
-1000 0 1000 2000
-6 -3 0 3 6
SM02 10-cycle Sh ear F or ce (k N)
Initial Loop Secondary Loop
Fig. 5 Test Results (Shear Force - Total Deformation Angle, total deformation angle range of 6×10⁻³)
-2000 -1000 0 1000 2000
-10.0 -5.0 0.0 5.0 10.0
SM-01
EXP. iƒ Ð=2.94MPa j
EXP. iƒ Ð=1.47MPa j
EXP. iƒ Ð=0.00MPa j
JEAG Eq.(ƒ Ð=2.94 MPa)
JEAG Eq.(ƒ Ð=1.47 MPa)
JEAG Eq.(ƒ Ð=0.0 MPa)
Sh ea r fo rc e (k N)
Horizontal Deformation Angle ( ~10 -3)
-2000 -1000 0 1000 2000
-10.0 -5.0 0.0 5.0 10.0
SM-02
EXP. iƒ Ð=2.94MPa j
EXP. iƒ Ð=1.47MPa j
EXP. iƒ Ð=0.00MPa j
JEAG Eq.(ƒ Ð=2.94 MPa)
JEAG Eq.(ƒ Ð=1.47 MPa)
JEAG Eq.(ƒ Ð=0.0 MPa)
Sh ea r F orc e (k N )
Horizontal Deformation Angle ( ~10 -3
)
Fig. 6 Comparison of Test Results and JEAG skeleton curves calculated with constant axial force
ANALYTICAL STUDY ON THE HORIZONTAL AND VERTICAL SIMULTANEOUS LOADING TEST
modeled with layered shell elements, and a half of the specimen is modeled because of its symmetrical characteristics. Deformation for the horizontal loading is given to the center of the top slab, which is colored in gray in Fig. 7, and vertical load is distributed uniformly on the top slab.
Figure 8 shows the relationship between shear force and deformation angle, where the test results (solid line) and analytical result (doted line) are both plotted. The analytical results agree well with the test results. The results show that the program can accurately simulate non-linear characteristics of shear wall when varying horizontal and vertical loads are applied simultaneously.
750 375
375
1500 375
375 375
375
3
3
3
3
3
4
3
3
3
2
0
0
1
2
0
0
The relationship between the vertical displacement at the top center of the specimen and the total deformation angle in horizontal direction is shown in Fig. 9, where test and analytical results are compared with each other. Both in the test and analysis, as the deformation angle in horizontal direction increases, vertical deformation increases. When it experiences loading history where the horizontal total deformation angle is larger than 5×10⁻³,
vertical residual deformation (vertical deformation at total deformation
angle of zero) increases drastically. Fig.7 Analytical Model
-2000 -1000 0 1000 2000
-12 -9 -6 -3 0 3 6 9 12 15 18 R ( ~10-3)
Q (kN
EXP. ANA.
-2000 -1000 0 1000 2000
-12 -9 -6 -3 0 3 6 9 12 15 18 R ( ~10-3)
Q (kN
EXP. ANA.
SM01 SM02
Fig. 8 Comparison between Test and Analytical Results (Shear force – Total Deformation Angle Relation)
-1.0 0.0 1.0 2.0 3.0 4.0
-10 -5 0 5 10
R ( ~10-3
)
ƒÂv (m
m
EXP. ANA.
-1.0 0.0 1.0 2.0 3.0 4.0
-10 -5 0 5 10
R ( ~10-3)
ƒÂv (m
m
EXP.
ANA.
ƒ Âv
R
SM01 SM02
Fig. 9 Comparison between Test and Analytical Results (Vertical Displacement vs. Total deformation angle)
ANALYTICAL STUDY ON THE EFFECTS OF VERTICAL MOTION ON DYNAMIC NON-LINEAR RESPONSE BEHAVIOR IN THE HORIZONTAL DIRECTION
Input motions
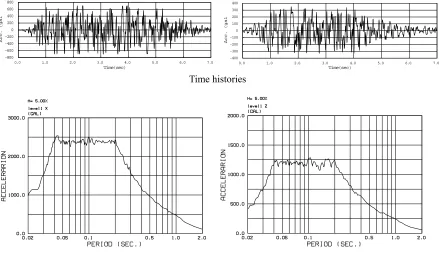
A couple of the artificial earthquake motions used for "Shaking Table Test" in the project of "Multi-axis Loading Tests on RC Shear Walls" is used for the input motions, which are generated according to the following conditions:
• Horizontal and vertical motions are generated by fitting the same target response spectrum. • The maximum amplitude of the vertical motion is half as large as that of the horizontal motion,
• Independent uniform random number sets are used for phase angles of each wave of both horizontal and
vertical input motions.
• The maximum accelerations of horizontal and vertical motions are not generated at the same time. • The duration of the motions are seven seconds.
Figure 10 shows spectra and acceleration time histories of the generated motions.
-800 -600 -400 -200 0 200 400 600 800
0.0 1.0 2.0 3.0 4.0 5.0 6.0 7.0
Time(sec)
Acc. (ga
l
-400 -300 -200 -100 0 100 200 300 400
0.0 1.0 2.0 3.0 4.0 5.0 6.0 7.0
Time(sec)
Acc. (ga
l
Time histories
Response Spectra
Horizontal input Vertical input
Fig. 10 The spectra and time histories of the input motions (level 1)
Models and cases of analysis
The analysis model is an RC box shear wall, which has the same configuration, material properties, and rebar ratio with the specimen described in section 2, the specimen of the horizontal and vertical simultaneous loading test. The model size is, however, four times as large as the specimen to put the natural period on the peak period region of the spectrum of the input motion. The weight of the top slab is set to make the vertical stress of the wall 1.47 MPa, which is same with that of the static test in the section 2. Total of four cases of analyses are carried out, consisted of the combinations of two levels of input motion and the presence of vertical motions as shown in Table 2.
The magnitude of the input motion of level 2 is determined so as to reach the maximum load carrying capacity of the shear wall, and that of level 1 is determined so as to reach the half of the deformation of the level 2.
Dimensions of the RC shear wall used for the analyses are shown in Fig. 11, and a drawing of the analytical model is shown in Fig. 12.
Table 2 Analysis parameters
Cases Horizontal input Vertical input
With vertical input 700gal 350gal
level 1
Without vertical input 700gal N/A
With vertical input 1100gal 550gal
level 2
Analytical results
800
15 00 2400 2400
2400
1500 150 0
1500 150 0
10800 5400
1500
1332
1332
13
36
4800
Fig. 11 Shear wall for the analysis Fig. 12 Analysis model
(1) Eigenvalue analysis
Table 3 shows the primary natural period of the RC box shear wall model. It is empirically expected that the stiffness at the maximum shear force decreases to about one fifth and the natural period increases to 2.2 times. Thus, according to the response spectrum of the input motion and the natural period of the specimen under the maximum shear force, the response of the specimen is expected to remain in the plateau of the response spectrum.
Table 3 Eigen frequency (natural period) of the primary mode
Horizontal Vertical
12.8 Hz )
28.3 Hz )
(0.078 sec (0.035 sec
(2) Response analysis results
Figure 13 shows time histories of input motion and acceleration response at the center of the top of the wall for the level 2 cases with the vertical input motion. As can be seen in the figure, the amplification ratio of the vertical response to the vertical input motion is larger than that of the horizontal response to the horizontal input motion.
Figure 14 shows the comparison of acceleration time histories at the top of the specimen for the cases with and without vertical input motion. The horizontal response with the vertical input motion does not have conspicuous difference from that without the vertical input motion. Therefore we cannot say that the vertical response with the vertical input motion is larger than that without the vertical input motion, although the vertical input motion makes the response slightly different from the response without vertical motion.
Figure 15 shows Fourier spectra of acceleration response of each case. The Fourier spectra are calculated to study why the amplification ratio of the vertical response to the input motion is large and furthermore why the large amplification occurs without vertical input motion. In Fig. 15, it is found that the vertical response has peaks at double and fourfold frequency points of the horizontal peaks regardless of the presence of vertical input motion. It is therefore inferred that the horizontal response generates the peaks in the vertical response.
-3000 -2000 -1000 0 1000 2000 3000
0 1 2 3 4 5 6 7
Time (sec)
X-Acc.(cm/s/
Response - X input - X
-3000 -2000 -1000 0 1000 2000 3000
0 1 2 3 4 5 6 7
Time (sec)
Z-Acc.(cm/s/
Response - Z input - Z
Fig. 13 Time histories of input motion and response acceleration (level 2 with vertical input motion)
-3000 -2000 -1000 0 1000 2000 3000
0 1 2 3 4 5 6
Time (sec)
X-Acc.(cm/s/
7 with vertical input without vertical input
-3000 -2000 -1000 0 1000 2000 3000 4000
0 1 2 3 4 5 6 7
Time (sec)
Z-Acc.(cm/s/
with vertical input without vertical input
with vertical input motion without vertical input motion horizontal direction
with vertical input motion without vertical input motion vertical direction
Fig. 15 Fourier Spectrum of Acceleration Response at the center on the top of the wall
CONCLUSIONS
(1) The relationship of horizontal shear force and displacement under varying axial force is similar to that with constant axial force with which the varying axial force is replaced, and the influence of damage caused by varying axial force is relatively small in case the varying range is less than ±1g (gravity force).
(2) The non-linear FEM analysis with the computer program employing the four way multi-directional active crack model can simulate non-linear behavior of an RC shear wall when varying forces are applied simultaneously in the horizontal and vertical directions.
(3) The vertical response of an RC shear wall under simultaneous dynamic loading in the horizontal and vertical directions is, within the conditions of the study, mainly dependent on the horizontal response and not much on the excitation by vertical input motion. Thus vertical input motion has only slight effect on the hysteresis characteristics in the horizontal direction.
ACKNOWLEDGMENTS
This work was performed by NUPEC as a part of the "Model Test of Multi-axis Loading on RC Shear Walls" project commissioned by the Ministry of Economy, Trade and Industry (METI) of Japan. Technical issues have been discussed in the advisory committee on the project established by NUPEC (Chairperson: Professor Dr. Nishikawa). The authors wish to express their thanks to all the members of the committee for their valuable suggestions and cooperation.
REFERENCES
1. Terazaki, H., Kitada, Y., Nishikawa, T., Takiguchi, K., Watanabe, H., and Korenaga, T., “Multi-Axis Loading Test on RC Shear Walls, Overview and Outline of Two Directional Horizontal Loading Test”, Transaction of SMiRT 16, Division H, #1274, Washington DC, August 2001
2. Fukuura, N. and Maekawa, K. “Multi-directional fixed crack model of reinforced concrete under cyclic stresses, Computational Modeling of Concrete Structures”, EURO-C, pp. 143-152, 1998
3. Maekawa, K., Pimanmas, A. and Okamura, H., Nonlinear Mechanics of Reinforced Concrete, SPON Press, 2003. 4. Japan Electric Association, Technical Guidelines for Aseismic Design of Nuclear Power Plants, JEAG4601-1991
Supplement, 1991