An evaluation
ground cover
L. HOFMANN AND R.E. RIES
of sample adequacy for point analysis of
Abstract
A sample adequacy equation is recommended to calculate the number of point frame samples required for measuring cover on reclaimed land and to assure sample size is adequate to meet Federal rules and regulations. When applied to field data, mining companies and regulatory agencies often find the sample number requirements estimated by the equation are so large that the equa- tion is impractical to use. This equation was studied by sampling with 20,40,60, and 100 sets of lo-point frames on 12 X 67-m areas of grazed and ungrazed mixed prairie at Mandan, N.D., and by examining cover data collected with 60 sets of frames from 1.86ha pastures on reclaimed mined land and native range near Center, N.D. Increasing the number of frames used did not produce more consistent mean values nor did variance decrease. Both total ground cover and bare soil ground cover measure the amount of cover protecting the soil from soil loss; yet, the formula estimated that 1 frame was required to measure total cover whereas 10,086 frames were required to measure bare soil within 10% of the mean with 90% statistical confidence. Histograms suggest cover compo- nents that comprise a small percentage of the total ground area are distributed in a Poisson rather than normal fashion; therefore, the equation does not provide a good guide for determining how many samples are required. Another equation, appropriate for binomial and Poisson variates is suggested as a solution to the problem. Key Words: sample size, formula, reclaimed mined land, native prairie, data transformation, proportion or percentage data
The point quadrat method (Levy and Madden 1933) has been extensively used to determine canopy or basal ground cover of native or introduced vegetation in northern Great Plains grass- land. Point analysis also is recommended for measuring cover on reclaimed surface-mined land to assess successful revegetation. Federal rules and regulations (Federal Register Vol. 44, No. 50, I3 March 1979) set statistical requirements for revegetation of surface-mined land as follows: “the ground cover and productivity of the revegetated area shall be considered equal if they are at least 90% of the ground cover and productivity of the reference area with 9% statistical confidence”. The equation
t*s* n=_
d*
(1)
where n q number of samples required, t = t-distribution value for a given level of confidence, sr q the estimate of the variance from sampling, and d = level of accuracy desired for the estimate of the mean, has been suggested by Bonham (1982), Chambers and Brown (1983), and others to calculate how many samples must be taken to meet federal requirements. Equation (I) is based on the assumption that the data are normally distributed.
When mining companies applied equation (1) to point frame data, the calculated number of frames required was often impracti- cal to attain because numbers were so large. The large sample
Authors are research agronomist and range scientist, USDA-ARS, Northern Great Plains Research.Laboratory, P.O. Box 459, Mandan, ND 58554.
The authors thank G.V. Richardson, M. Biondini, and the anonymous reviewers for their constructive comments.
Manuscript accepted 17 April 1990.
requirement also became a concern for regulatory agencies that were attempting to develop guidelines to meet the law.
Sowards (1983) reviewed some of the difficulties mining com- panies had with using the adequacy formula for determining sam- pling size required to estimate vegetation production. He offered an alternate nonstatistical approach of graphing the running con- secutive means as a function of sample size to evaluate sample adequacy.
Earlier studies have been conducted to determine the number of points required to adequately sample perennial grass cover. Levy (1933) suggested that 100 points were sufficient for charting domi- nants within a pasture sward, but 400 to 500 points were required to chart lesser species. Drew (1944) compared readings of 10,20, and 30 needles in 0.5-m quadrats and reported estimates of total hits from 10 needles were similar to estimates from 30 needles. Cracker and Tiver (1948) reported reliable vegetation analysis for survey work was obtained by taking 300 to 500 points per field or pasture ranging in size from 5.7 to 60.7 ha.
Whitman and Siggeirsson (1954) compared line intercept, all- contact points, and basal-contact points for analyzing mixed-grass rangeland vegetation in western North Dakota. They calculated the numbers of observations required to produce sampling errors of 5% and 10% of the means using the equation
N= S*
(Sx)*
where S q standard deviation derived from the plot data and Sx = 5% and 10% of the mean density of a species or group. They suggested a minimum working basis of 23 line transects, 1,400 all-contacts points, or 3,600 basal-contact points would be required for survey work in the type and density of vegetation they sampled. The purpose of this study was to determine how the number of point frame samples affects the estimated mean and variance of ground cover components and to examine how sample size esti- mates calculated by the equation (1) change as sample size changes.
Methods
Point frame data were obtained from 2 areas: native mixed- prairie pasture near Mandan, N.D., during August, 1986, and from reclaimed mined land and native pasture near Center, N.D., (Hof- mann and Ries 1989) during May, 1985. Cover was estimated using a standard frame with 10 pins spaced approximately 5.0 cm apart. The frame was held vertical, pin contact with above-ground vege- tation was ignored, and soil surface contacts (basal hits) were counted.
At Mandan, live and litter basal ground cover, and bare ground from 12 X 67 m plots were repeatedly sampled using 20,40,60, and
Reclaimed-land vegetation consisted primarily of smooth brome- grass (Bromus inermis Leyss.), crested wheatgrass [Agropyron desertorum (Fisch. ex. Link) Schultes], intermediate wheatgrass [ZEnopyrum intermedium (Host) Barkworth & D.R. Dewey subsp.], and alfalfa (Medicago sativu L.). Adjacent native species were similar to those at the Mandan site. Five frames were read at random within 6 general locations across the 1.86-ha grazed area of 2 replicated reclaimed and native pastures for a total of 60 frames.
The equation
fi= W
(2) (5 * .10)2
where X q the sample average was used to calculate the number of frames required to adequately sample basal cover within 10% of the population mean at the 90% confidence level required by Federal regulations. One-tailed t values were used. Cover means were obtained by multiplying pin contacts by 10 to provide cover values that total 100. Means, variance, and numbers of point frame samples required are reported for litter, live, total (litter + live), and bare (100 -total) cover for all areas. Individual major species were estimated from the reclaimed and adjacent native pasture. Histo- grams of the sampling distributions for each of the various cover
measurements were plotted using SAS/ GRAPH procedures (SAS 1985) to visually assess normality.
A square root transformation, generally used to normalize a Poisson distribution, also was conducted on each observation (Li 1964). Two additional transformations, the square root of each observation plus one half (Steel and Torrie 1980) and square root of each observation plus 1 (Snedecor 1956), were performed because of the large numbers of 0 and small counts for bare ground and individual species cover.
Sample size estimates were also obtained from our sampling data using the equation,
fi= t* Pq (3)
(d)*
where p = cover percentage, q = 100-p, and d = absolute error = 1%.
Results and Discussion
The sampling at Mandan was, by design, restricted to 4 cover components that are important for determining the adequacy of cover to protect the soil resource (Hofmann et al. 1983). The numbers of frames used to sample the 12 X 67-m plots represent
Table 1. Mean and variance of ground cover and estimated size of point frame samples required, based on 20,40,60, and 100 frames from mixed prairie.
Cover
Number of
samples Mean Var Equation 2’
Estimated size of samples Transformation
*- -5) WI Equation 33
Live Live Live Live
Litter Litter Litter Litter
Total Total Total Total
Bare Bare. Bare Bare
Live Live Live Live
Litter Litter Litter Litter
Total Total Total Total
Bare Bare Bare Bare
20 24.0 I41 44 I9
40 28.5 208 44 I6
60 27.3 179 41 I6
100 26.2 173 42 16
20 71.5 I50 6 2
40 68.8 257 10 3
60 70.3 210 8 2
100 72.0 190 7 2
20 95.5 100 2 1
40 97.2 56 2 I
60 97.7 32 1 I
100 98.2 31 I 1
20 4.5 100 869 627
40 2.8 56 1267 910
60 2.3 32 981 803
100 1.8 31 1594 1207
---___~~~~~~~_~_____~~~~~~~-~~~~~~-- ---Nongrazed----
20 20.0 I26 56 40
40 16.5 I52 95 55
60 14.0 89 77 48
100 17.7 I67 89 51
20 78.5 203 6 2
40 83.0 I60 4 2
60 85.8 89 3 1
100 80.7 180 5 2
20 98.5 45 I 1
40 99.5 5 I I
60 99.8 2 1 I
100 98.4 24 I I
20 1.5 45 3528 3528
40 .5 5 3313 3313
60 .2 2 10086 10086
100 I.6 24 1538 1293
16 15 14 14
196 183 149 156
228 77 33 147
15
14 ::
I3 34
13 33
2 36
3 37
2 36
2 34
1 8
1 5
1 4
1 3
131 8
111 5
89 4
88 3
---________
25 29
33 24
28 21
32 25
2 30
2 24
1 21
2 26
1 3
1 I
1 1
1 3
122 3
36 I
14 I
81 3
‘Estimated by ii=tW/(i l .10)2 2Y is the value of one observation. 3Estimated by 8-P w/(10)2.
Table 2. Mean and variance of ground cover and estimated size of point frame samples required, be& on 60 frames from grazed reclaimed and native pasture.
Cover Mean Var Equation 2’
Estimated size of samples
Transformation
G+-- -5) _) Equation 33
Live Litter Total Bare Other Brome Alfalfa Crested Intermediate
Live Litter Total Bare Other Needlegrass Bluegrama Carex
____________________________________~~~R~~~aimed______~~~~~-~~-~~~_____________________
15.7 163 113 55 39 34 23
77.7 300 9 3 3 3 30
93.4 226 5 2 2 2 11
6.6 226 855 562 215 153 II
1.2 14 1713 1575 125 2
10.2 127 207 141 81 16
3.0 32 589 529 133 83 5
0.5 8 5528 5109 88 42 1
0.8 11 2701 2462 113 56 2
~~~~~~_~_~_______________~_~~_~~~~~~~~~~Nat~v~---~~~~~~____~______
29.2 187 38 12 11 11 35
67.7 249 10 3 3 3 37
96.9 69 2 1 1 1 6
3.1 69 1165 772 180 113 6
16.0 191 126 75 52 44 23
4.8 66 476 369 133 92 8
3.0 69 1286 951 197 121 5
5.3 49 290 251 102 72 9
‘Estimated by SW/(; * .lO)*. 2Y is the value of one observation. JEstimated by St* pq/(lO)z.
very concentrated sampling.
Industry and regulatory agencies often are interested in addi- tional components of reclaimed mined land cover such as species composition. The samples from reclaimed mined land provided cover measurements typical of those taken to assess the adequacy of reclamation on mined land. These components usually have smaller means than live, litter, or total cover and equation (2) estimates a large sample size.
change in sample size (Table 1). Sowards (1983), using data ana- lyzed from Trapper mine, also reported mean and variance did not change dramatically as sample size was increased beyond a certain number.
Using equation (2), the estimated number of samples required to adequately measure live, litter, total, and bare ground cover on small plots of mixed prairie, ranged from 1 frame (10 points) to over 10,000 frames (100,000 points) for various cover estimates using federal statistical requirements (Table 1). Total cover required fewest frames, only 1 to 2. Litter cover required 2 to 10 and live cover 41 to 95. Sampling to estimate percent bare soil required reading large numbers of frames with estimates ranging from 869 to 10,086 frames.
The number of frames required to adequately measure live, litter, total, and bare cover on reclaimed land ranged from 5 to 855 frames and from 2 to 1,165 frames on adjacent native pasture based on 60 samples (Table 2). The number of frames required to sample plant species range from 207 to over 5,500 frames (Table 2).
Table 1 illustrates the effect of frame numbers on the mean, variance, and the estimated sample size required to adequately sample live, litter, total, and bare ground cover. The means within a cover type were fairly consistent regardless of the number of frames used. However, not all means of cover comprising a small percentage of the total area were within 10% of each other. Increas- ing sample size, and increasing the number of samples did not improve the consistency of the means. This has been previously noted by Bonham (1982). The smaller the mean, the higher the calculated required sample size. Over 850 sample numbers were required to adequately measure the bare component of any of the sites which made up 0.2 to 6.6% of the ground cover (Tables 1 and 2). Estimates of individual plant species with small means also required large sample numbers.
Bare soil is the complement of total cover because the sum of the 2 equals 100% ground cover for any particular area. Since both measure the same thing, the amount of cover or the lack of it, the variances of total cover and bare ground cover are identical. How- ever, the same measurements used in equation (2) produce very different required sample sizes to measure the same cover. For example, the sample size, based on 60 frames, required to ade- quately measure total cover on the nongrazed mixture prairie area (Table 1) was only 1 frame whereas measurement of bare ground cover required up to 10,086 frames. The variance of each was 1.6667 but the means were very different, 99.8333 for total versus 0.1667 for bare. When equation (2) is solved, the numerator remains the same because t* and s* do not change, but the denomi- nator changes greatly, which produces large differences in esti- mated numbers. This occurs for all total and bare cover measure- ments. Our data (Table 1) also illustrate that the mean and variance do not change dramatically as sample size is increased beyond a certain number, and unrealistic sample numbers are required when using equation (2) to estimate b. Results suggest that equation (2), as used, is inappropriate and impractical for use as a sample adequacy formula for reclamation assessment.
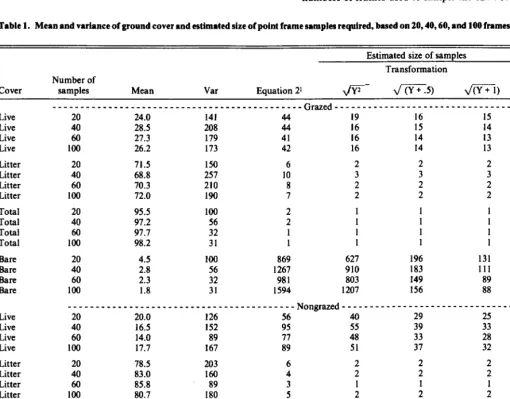
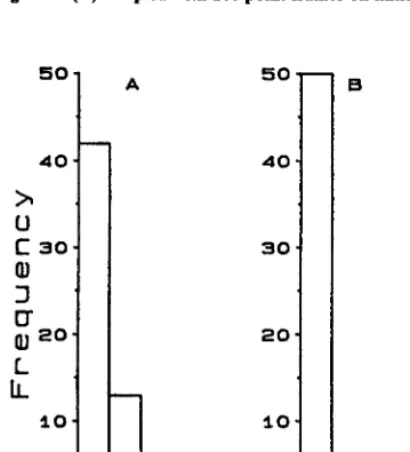
The adequacy formula is based on the assumption that the data are normally distributed. Histograms of the sampling distribution of live plant and litter cover data (Fig. 1 A and 1 B) tended towards the shape of normal distribution whereas bare ground (Fig. 1C) and individual plant species (Fig. 2A and 2B) were distributed towards a Poisson fashion (Li 1964). Histograms of total cover were mirror images of their bare cover counterpart. These latter data are very skewed and nonsymmetrical and would require some form of transformation or adjustment in order for the formula to be an efficient estimator of d (Bonham 1982).
An increase in the number of samples generally did not decrease variance nor was there any pattern of change in variance with
30 A
I
so80
L
300
I-
7 2 s:o 01234
Live Litter Bare
Fig. 1. Histogram of the distribution of live (A) and litter(B) cover and bare ground (C)sampled with 100 point frames on mixed prairie.
50-
40.
r
u
c
30.Fi
;20.k
lo-0-
A
1234
Brome
50
40
30
20
10
0
01234
Bluegrama
Fig. 2. Histogram of the distribution of smooth bromegrass (A) and blue gramr (B) sampled with 60 point frames on reclaimed and native pasture.
is adequate. P q cover percentage or proportion, Q = 100-P or I-P, and kP = relative error. When the quantity to be estimated is a proportion of the population, PQ q Sr. Within the range of 1.25, PQ is fairly stable. Outside this range, larger values of P will overstate the needed sample size (Cochran 1975).
1964). Our cover data in Table 1 suggested this is true. The square root transformation reduced the estimated number of frames required to sample live cover with means that ranged from the high teens to the mid 20’s by about half. Estimated samples for bare means that were less than 5 were changed little and under 1.5 not at all.
Steel and Torrie (1980) recommended am) transformation (Y = the value of an observation) when some of the values are less than 15, especially when zeros are present, which describes our bare cover data. Snedecor (1967) suggested am) transforma- tion if some counts are small. Both transformations have been applied to the data, Tables 1 and 2, which resulted in lower sample size estimates. Using Snedecor’s transformation, numbers of frames required were reduced from unreasonable hundreds to less than 150. However, transformations such as these are generally preferred when data analysis is used to test hypotheses (Bonham 1989), not to determine sample adequacy.
When the population sizes are larger than 10,000, the size of the sample is important, not the percent of the population in the sample. The precision is then stated in terms of the population total (Cochran 1975). For equation (3) kP q d = absolute error = 10% maintains a constant degree of precision for each characteristic (Step 5 above) and meets the desired 10% of confidence width.
Sample sizes estimated using equation (3) ranged from 37 frames to 1 frame (Tables 1 and 2). Mean estimates determined by 40 samples were not improved by sampling with 60 or 100 frames (Table I). Equation (3) also estimates the same sample size for total cover or its complement, bare ground.
Conclusion
Cochran (1977) lists 6 principal steps involved in the choice of sample size which are paraphrased below in the context of this study.
This study provides a better understanding of the effects of sample numbers on point frame field data and applicability of the adequacy formula. It explains why Whitman and Siggeirsson (1954) suggested that many more points were needed to sample grassland vegetation than previous authors had suggested. Whit- man and Siggeirsson used an adequacy formula whereas we and others used a number of different sample sizes to test the effect of
548 JOURNAL OF RANGE MANAGEMENT 43(6), November 1990
1.
2.
3.
4.
5.
6.
There must be some terms of desired limits of error. In cover sampling for reclamation, 90% has been defined.
Some equation that connects n with the desired precision of the sample must be found. Equation (2) has been suggested and is used in the preceding discussion to meet that need.
There will be parameters of the population that are unknown. These must be estimated. In equation (2) and similar equations, the variance usually is unknown. A preliminary sample is used to estimate the variance to compute the number of observations necessary. Additional observations are made and a new mean based on all the observations is computed.
Data often are to be published for major subdivisions of the population and desired limits of error are set up for each subdi- vision. Cover is composed of subdivisions such as live plant, litter, bare ground, rock, species, etc. For reclamation adequacy sampling, the desired limit of error has been set at 10% of the mean.
More than 1 item or characteristic is usually measured in a sample survey. If a degree of precision is prescribed for each item, the calculations lead to a series of conflicting values of n. Some method must be found to reconcile these values. When (i * . 10) is prescribed as the limit of error, the degree of precision is changed depending on the abundance or absence of the cover component in the population. This causes a conflict because total cover and bare ground measure the same ground cover characteristic with the same variance, yet the number of sam- ples required to measure either is very different.
The chosen value of n must be appraised to see whether it is consistent with the resources available to take the sample. Cover measurements requiring hundreds of point frames are costly, especially when improper equations are used to estimate the sample size. Since point data used to measure cover are proportion or percentage data and known to be a binomial or Poisson variate, a more appropriate equation to estimate sam- ple size should be used.
sample size on the mean.
Equation (2) is not applicable for estimating the number of point frames required to measure components of ground cover with means of less than 15% because they tended to be distributed in a Poisson rather than normal fashion. Equation (2) appeared ade- quate when cover means were greater than 15%. Cover compo- nents with means at 60% and greater require 10 or fewer frames. Since total cover and bare ground are complementary, equation (2) will estimate similar sample size only when they are at 50% ground cover. Using recommended data transformation did not correct non-symmetry although lower sample sizes were estimated.
Equation (3), which is appropriate for binomial or Poisson variable data, was also used to estimate sample sizes. Sampling more than the estimated size requirement did not greatly change mean values for various cover components, and satisfied Coch- ran’s (1977) 6 principle steps for choosing sample size. It appears equation (3) is the most appropriate adequacy formula for estimat- ing sample size required for ground cover measurements.
Literature Cited
Bonham, C.D. 1982. Approach to sample adequacy. p. 8-10. In: E.F. Aldon and W.R. Oaks (ed.). Reclamation of mined lands in the southwest. Proc. Symp. SCS, USDA Forest Sew., and WRCC-21, Albuquerque, New Mexico. 20-22 Oct. 1982.
Bonham, C.D. 1989. Measurements for terrestial vegetation. John Wiley & Sons. New York, N.Y.
Chambers, J.C., and R.W. Brown. 1983. Methods for vegetation sampling and analysis on revegetated mined lands. Gen. Tech. Rep. INT-151. Ogden, Utah. USDA Forest Serv.
Cochran, R.S. 1975. Sampling notes. Univ. Wyoming. Stat. Lab. #2014. p. 2-3 l-2-32.
Cochrm, W.G. 1977. Sampling techniques. 3rd ed. John Wiley & Sons. New York, N.Y.
Cracker, R.L., and N.S. Tiver. 1948. Survey methods in grassland ecology. J. Brit. Grassl. Sot. 3:2-26.
Drew, W.B. 1944. Studies on the use of the pointquadrat method of botanical analyses of mixed pasture vegetation. J. Agr. Res. 69:289-297.
Hofm8on, L., and R.E. Ries. 1989. Animal performance and plant produc- tion from continuously grazed cool-season reclaimed and native pas- tures. J. Range Manage. 42248-251.
Hofmann, L., R.E. Rice, and J.E. GiIIey. 1983. Relationship of runoff and soil loss to ground cover of native and reclaimed grazing land. Agron. J. 75599-602.
Levy, E.B. 1933. Technique employed in grassland research in New Zea- land. Imp. Bur. Plant Genet. Herb. Plants Bull. 11:616.
Levy, E.B., and E.A. Madden. 1933. The point method of pasture analyses. New Zealand. J. Agr. 46~267-279.
Li, Jerome, C.R. 1964. Statistical inference I. Edwards Brothers, Inc., Ann Arbor, Mich.
SAS Instttote. 1985. SAS/ GRAPH User’s Guide. Version 5 Ed. Gary, N.C.
Snedecor, G.W. 1956. Statistical methods. Iowa State College Press. Ames, Iowa.
Steel, R&D., and J.H. To&e. 1980. Principles and procedures of statis- tics. Second ed. McGraw-Hill Book Co., New York, N.Y.
Sowards, W.E. 1983. Achieving an adequate sample size for vegetation analyses. p. 63-71. In: E.F. Redente, W.E. Sowards, D.G. Steward, and T.L. Ruiter (ed.). Western coal mining regulatory issues: land use, revegetation, and management. Proc. Symp. West. Reclam. Group, August 1983. CSU Range Science Series 35.
Whitman, W.C., and E.J. Siggeirsson. 1954. Comparison of line intercep tion and point contact methods in the analysis of mixed grass range vegetation. Ecology 35:431-435.