J. Range Manage. 45216-220, March 1992
Technical Note: An improved method for measur-
ing temperatures during range fires
P.W. JACOBY, R.J. ANSLEY, AND B.A. TREVINO
Adon are professor, postdoctoral research associate, and research technician, Texas Agricultural Experiment Station, P. 0. Box 1658, Vernon, Texas 76384.
Abstract
A technique for recording time-temperature curves within field- scale range fires was accomplished using a commercially available data logger capable of rapidly reading large numbers of thermo- couples. A specially designed fireproof box was utilized to house and protect the data logger within the center of the burned area. Programming features allowed temperatures to be measured and recorded rapidly (each second) during the passage of the fire front and recorded as l-minute means before and after the combustion interval. Strategic placement of thermocouples provided time- temperature profiles for various heights above ground, rate of spread, and duration of heat above specific temperatures. Addi- tionally, measurement of preheating prior to the actual flame passage was obtained by placement of the recorder and thermo- couples well within the burned area. This technique may provide better quantification of fire effects on vegetation, especially woody weeds targeted for control with fire, by documenting temperature extremes and their duration at a critical growing points on plants. Key Words: prescribed burning, thermocouple, fire behavior, rate of spread, time-temperature, heat duration
The need to relate heat damage to plants during rangeland burning has focused attention on derivation of time-temperature relationships (Wright and Bailey 1982, Potter et al. 1983, Trollope and Tainton 1986, Engle et al. 1989). Thermocouple-recorder sys- tems have been employed in an attempt to generate such data, but the technique has been limited by the restricted capacity of recorders to measure temperature changes occurring rapidly dur- ing the critical combustion period. Recorders previously used have been able to record only a few thermocouples and were not pro- grammable to change the rate of data storage. These limitations have restricted the ability of researchers to sample at multiple locations during a given fire.
Engle et al. (1989) recently described a system with capability to obtain multiple heat measurements on 2-s intervals utilizing an improved data recorder and algorithms for deriving time- temperature curves. The purpose of our paper is to report a further advancement in characterization of temperature during a fire through the use of a programmable, high-speed, high-capacity data recorder to measure and store temperatures each second at numerous sample points. The ability to record measurements each second eliminated the need for algorithms in obtaining time- temperature curves.
Published with the approval of the director, Texas Agricultural Experiment Station as TA-25703.. Research was funded in part by University Lands-Surface Leasing Interests, Umv. Texas System, Midland; E Paul and Helen Buck Wakgoner Founda- tton, Vernon; and Brush Control and Range Improvement Associatton, Albany.
Trade names and company names are included for the benefits of the reader and imply no endorsement or preferential treatment of the product by the Texas Agricul- tural Experiment Station.
Manuscript accepted 25 May 1990.
216
Materials and Methods
A Campbell CR 7 Measurement and Control System* was used to measure and record temperatures during controlled burns. The system contained a series of input/output cards with resistance temperature devices (RTDs) to record differential voltage mea- surement of up to 70 thermocouples. Thermocouples were formed by electro-fusing 1 end of a 65-m length of double-braided, glass- insulated type K (Chromel-Alumel) wire (20 AWG) overbraided with stainless steel. The other end was attached to the RTD input- output cards via a panel and dual-pronged connectors.2
The recorder was programmed to measure each thermocouple every second and store means every minute while temperatures were less than 40’ C. When temperature at a designated thermo- couple (2-m height for these studies) exceeded 40” C as a result of fire, values for all thermocouples located at that particular station were stored every second. Amount of heat, expressed as degree- seconds, for a given measurement point was computed by sum- ming the temperature values above a designated degree. A portable tape recorder was attached to the data recorder, allowing data to be stored on tape, thus avoiding overwrite on the date storage module.
Thermocouples were attached to vertical standards at positions of -3,O, 10, and 30cm and at 1,2, and 3-m from ground level. Four such sampling stations were located in a line parallel to the move- ment of the fire front. This design provided estimates of the rate of spread and the vertical time-temperature profiles. The below- ground thermocouple was placed at -l-cm for the 1991 fires.
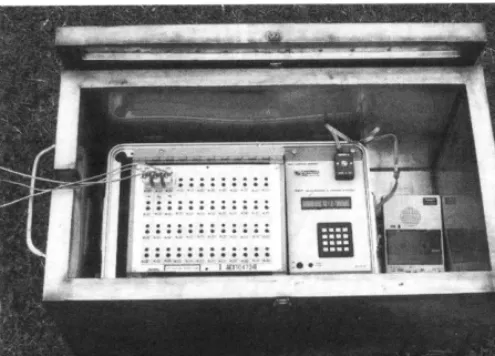
To obtain representative temperatures during a fire, the record- ing device was placed in a specially constructed fireproof container and placed near the center of the area to be burned. The container was constructed of insulated, double-walled, stainless steel, with an access port to accommodate the thermocouple cables and a removable recessed lid for access to the recorder (Fig. 1). Excess space in the cable port was packed with flame resistant cloth during fires. Construction costs for the fireproof box were approximately $485 in December 1989.
Two different tires are used in this paper to illustrate the use of the recording system described above. Both fires were conducted as headtires contained by previously burned firebreaks or graded roads.
Breclcenridge Fire
This fire was conducted on 9 March 1990 on a 220-ha area of rangeland 8 km east of Breckenridge, located in the Limestone Prairies region of the Texas Rolling Plains. The burned area supported a moderately dense stand of honey mesquite (Prosopis glundulosu Torr.) with an understory of grasses comprised mainly of Texas wintergrass (Szipa leucotricha Trin. & Rupr.), buffalo- Campbell Scientific, Inc., P.O. Box 551, Logan, Ut. 84321
2Omega Engineering, Inc., P.O. Box 2669, Stamford, Conn. 06906
Fig. 1. Campbell CR7 Measuremenf snd Control System with plug panel nttPehrd and enclosed within the
fireproof
contsiner
(lid removed,.grass [Buchloe dactyloides (Nutt.) Engelm] and Wright threeawn
(Aristida wrighfii Nash.). Fine fuel was visually estimated at 2,000 t” 2,500 kg ha-‘. Fuel moisture c”“te”t was low as estimated by manually fracturing the leaves and stems. Surface soil moisture was relatively high as a result of recent precipitation; air tempcra-
ture was 30” C ; relative humidity was 60%; and winds were
southerly at 18 t” 20 km h-l.
Vernon Fire
This fire was conducted on 7 March 1991 on a IO-ha plot of native rangeland located 37 km southwest of Vernon in the “orth- er” Rolling Plains vegetational region of Texas. A” overstory of honey mesquite trees 2-3 m in height dominated a” understory of buff&grass, Texas wintergrass, Wright threeawn, Sand dropseed
[Sporobolus cryprnndrus (Torr.) Gray], Japanese bromegrass
(Bromus japonicus Thunb.), little barley (Hordeurn pusiihm
Nutt.), and rescuegrass [Bromus unioloides (Kunth) H.B.K.]. Fine fuel (dry weight) was estimated at 3,700 kg ha-’ by clipping. Fuel moisture c”“te”t was 25%, and this reflects the large proportion of annual grass included in the sample. Soil surface was dry; air temperature was 58O C; relative humidity was 29%; and winds were easterly at 12-19 km h-l.
Results
The data recorder and thermocouples provided quantitative
data regarding rate ofspread, peak temperatures, duration of heat,
and a vertical profile of the time-temperature cm’ves. Instruments were protected by the fireproof box and no temperature changes
were noted within the container during tire passage. We expe-
rienced data loss at 1 of the 4 stations during each fire because of inconsistent fire movement. The tire front did not reach 1 station and approached anOther station laterally rather than frontally. This erratic mwcment of the fire front was attributed t” visually evident discontinuity in the fuel within the mesquite/grass com- munities and s”me natural and animal-caused barriers within the burned area. Rate of spread varied considerably both within and between the 2 tires. Results from each tire arc described and time-temperature curves are illustrated from selected stations dur- ing each fire (Fig. 2).
Breckenridge Fire
Rate of spread averaged 0.42-m se’ and duration of heat greater than 40” Cat the 2-m height averaged 43 s. Peak temperature of
613’ C was measured at IO-cm above ground level, although
temperature at this height remained above 500” C for less than IO s. Total degree-seconds during the rapid recording period triggered
by the 2-m thermocmmle decreased mowxtionallv with increasing
height above ground, varying from i 1,570 at ground level t” 2,458 at 3-m (Table 11. ,.
I” this particular tire, several thermocouples failed t” function properly because of either (1) broken weld at thermocouple junc- tion or (2) faulty connection at the panel. These problems acc”““t for the absence of time-temperature curves at the 0- and IO-cm levels at station I (Fig. 2). The potential for such loss ofdata during
critical sampling periods supports the advantage of having the
capability t” collect data from multiple measurement stations with a high capacity recorder.
Vernon Fire
Rate of spread varied from 0.1 t” 0.16-m s-’ and duration of temperatures greater than 40° C at the 2-m height averaged 60 s. Peak temperature of 609” was measured at the IO-cm height. Only 1 station recorded temperature above 500” C and the duration was 12 s. Duration of heat was greater at the IO-cm or at ground level than at the stations higher from the ground. The 2 stations des- cribed in this paper illustrate different durations of heat at ground level which indicates slower combustion rate at 1 station. This was attributed to smoldering litter or humus “car the soil surface at station 3.
Discussion
Plant responses to tire are best described in terms of temperature extremes and the duration of exposure (Hare 1961, Potter et al.
1983). Since damage t” plant tissue is a” exponential function
Table I. Arrumulsted and msximmn temperature recorded lor specified durations by thermocaupls at 7 vertical locations for 2 recording stations (I & 3) during eontmlled range fires near Breekenridge and Vernon, Texas.
Breckenridge “er”0”
S,a. 1 sta. 3 Sta. I sm. 3
Ht Act. Max *cc. Max. Act. Max Act. Max.
‘:) ..___________..._ 3,890 . . . 183 . . .._ _______ 2,458 _____ _...._ 107 -(CO) . . . .._._._...__.__. 3,077 26 .-..-.--. ;;--& ---.... ;;-
2 4,374 239 2,773 119 4,316 172 3:X12 92
1 6,616 339 4,309 180 6,313 228 5,015 170
0.3 II,080 569 7,798 397 10,180 415 7,510 270
0.1 _ _ 11,250 613 14,670 609 11,450 442
0 _ I 1,270 488 10,500 391 13,560 363
-0.03’ 891 22 782 22 1,096 25 1,540 25
Duration (8) 45 40 50 69
~Depth was 3 Cm for Breekenridgc and I cm for Vernon.
Breckenridge 1
!. . . ‘\
‘A.,* . . .
--.
y .,
$“-,
3Ocm..I
‘“\
. . . .
..cp
“\.a~,;
1
m
‘/i \ 2m
3m /h
-- VW-.
-3 cm
I
Breckenridge 3
I
1Ocm 30 cm
lm 2m 3m
I
c--
\ --V -3 cm
60
--__-
-1 cm
Vernon 1
Ocm 10 cm 30 cm
lm 2m 3m
Vernon 3
10 cm 3Ocm
-1 cm
10 20 30 40 50 60 70 80
Time
(set)
Fig. 2. Time-temperature curves by height at 2 stations each (top and bottom) for fires conducted near Breckenridge and Vernon, Texas. Temperature along the Y axis is expressed logarithmically, and time along the X axis is expressed in seconds during the period that temperature at the 2-m height remained above 400 C.
between time and temperature (Wright and Bailey 1982), high capacity data recorders offer advantages for obtaining these data at multiple sampling points. Such instrumentation facilitates deri- vation of time-temperature profiles and rate of spread. Despite the plethora of investigations on wildland fires, most authors have described plant response to burning without quantitative data. Such terms as “hot” or “cool” to describe fire are of limited value for comparing bums or deriving predictive models for plant response to controlled burning. Even in studies where tempera- tures have been recorded with multipoint recorders, the equipment has lacked programming features and the capacity to sample a large number of locations for relating plant response to varying regimes of heat duration and temperature extremes (Stinson and Wright 1969, Trollope and Tainton 1986).
sentative of the principal zone to be burned. Placement of record- ing instruments within the area to be burned offers an alternative to visual estimation techniques and may facilitate quantification of many critical fire parameters.
Fire behavior models derived from flame height, rate of spread, and residence time have been utilized to estimate fireline intensities and resultant influences on plants (Andrews 1986, Trollope and Tainton 1986). These techniques have provided useful estimates of woody plant damage during fires (Rothermel and Deeming 1980, Trollope 1980) but are less useful in estimating damage to herbace- ous vegetation (Armour et al. 1984, Roberts 1983). Such models may be of more importance in combating fire than predicting fire effects on vegetation (Rothermell983). Additionally, the key input variables are made subjectively and are highly variable from moment to moment. Variation in fuel loads and fuel continuity require multiple estimates to be obtained during conditions when visibility may be largely obscured by smoke. Observations are also limited to the periphery of the burned area and may not be repre-
Measuring rate of spread requires that thermocouple measure- ment stations be established at known distances along a line paral- lel with wind direction and that fuel continuity permits movement of the fire in a constant direction. Distances between stations are limited by the lengths of the thermocouple cables and placement of the recorder. Arrangement of thermocouples and rate of data storage may depend on the objectives of a particular study. Our emphasis was to document the time-temperature profile for temperatures required to scorch woody plants approximately 2-m high. The triggering level can be changed from 2-m to another height and to another temperature other than 40° C. (See Appen- dix I for programming options). For summer burns a high temper- ature should be selected to account for ambient air temperature or direct sunlight on the thermocouples. I
Preheating ahead of the fire front was evident from the rise in temperature in the upper measuring points at a station before those of the lower points (Fig. 2). Preheating of fuel during headfires is a phenomenon that is not measured in the burning of small plots. Placement of recording equipment within field-scale bums permits measurement of fire parameters influenced by self-generated con- vective winds typical of range fires. The capability to measure a large number of points during an actual bum with this type of recorder may provide an alternative to burning numerous small plots for the purpose of evaluating plant response to fire. However,
this suggestion is not intended to diminish the usefulness of micro- plots to assess the relative tolerances of individual plants to bum- ing at critical periods of physiological development (Britton and Wright 1980).
Measurement of rate of spread and time-temperature curves was influenced by fuel continuity or the lack of it within the mesquite/ - grass communities selected for this study. This problem was attrib- uted partly to the selection of the 2-m thermocouple for triggering rapid data storage, as insufficient heat was produced at that height when fire approached the station from any direction but frontally. We observed the fire movement through these mesquite/grass communities to occur more as tongues than as continuous fire front. In such situations we believe variation in rate of spead and other fire behavior factors will be high and difficult to generalize. Future studies will attempt to relate types of fire behavior with density of mesquite and composition of herbaceous understory.
Conclusion
Commercially available data loggers can provide rapid mea- surement of multiple thermocouples for quantifying time-temper- ature profiles during controlled range fires. Such data are desirable for quantifying responses of plant components or communities to burning in different seasonal and environmental conditions and fuel loads. Use of this method to estimate rate of spread and other fire behavior variables offers an alternative to visual estimates and other methods in current use.
Literature Cited
Andrews, P.L. 1986. BEHAVE: fire behavior prediction and fuel modeling system. USDA Forest Serv. Res. Pap. INT-243.
Armour, C.D., SC. Bunting, and L.F. Neuenschwands. 1984. Fire inten- sity effects on understory in ponderosa pine forests. J. Range Manage. 3lZ44-49.
B&ton, C.M., and H.A. Wright. 1980. A portable burner for evaluating effects of fire on plants. J. Range Manage. 32:475-476.
Engle, D.M., T.G. Bidwell, A.L. Ewing, and J.R. Willlams. 1989. A tech- nique for quantifying fire behavior in grassland fire ecology studies. SW Natur. 34179-84.
Hare, R.C. 1961. Heat effects on living plants. USDA Forest Serv. Occas. Paper S-183. Southern Forest Exp. Sta., New Orleans, La. 32 p.
Potter, R.L., D.N. Ueekert, and J.L. Petersen. 1983. Internal temperature of pricklypear cladophylls during prescribed fire in West Texas. Texas Agr. Exp. Sta. PR 4132.
Roberts, F.H., C.M. B&ton, D.B. Webster, and R.G. Clark. 1988. Fire
effects on tobosagrass and weeping lovegrass. J. Range Manage. 41:407409.
Rothermel, R.C. 1983. How to predict the spread and intensity of forest and range fires. USDA Forest Serv. INT-143. 161 p.
Rothermel, R.C., and J.E. Deeming. 1980. Measuring and interpreting fire behavior for correlation with fire effects. USDA Forest Serv., Gen. Tech. Rep. INT-93, Ogden, Ut.
Stinson, K.J., and H.A. Wright. 1969. Temperatures of headfires on the southern mixed prairie. J. Range Manage. 22:169-174.
Trollope, W.S.W. 1980. Controlling brush encroachment with fire in the savanna of South Africa. Proc. Grassl. Sot. So. Afr. l&107-109. Trollope, W.S.W., and N.M. Tainton. 1986. Effect of fire intensity on the
grass and bush components of the eastern Cape thomveld. J. Grassl. Sot. So. Afr. 3~37-42.
Wright, H.A., and A.W. Bailey. 1982. Fire ecology-United States and Southern Canada. John Wiley and Sons, N.Y.
APPENDIX I. Program instructions for Campbell CR7 mea- surement and control system set to measure 28 thermocouples (4 groups of 7 TCs).
* 1 Table 1 Programs 01: 1 Sec. Execution Interval 01: P 17 Panel Temperature
01: 1 IN Card
02: 29 Location: (1st location after last TC) [These instructions (steps 2-12) are for TC group #I] 02: P14 Thermocouple Temp (DIFF)
01: 7 Reps (no. of TCs in this group) 02: 16 500 m V fast range
03: 1 IN Card 04: 1 IN Chan
05: 3 Type K (Chromel-Alumel) 06: 29 Ref Temp Lot
07: 1 Lot: 08: 1 Mult 09: 0 Offset
[These steps (3-6) record the 1 minute mean temperatures] 03: P89
01: 6 02: 4 03: 40 04: 30 04: P92
01: 0 02: 1 04: 10 05: P77
01: 111 06: P71 01: 7 02: 1 07: P94
If X=<F
X Lot (TC at position #6 [2m] is the sensor) <
Fixed Value (” C) Then do
If time is minutes into a minute interval Set flag 0 (output) Real Time
Day, Hour-Minute, Second Average
Reps (TCs) Lot Else
[These steps (8-l 1) record temperatures every second] 08: PI8 Time (makes a counter)
01: 0 Tenths of seconds into minute 02: 10 Mod/by (every 5 seconds) 03: 30 Lot: (location of counter) 09: P89 If X<=>F (compares time)
01: 30 x Lot 02: 4 <
03: 10 Fixed Value 04: 10 Set flag 0 (output) 10: P77 Real Time
01: 111 Day, Hour-Minute, Second 11: P7 1 Average
01: 7 Reps 02: 1 Lot 12: P95 End
[Repeat steps 2-12 for the no. of groups of TCs] [Advance P14, statement 4 by the no. of reps (TCs)]
Key: T=Table No. E=Entry No. L=Location No.
1: 2: 1: 1st TC, Group 1
1: 13: 8: * “2
1: 24: 15: * “3
1: 35: 22: * ” 4
1: 1: 29: Panel Temperature
1: 8: 30: Counter, Group I
1: 19: 31: - ” 2
1: 30: 32: ” ” 3
1: 41: 33: * ” 4
-_-:P End Table 1
[The following instruction expands the storage capacity] * A Mode 10 (Memory Allocation)
01: 200 Input Locations 02: 3000 Intermediate Locations