PHYSICAL REVIEW C74, 024607 (2006)
Time variability of
α
from realistic models of Oklo reactors
C. R. Gould∗
Physics Department, North Carolina State University, Raleigh, North Carolina 27695-8202, USA, and Triangle Universities Nuclear Laboratory, Durham, North Carolina 27708-0308, USA
E. I. Sharapov
Joint Institute for Nuclear Research, 141980 Dubna, Moscow region, Russia
S. K. Lamoreaux
Los Alamos National Laboratory, Los Alamos, New Mexico 87545, USA (Received 15 May 2006; published 28 August 2006)
We reanalyze Oklo149Sm data using realistic models of the natural nuclear reactors. Disagreements among
recent Oklo determinations of the time evolution ofα, the electromagnetic fine structure constant, are shown to be due to different reactor models, which led to different neutron spectra used in the calculations. We use known Oklo reactor epithermal spectral indices as criteria for selecting realistic reactor models. Two Oklo reactors, RZ2 and RZ10, were modeled withMCNP. The resulting neutron spectra were used to calculate the change in the149Sm effective neutron capture cross section as a function of a possible shift in the energy of the 97.3-meV
resonance. We independently deduce ancient149Sm effective cross sections and use these values to set limits on
the time variation ofα. Our study resolves a contradictory situation with previous Okloαresults. Our suggested 2σ bound on a possible time variation ofαover 2 billion years is stringent:−0.11α/α0.24, in units of 10−7, but model dependent in that it assumes onlyαhas varied over time.
DOI:10.1103/PhysRevC.74.024607 PACS number(s): 06.20.Jr, 07.05.Tp, 24.30.−v, 28.20.Gd
I. INTRODUCTION
Two articles [1,2] on the determination of the time evo-lution ofα the electromagnetic fine structure constant from Oklo reactor data recently appeared, adding contradictory results to earlier investigations [3–6]. In units of 10−7, the fractional change of α over a 2-billion-yr (BY) period has been found from Oklo data to be α/α = +0.45+−00..1707 [1],
−0.56α/α0.66 [2],−0.9α/α1.2 [5], and either
−0.18α/α0.02 orα/α= +0.88±0.07 in Ref. [6]. By comparison, astrophysics determinations from data on the shifts of the absorption lines in the spectra of quasar light have yielded (also in units of 10−7)α/α= −72+−1818[7] and
α/α= −6+−66[8] over an approximately 10-BY period. The sign ofαis defined by the relationshipα=αpast−αpresent, so that a negative sign, for example, means that 2–10 billion years ago the value ofαwas smaller than at present. For more results and references on the time variation of fundamental constants see Refs. [9,10].
As the results indicate, the situation is not entirely satis-factory: some analyses give only upper limits, whereas those showing a definite effect disagree even in sign. Although theo-retical models have been proposed that can accommodate time-dependent rates of change ofα, clarifying the disagreements among the Oklo analyses is important, particular because there are also questions about just how model dependent these very precise limits actually are [11–13]. In this article we will concentrate on the nuclear physics aspects of the Oklo reactors, focusing in particular on realistic models of the neutronics.
∗Electronic address: chris [email protected]
The Oklo phenomenon has been known since 1972. The history of the discovery, the geological background, the relevant petrography, mineralogy, isotopic chemistry and the Oklo reactors physics are definitively described by Naudet [14]. Most of details of the Oklo phenomenon to which we will refer are from this largely unknown text. Findings from more recent Oklo studies are reported in Refs. [15,16].
Sixteen natural uranium reactors have been identified in Gabon, West Equatorial Africa, in three different ore deposits: at Oklo; at Okelobondo, 1.6 km away; and at the Bangombe, 20 km south of Oklo. Collectively, these are called the Oklo fossil reactors. Well-studied reactors include zone two (RZ2), with more than 60 bore holes, and more recently zone ten (RZ10), with 13 bore holes. In RZ2, 1800 kg of235U underwent fission over 850 kyr of operation and in RZ10 about 650 kg of235U fissioned (more rapidly) over 160 kyr of operation. All reactor zones were found deficient in 235U, and in most of them fission products were well retained. Isotopic concentrations were measured by mass spectrometry and provided information on the neutron fluency, the neutron spectral index, and the235U restitution factor (burned235U is partly regenerated after αdecay of 239Pu formed in neutron capture on238U).
Due to the low 0.72%, abundance of 235U and the high np capture cross section, present-day natural uranium cannot sustain a nuclear chain reaction with light water as a moder-ator. However, 2000 million years ago,1 when fission chain
1The age of the Oklo natural reactors is debated in the literature:
reactions started at Oklo, 235U had a relative abundance of 3.7%, comparable to the 3%–5% enrichment used in most commercial power reactors. In those times, therefore, a chain fission reaction was possible in principle and actually took place. Reactors in the northern part of the deposit, including RZ2 and RZ10, operated at a depth of several thousand meters, under then-marine sediments that came close to, but still below, the surface after the tectonic uprising about 250 millions yr ago. At this depth, the conditions of pressure and temperature are close to those of the pressurized water reactors (PWR) of today (temperature around 300◦C, pressure about 20 MPa). Of course, the Oklo reactor powers of 10–50 kW are greatly below the 1000-MW scale of the present reactors and furthermore probably did not operate continuously. The authors of Ref. [17] deduced that RZ13 operated for a 0.5 h until the accumulated heat boiled away the water, shutting down the cycle for up to 2.5 h until the rocks cooled sufficiently to allow water saturation to initiate a new cycle.
Shlyakhter [3] was the first person to point out that a change inαcould shift the position of the 97.3-meV neutron resonance in 149Sm and that as a result the present-day capture cross section could be different from the ancient value. Assuming a reactor temperature of 300K, and taking the fission isotope abundances known at that time, he found no evidence for a shift in the resonance position and accordingly obtained an upper bound for the fractional change in α of 0.1×10⁻⁷ (a revised number from comments in Ref. [2]). Using updated abundance and temperature data, Damour and Dyson [5], and later Fujii et al. [6], carried out more detailed studies for RZ2 and RZ10. They calculated the present-day effective cross section by averaging the resonance cross section over a presumed fully thermalized Maxwellian neutron spectrum. In such an approach there is no need for a particular model for the Oklo reactors because the spectrum is determined solely by the temperature. Their results for the variation inαwere basically in agreement, indicating no change. By contrast, in the recent articles [1] and [2], where contradictory results have been obtained, the averaging is performed over neutron spectra with a 1/E epithermal tail in an addition to the Maxwellian contribution. Spectra with different contributions from the epithermal neutron tail were obtained with an infinite reactor model in Ref. [1] and from Monte Carlo modeling of a finite reactor in Ref. [2]. Not surprisingly, the use of different neutron spectra can lead to different results. But because these models are not unique, the question arises as to how to choose between them and between other models.
In the present work we suggest using measured Oklo reactors epithermal spectral indices as criteria for selecting realistic reactor models. We performMCNPcalculations to find full-scale models of RZ2 and RZ10 satisfying these criteria, and we use the resulting neutron flux spectra to calculate the dependence of the effective 149Sm capture cross section on the resonance shift. We deduce independently the ancient 149Sm effective neutron capture cross section using an updated formalism. From our limits on the 97.3-meV resonance shift, and assuming that only electroweak physics is varying, we can set stringent limits on the time variation ofαfrom the Oklo data.
The article is organized as follows: In Sec.II, we review the definition of the effective cross section and the definitions of the various spectral indices used to define the contributions of the epithermal neutrons to the neutron flux. In Sec.III, we present our models of the Oklo reactor zones and ourMCNP calculations of the neutron spectra. In Sec.IVwe calculate the149Sm capture cross section as a function of the resonance energy shift, and in Sec. V we review our new calculation of the ancient149Sm cross section. In sec.VIwe present our results and conclusions.
II. EFFECTIVE CROSS SECTIONS AND SPECTRAL INDICES
To analyze the Oklo reactor data without explicitly specifying the neutron density n(v) at velocity v, it is customary to use not the average cross section ¯σ =
∞
0 n(v)σ(v)v dv/
∞
0 n(v)v dv but instead an effective cross section defined as
ˆ
σ =
∞
0
n(v)σ(v)v dv/nv0. (1) Heren=0∞ n(v)dvis the total density andv0=2200 m/sec is the velocity of a neutron at thermal energy 0.0253 eV. To keepR, the reaction rate, unchanged it is necessary also to introduce an effective neutron flux density ˆ=∞
0 n(v)v0dv different from the “true” flux=0∞n(v)v dv, leading to
R=σˆˆ =σ ¯ .
When the cross section for a particular reaction channel exactly follows a 1/v law (σ =σ0v0/v), we have ˆσ =σ0
and the reaction rate ˆσˆ =σ0nv0 does not depend on the temperature T. When the cross section σ deviates from the 1/v law at low energies (as it does for 149Sm), and when the neutron spectrum is not pure Maxwellian (as is the case in any realistic reactor), the effective cross section can be written
ˆ
σ =g(T)σ0+rOI, (2) whereg(T), a function of the temperatureT, is a measure of the departure ofσ from the 1/v law,I is a quantity related to the resonance integral of the cross section, andrO is the Oklo reactor spectral index, a measure of the contribution of epithermal neutrons to the cross section. The more well-known epithermal Westcott indexr[18] is related torO by
rO =r
T T0
. (3)
The Westcott index is a temperature-dependent quantity, whereas rO (as shown below) and I are independent of temperature.
Because we will be concerned with extracting rO from neutron spectra calculated by MCNP for specific reactor models, we follow Ref. [18] and introduce the total neutron densityn(v) and its epithermal fractionfepi:
n(v)=n[(1−fepi)nth(v)+fepinepi(v)], (4) where nth(v)=(4/π)(v3/v3
otherwise zero, is an epithermal distribution that holds for systems with zero resonance absorption. Each of the distri-butionsnth(v) and nepi(v) is normalized separately to unity. The velocityvcis an as-yet unspecified cutoff velocity for the epithermal distribution andvT is the most probable neutron velocity for Maxwellian with the temperature T as given byvT =v0(T /T0)
1
2. The temperature T0 is the temperature of the Maxwellian density distribution having the most probable velocityv0, defined from the relationmv2
0/2=kT0= 0.0253 eV.
The authors of Ref. [18] suggest cutting off the ep-ithermal distribution at energy Ec=µkT with the pa-rameter value µ5. The corresponding temperature-dependent threshold velocity is then vc=vT√µ. At such a threshold the Maxwellian component is already sev-eral times larger than the epithermal one, so such an approximation is satisfactory. The Westcott spectral index
ris then defined as
r=
√π µ
4 fepi(T)fepi. (5) To assess the temperature dependence of fepi(T), we trans-form from neutron densities to neutron fluxes. This yields for the total thermal componentφth≡n(1−fepi) ¯v=n(1−
fepi)vT √
4/π, and for an ideal (without resonance absorption) epithermal flux per unit of neutron lethargy [lethargy is
u=ln(10/EMeV)]φepi(u=1)=nfepivc/2. Introducing the ratio
δ=φepi(u=1) φth
, (6)
we find:
δ=
√π µ
4
fepi
1−fepi. (7)
For small values offepiandµ5, we see thatδfepi. The quantityδis calculated in reactor physics [18] and for the case of moderation by hydrogen is
δ= a(v0) (H)
π T0
4T . (8)
Here a(v0) is the summed macroscopic absorption cross section at neutron velocityv0, and(H) is the macroscopic scattering cross section of hydrogen in the epithermal region. From this equation and identifyingδwithfepiwe see that the epithermal fraction of the neutron density in a reactor behaves asfepi(T)∝√T0/T, thereby confirming that the Oklo spectral index defined by Eq. (3) is independent of temperature.
In realistic systems the epithermal flux deviates from the 1/E dependence due to absorption of neutrons in uranium resonances above an energy of several eV. In this case, two different definitions of rO, both approximations, have been used. References [14] relies on the shape of the neutron flux and defines
rO =
φepi(u )
φth
T
T0
, (9)
whereφepi(u ) is the flux per unit of lethargy at some effective energy in the resonance region and φth is the total flux
integrated up to an energy where the flux begins to increase above the 1/E level. In Ref. [18] the spectral index r at room temperature is computed as the ratio of the effective macroscopic absorption cross section ˆa to the moderating power ¯ξ s[18] and therefore
rO= ˆ
a ¯
ξ s
. (10)
We compare these three definitions in the next section. In Ref. [1], the temperature-dependent Weinberg-Wigner [19] thermalization parameter(T)=2Aa(kT)/sis used. For the case of hydrogen moderation only, it is related torO by
rO ≈ √
π/4(T0)/2.
The Oklo spectral indices rO are known quantities; their values have been deduced for several Oklo reactor zones [14– 16,20] from analysis of the fission products143Nd,147Sm, and the235U concentrations. We will use these spectral indices to discriminate between possible models of the ancient reactor zones. In particular, the following experimental values have been deduced: rO =0.20 −0.25 for RZ2 and rO =0.15± 0.02 for RZ10. The RZ2 result is a range of the bore-hole SC36 values corrected in Ref. [14] after reevaluation of the cross section ˆσ143Nd to the expression ˆσ =335−100ro. We report the RZ10 result as an average from four samples of Ref. [16].
III. OKLO REACTOR MODELS AND NEUTRON SPECTRA
The reactor criticality is determined by the size, geometry, and composition of the active zone. The latter influences the energy dependence of the neutron flux. The Oklo reactor zones include uraninite UO2, gangue (oxides of different metals with water of crystallization), water, and poisons that are present initially or build up during operation. Among these parameters, the most uncertain is the amount of water present at the time of reactor operation. In our modeling, we vary this parameter to match the experimental spectral indices for RZ2 and RZ10 while keeping the reactor under critical conditions.
The Oklo reactor cores have a characteristic horizontal size of order 10 m and occur in sandstone as lens-shaped bodies of thicknesses varying between 20 and about 90 cm. The uranium content ranged from 20 to 80 wt .%. Each core is surrounded by a clay mantle. In the past water filled spaces left by cracks and fissures. The effective porosity required to achieve criticality is large (∼20%) and is explained by a desilicication process [14, 15] consisting of partial leaching of the silica by hot thermal underground water.
TABLE I. Composition (in g/cm3) and neutronic parameters of the Oklo reactors. The values shown values are for 2 BY ago, for example,
30 wt.% of UO2in RZ10 dry ore then corresponds to≈22 wt.% in present-day ore.
Zone UO2 H2O SiO2 FeO Al2O3 MgO MnO K2(Ca)O Total keff, at 300 K rOa p
RZ2 2.500 0.636 0.359 0.149 0.238 0.077 0.009 0.020 3.99 1.033b 0.22 0.800
RZ10 0.850 0.355 0.760 0.320 0.510 0.160 0.020 0.040 2.96 1.036 0.15 0.845
aTher
Ovalues are calculated from the neutron densities (see text).
bThe value for the composition with a poison of 10 ppm Boron-10 equivalent.
is the small amount of uraninite UO2 in RZ10. In fact, with such a small amount of UO2it was not possible to make RZ10 critical with a poison more than 1 ppm of boron-10 equivalent. The amount of water shown in TableIis a total amount, also including water of crystallization.
To check the effects of chemical bonding, we repeated MCNPcalculations using the option that considers scattering from hydrogen bound in water molecules. The spectra were essentially unchanged except at the very lowest energies, and calculations of ˆσ149(see Sec.IV) showed 1% changes or less at all temperatures. All calculations were therefore made with the free gas option.
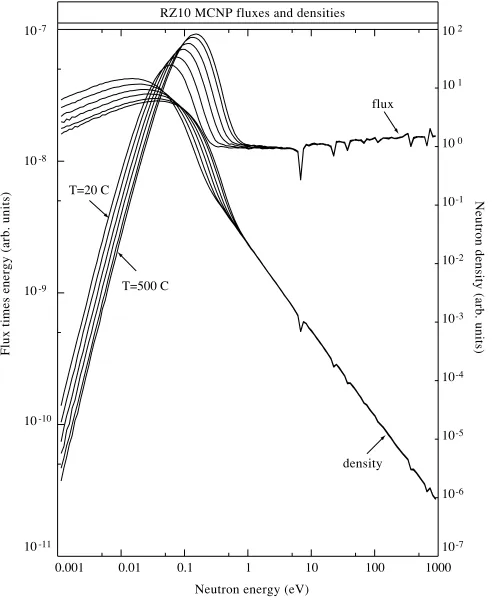
TheMCNPneutron fluxes and neutron densities are shown in Figs. 1 and 2 for temperatures 20, 100, 200, 300, 420,
1 0.1 0.01
0.001 10 100 1000
Neutron energy (eV)
Flux times energy
(arb. units)
RZ10 MCNP fluxes and densities
10-7
10-6
10-5
10-4
10-3
10-2
10-1
100
101
102
10-7
10-8
10-9
10-10
10-11
Neutron density (arb. units)
density flux
T=20 C
T=500 C
FIG. 1. Reactor zone RZ10 MCNP neutron fluxes and neutron densities for temperatures 20, 100, 200, 300, 420, 500◦C. The neutron fluxes are plotted asφEand are the family of curves starting from a temperature of 20◦C at the lower left. The neutron densities (normalized to one neutron per unit volume) are the families of curves starting upper left.
and 500◦C. The neutron fluxes are the family of curves starting at the lower left of each figure. The leftmost curve corresponds to a temperature of 20◦C and the rightmost curve to 500◦C. The uranium absorption resonances are prominent in the epithermal region. Also of note is that the flux is not flat in the epithermal region, indicating the spectrum is not precisely 1/E. The neutron densities (normalized to one neutron per unit volume) are the families of curves starting upper left in each figure. The topmost curve corresponds to 20◦C and the lowest curve corresponds to 500◦C.
Oklo spectral indices can be calculated from these density plots, using Eqs. (3) and (5), with a cutoff parameterµ=5. The values we get forrOare shown in TableI. They agree with the experimental values cited earlier, confirming that we have
1 0.1 0.01
0.001 10 100 1000
Neutron energy (eV)
Flux times energy (arb.
units)
RZ2 MCNP fluxes and densities
10-6
10-5
10-4
10-3
10-2
10-1
100
101
102
10-7
10-8
10-9
10-10
10-11
10-12
Neutron
density (arb. units)
density flux
T=20 C
T=500 C
TABLE II. Moderation characteristics of the Oklo reactor zone RZ2. For this reactor the hydrogen to uranium atomic ratio isNH/NU =7.6, and the spectral index from Eq. (10) is found to berO=0.24.
Atom Ni,1021cm−3 ai,cm−1 si,cm−1 ξi ξisi/s
235U 0.207 0.140 0.003 0.008 0.0000
238U 5.374 0.014 0.048 0.0008 0.0003
10B 0.011 0.042 0.000 0.210 0.0000
H 42.60 0.014 0.873 1.000 0.7591
O 47.50 0.0000 0.204 0.120 0.0213
Si 3.57 0.0006 0.008 0.011 0.0001
Fe 2.92 0.0030 0.003 0.036 0.0001
Al 7.30 0.0007 0.005 0.070 0.0004
Mg 1.35 0.0001 0.005 0.080 0.0004
Mn 0.08 0.0010 0.0003 0.036 0.0000
K 0.26 0.0005 0.0005 0.040 0.0000
Totals N=111.2 a=0.216 s=1.150 ξ¯ =0.782
realistic models of the reactor zones. The resonance escape probabilitypshown in the last column of TableIis discussed in Sec.V.
A specific feature of our present model as compared with Ref. [1] is the presence of gangue in the reactor core. This means the reactor moderator is a composite substance with atoms besides hydrogen participating in the slowing down and absorption of neutrons. The contributions of these other atoms are presented in TableIIfor RZ2 and in TableIIIfor RZ10. Whereas only oxygen adds an appreciable amount to the moderating power ¯ξ s(here ¯ξis the effective logarithmic energy loss defined as ¯ξ =i[ξisi/s]), several other elements contribute to the absorption parameter a. Using these parameters, alternative values forrO can be calculated from Eq. (10), as shown in the tables. These values agree well with the values determined from the neutron density spectra as shown in TableI. We confirmed also that using the neutron flux spectra with Eq. (9), good agreement forrO values is found if the value for the flux per unit of lethargy is taken at about 100-eV neutron energy; this takes into account the deviation seen in theMCNPsimulations of the flux from the 1/Elaw.
The calculated spectral index for the infinite medium reactor model of Ref. [1] isrO =0.53, which is far away from
the experimental value of 0.15. The difference is mainly due to the small amount of water (NH/NU 3) which is much less than the values we found for RZ2 and RZ10. The possibility of a larger amount of water in the core was excluded on the grounds that the reactor would became divergent. Although this is true for an infinite reactor, including uranium, water, and a poison, it is not true for afiniteOklo reactor that contains an additional constituent—a gangue. Our MCNP modeling confirmed that leakage of neutrons from a finite reactor of about 70 cm thick composed of only uranium and a small amount of water was greater than from an identical geometry reactor with gangue and much more water. As a consequence the reactor of the Ref. [1] is undercritical if it is made finite.
The reactor models in Ref. [2] are close to ours in geometry but the active core compositions differ in uranium and water content. Spectral indicesrO were not reported. The “case 1” model of Ref. [2] has 1.5 g/cm3of UO
2and 0.355 g/cm3H2O at a total density of 3.4 g/cm3with atomic ratioNH/NU =7.0. This ratio is below our value of 13.0, therefore we believe it does not accurately represent RZ10. TheNH/NU =7.0 ratio is close to the expected value for RZ2 but the other compositions deviate from values established in Ref. [14].
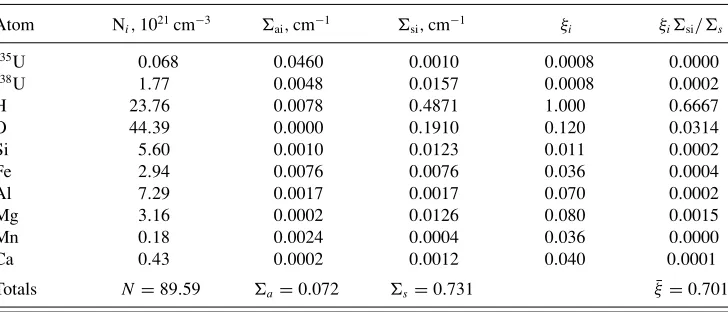
TABLE III. Moderation characteristics of the Oklo reactor zone RZ10. For this reactor the hydrogen to uranium atomic ratio isNH/NU =13.0, and the spectral index from Eq. (10) is found to berO=0.14.
Atom Ni,1021cm−3 ai,cm−1 si,cm−1 ξi ξisi/s
235U 0.068 0.0460 0.0010 0.0008 0.0000
238U 1.77 0.0048 0.0157 0.0008 0.0002
H 23.76 0.0078 0.4871 1.000 0.6667
O 44.39 0.0000 0.1910 0.120 0.0314
Si 5.60 0.0010 0.0123 0.011 0.0002
Fe 2.94 0.0076 0.0076 0.036 0.0004
Al 7.29 0.0017 0.0017 0.070 0.0002
Mg 3.16 0.0002 0.0126 0.080 0.0015
Mn 0.18 0.0024 0.0004 0.036 0.0000
Ca 0.43 0.0002 0.0012 0.040 0.0001
IV. THE CROSS SECTION AVERAGING PROCEDURE
Following previous work, we evaluate the effective capture cross section ˆσ for149Sm numerically. The calculations were carried out with the code SPEAKEASY [22]. We include all resonances up to 51.6 eV along with the subthreshold reso-nance at−0.285 eV. We neglect resonance interference terms and use parameters from Mughabghabet al. [23]. In practice, the contribution of the 97.3-meV resonance dominates; other resonances contribute only a few percentages to the sum. The bulk of the calculations were carried out neglecting Doppler broadening; separate calculations with the codeSAMMY[24] indicated Doppler effects on ˆσ149 were essentially negligible for all temperatures considered, as also found by earlier work. TheMCNPcalculations provide the neutron flux per energy bin, φon a lethargy gridu running from 23 to 9.3 in steps of 0.1. This gives neutron energies E=107e−u in eV from about 1 meV up to 1 keV, with bin widths E=0.1E. A finer grid is required for the numerical integrations of cross sections for resonance neutrons because typical total resonance widths in149Sm are of order 100 meV. Accordingly, theMCNP flux is interpolated onto a lethargy grid with step size 0.001 (E=0.001E). The flux is also renormalized by requiring the total neutron density to sum to unity (n=1).
The effective cross section ˆσis evaluated numerically using ˆ
σ = 1 v0
i
j
σijφi. (11)
Hereσijis the Breit Wigner cross section for resonancejat neutron energy Ei, φi is the neutron flux at energy Ei in a bin of width 0.001Ei, andv0=2200 m/s is the velocity of a thermal neutron.
The Breit Wigner cross sectionσijfor a neutron of massm, energyEiat resonancejhaving resonance energyErj, neutron widthnij, and decay widthγjis given by
σij= g0jπ¯h
2
2mEi
nijγj
(Ei−Erj)2+ij2/4
. (12)
The energy-dependent neutron width (assumed answave) for resonancej is given by
nij=Ei(eV)n0j, (13) where the product of the spin statistics factor g0j and the reduced neutron widthn0j is tabulated in Ref. [23]. The total width is given by
ij=γj+nij (14) and the resonance energy is given by
Erj =Erj0+r, (15) whereErj0is the (present-day) resonance energy andris the energy shift associated with a possible change in the value of the fine structure constantα.
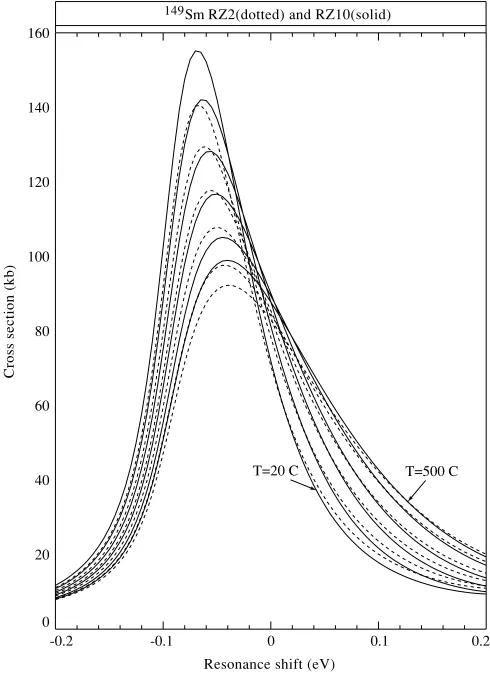
Summing over all resonances, we evaluate ˆσ149for values of r from −200 meV to +200 meV. The results are shown in Fig. 3 for RZ2 (dotted lines) and RZ10 (solid lines) for temperatures T =20,100,200,300,420,500◦C. Temperatures run from top to bottom; in each caseT =20◦C
-0.2 -0.1 0 0.1 0.2
0 20 40 60 80 100 120 140 160
Resonance shift (eV)
Cross section (kb)
149Sm RZ2(dotted) and RZ10(solid)
T=20 C T=500 C
FIG. 3. Calculations of the149Sm effective capture cross section
ˆ
σ149 as a function of a possible resonance energy shift r from
−200 meV to +200 meV. The results shown are for RZ2 (dotted lines) and RZ10 (solid lines), and for temperaturesT=20, 100, 200, 300, 420, 500◦C starting from the top.
is the top curve and 500◦C is the bottom curve. All resonances up to 51.6 eV are included in calculations and are assumed to shift the same amount. Calculations with Maxwell-Boltzman spectra were also performed; in all cases they agreed closely with previous work.
V. CALCULATION OF THE ANCIENT CAPTURE CROSS SECTION
To rederive the ancient 149Sm capture cross section, we consider the time evolution of the number densitiesNA(t) of the six isotopes of interest:235U,238U,239Pu,147Sm,148Sm, and149Sm. We model the time dependence of the densities by the following set of coupled differential equations:
dN5
ˆ
φdt = −σˆ5,totN5+ λ9
ˆ
φN9 (16)
dN8
ˆ
φdt = −σˆ
0
8N8− (17)
dN9
ˆ
φdt =σˆ
0 8N8−
λ9
ˆ
=(1−p)(ν9σˆf,9N9+ν5σˆf,5N5) (19)
dN147 ˆ
φdt = −σˆ147N147+σˆ5,fY5,147N5+σˆ9,fY9,147N9 (20) dN148
ˆ
φdt = −σˆ148N148+σˆ147N147 (21) dN149
ˆ
φdt = −σˆ149N149+σˆ148N148
+σˆ5,fY5,149N5+σˆ9,fY9,149N9. (22)
In these equations, the subscripts 5, 8, and 9 refer to 235U, 238U, and239Pu, respectively, and tot andf refer to the total (absorption) and fission cross sections. The average neutron flux, ˆφ, is assumed to be constant on a time scale long compared to the decay constants in the problem. The Y represent the fission yields to the Sm isotopes of interest, the subscripts 147, 148, and 149 refer to147Sm,148Sm, and149Sm, respectively, and ν5,9 are the average number of neutrons produced by 235U and239Pu, respectively. We take the reactor start time as 2 BY ago at t0=0 and the end of operation for RZ10 as
t1=160 kyr and for RZ2 ast1=850 kyr.
Our calculation differs from the work of Fujiiet al. [6] in that we explicitly incorporate the resonance escape probability,
pin modeling the restitution of235U. We also include a term for the239Puαdecay rate, 1/λ
9=24.141/ln(2)=34.8 kyr, which leads to a reduction in the restitution of 235U, the issue being that 34.8 kyr is not small compared to the reactor operating lifetime of 160 kyr for RZ10.
The resonance escape probability is the probability that a neutron produced by fission is not absorbed on the principal absorber in the system, 238U, when moderating through the resonance region. The quantity (1−p) therefore gives the fraction of fission neutrons that are absorbed by238U, most of which eventually converted to239Pu. The conversion factorC
is defined as the ratio of atoms239Pu produced to the number of atoms235U “burned” in thermal neutron absorption. It is calculated (Eq. (7.8) in Ref. [19]) as
C =R−1 σˆ
0 8 ˆ
σ5,tot
+(1−p)ν5
ˆ
σf,5 ˆ
σ5,tot
, (23)
where the first term is the contribution to conversion from thermal neutrons (hereR is the fraction of atoms235U in the uranium fuel) and the second term is due to the absorption of neutrons by238U in the resonance region. Not all converted atoms end as the restituted235U atoms, because some atoms 239Pu will be burned in the thermal neutron flux ˆφ. The restitution factorC∗is defined as
C∗ = C
1+φˆσˆ9,tot λ9
. (24)
The expected value ofpis shown in TableIand is calculated as follows. For U in a composite moderator, the definition of the resonance escape probability is
p=exp
−¯1
ξ s
a 1+a/s
dE
E ≡exp
−¯NU
ξ s
Ieffres ,
(25) where the effective resonance integralIres
eff for a homogeneous mixture of fuel and moderator was found in experimental and theoretical works (Ref. [19], Eq. (10.29)) to be
Ieffres=3.8
1024 s NU
0.42
. (26)
In these equations, s is the total macroscopic scattering cross section of all elements in the active core and ¯ξ is the corresponding effective logarithmic energy loss defined by (Ref. [19], Eq. (10.20)) as ¯ξ =iξisi/
isi.
Note that these equations assume that the atoms are free for the energy loss, i.e., chemical bond effects are neglected. Because the resonance integral is over the range 0.5 eV to 100 keV, the effects of chemical bonds are expected to be small. From these equations and using the RZ10 characteristics from TableIII, we calculate for RZ10 the value (1−p)=0.155. Equation (23) gives C(RZ10)=0.11+2.05(1−p)=0.43. For themetasample RZ10 flux (see later) we then getC∗=
0.77C=0.33, which, as expected, is lower than the average (0.38) of the values quoted in Hidaka and Holliger (HH) [16]. The coupled equations are solved with input parameters [14] listed in (Table IV). We confirmed the correctness of these effective cross sections by also calculating the in-tegral ˆσ =σ(E)(E, T)dE/(E, T)/E/0.0253dE) with our MCNP fluxes. Because the resonance escape prob-ability represents the capture probprob-ability for E >0.5 eV,
ˆ
σ80 is determined by integrating to 0.5 eV, the rest of the resonance integral being incorporated into the resonance escape probability.
The coupled equations are solved as follows. First, fix-ing 1−p=0.155 for RZ10, and with starting parameters
N5(0)=0.0370, N8(0)=0.963, N9(0)=0, we can solve the first three equations for the fluence ˆφt1which reproduces the
N5(t1)/N8(t1)≡(N5(t1)+N9(t1))/N8(t1) ratio determined by the present-day HH data for each RZ10 sample. We use
TO=2×10⁹years ago to derive the ratios at timet1. We also calculate values for ametasamplethat represents an average of the individual sample properties. The idea of the metasample is that there could have been internal mixing between the samples or other processes. It is also useful to see whether the sample averages provide results in a reasonable range.
TABLE IV. Effective cross sections for RZ10 and RZ2 used to determine ˆσ149(cross sections are based on data from Naudet. Numbers in
the first row are for the zone RZ10 and in the second row for RZ2).
ˆ
σ5, kb σˆ5,f, kb σˆ9, kb σˆ9,f, kb σˆ80, kb σˆ147, kb σˆ148, kb Y5,147 Y9,147 Y5,149 Y9,149 ν5 ν9
0.656 0.549 2.05 1.35 0.0027 0.142 0.0024 0.0226 0.0226 0.011 0.011 2.43 2.88
TABLE V. RZ10 calculated fluences ˆφt1and ancient cross sections ˆσ149. Input data for Sm and U isotope fractions
(above the empty line) are from Ref. [16]. Calculated values are below the empty line. For these calculationst1=160
kyr. The metasample input data are an average of the data for the four individual samples.
Property SF84-1469 SF84-1480 SF84-1485 SF84-1492 Meta
N5(t1)/N8(t1) 0.03176 0.02662 0.02967 0.03042 0.02962
f144(t1) 0.001052 0.002401 0.002073 0.001619 0.001786
f147(t1) 0.5534 0.5323 0.5403 0.5481 0.5435
f149(t1) 0.005544 0.002821 0.004466 0.004296 0.004281
ˆ
φt1(kb)−1 0.475 0.915 0.645 0.585 0.650
N5+N9(t1)/N8(t1) 0.03177 0.02666 0.02969 0.03041 0.02963 NSm(0)/NU(0) 12.0×10⁻⁶ 50.5×10⁻⁶ 32.1×10⁻⁶ 22.6×10⁻⁶ 27.6×10⁻⁶
f147(t1) 0.5532 0.5323 0.5404 0.5483 0.5434
f149(t1) 0.005542 0.002836 0.004470 0.004289 0.004283
ˆ
σ149(kb) 94 86 81.5 96 85
With the fluence fixed, we next vary the starting amount of elemental Sm relative to U, NSm(0)/NU(0) to reproduce the ending isotopic fraction f147(t1), and then vary the cross section ˆσ149 to reproduce the ending isotopic frac-tion f149(t1). We use the natural abundancies to convert from an elemental starting ratio to the isotopic starting ra-tios [f144(0)=0.031, f147(0)=0.151, f148(0)=0.113, and
f149(0)=0.139]. In principle the starting fraction of Sm relative to U, although very small, is not a free parameter; it is determined by data forf144(t1) because144Sm is not produced in fission:
f144(t1)NSm(t1)=f144(0)NSm(0). (27) In practice, although ˆσ149 can be tuned closely to match
f149(t1), we were not able to reproducef147(t1) without also varyingNSm(0)/NU(0). TableVsummarizes our results. The measured values from HH are shown above the empty line and our calculated values forN5(t1)/N8(t1), f147(t1) andf149(t1), are shown below the empty line, along with our calculated fluences, calculated starting fractions of elemental Sm relative to U, and calculated ˆσ149values for the four RZ10 samples and the metasample. The mean of the four values is 89.4 kb, with sample standard deviation 6.8 kb.
The starting fractions,NSm(0)/NU(0), vary but are consis-tent with HH data for bore holes 1640 and 1700 outside the reactor zones and apart from 1480 are within a factor of 2 of values predicted by the HH data. The mean value for the ending
amount ofNSm(t1)=74.6±19.6µg/g agrees well with the mean of the measured HH values 67.8±36.0µg/g, also giving us confidence that the starting ratios are reasonable.
As a final value for RZ10 we adopt the cross section extracted for the metasample, and to take account of sample-to-sample variations we adopt the sample standard deviation as a 1σuncertainty:
ˆ
σ149=85.0±6.8 kb. (28) This is in good agreement with the mean of the four RZ10 samples analyzed by Fujiiet al. [6]: 91.2±7.6 kb, again taking their sample standard deviation as a 1σ error.
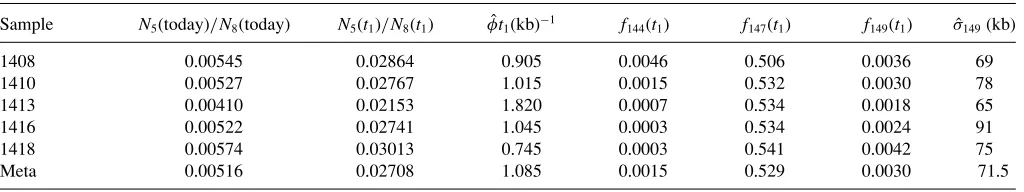
Data for 15 RZ2 samples were analyzed by Damour and Dyson [5], who set a 2σbound 57σˆ14993 kb. Results from RZ2 have tended to show more scatter because the samples come from mining near the surface with a greater potential for contamination compared to the deep underground samples for RZ10. Nevertheless we repeated our calculations for the five RZ2 samples from bore-hole SC36—1408 to 1418—cited by Ruffenach [21] as having the most important contributions of elements formed in fission. We followed the same procedure as for RZ10, also including analysis of a metasample formed by averaging the input data for the five individual samples. With (1−p) fixed, we varied the flux to match the U isotope ratios and then varied ˆσ149 and the starting elemental ratio of Sm and U to reproduce the endingf147(t1) andf149(t1) fractions. TableVIsummarizes the results. The average of the five values
TABLE VI. RZ2 borehole SC36 calculated fluences ˆφt1 (column 4) and ancient cross sections ˆσ149 (column 8). Input data for Sm and
U isotope fractions (columns 2, 5, 6, and 7 are from Ref. [21]). For these calculationst1=850 kyr. The metasample input data are an average
of the data for the five individual samples.
Sample N5(today)/N8(today) N5(t1)/N8(t1) φtˆ1(kb)−1 f144(t1) f147(t1) f149(t1) σˆ149(kb)
1408 0.00545 0.02864 0.905 0.0046 0.506 0.0036 69
1410 0.00527 0.02767 1.015 0.0015 0.532 0.0030 78
1413 0.00410 0.02153 1.820 0.0007 0.534 0.0018 65
1416 0.00522 0.02741 1.045 0.0003 0.534 0.0024 91
1418 0.00574 0.03013 0.745 0.0003 0.541 0.0042 75
is 75.6 kb with a sample standard deviation of 10.0 kb. The metasample value is 71.5 kb, and we therefore adopt as our RZ2 result:
ˆ
σ149=71.5±10.0 kb, (29) a value consistent with the RZ10 result and with the Damour and Dyson analysis.
VI. RESULTS FOR RESONANCE SHIFT AND
CHANGE INα
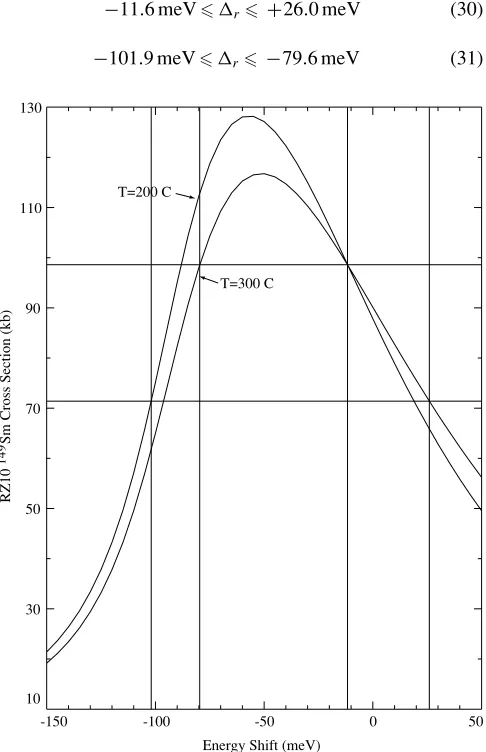
To calculate bounds on the possible shift of the149Sm reso-nances over time we use the RZ10 result ˆσ149=85.0±6.8 kb and conservatively adopt a ±2σ range to establish limits: 71.4σˆ14998.6 kb. We further assume that the reactor operated between 200 and 300◦C as per the analysis by Meshicket al. [17], which limits the temperature to this range, and as per knowledge that the geological formation and depth would not allow liquid water to be present above 300◦C.
An expanded version of the calculated RZ10 ˆσ149 cross sections at 200 and 300◦C is shown in Fig.4. From it we obtain two solutions for the resonance energy shiftr:
−11.6 meVr +26.0 meV (30) −101.9 meVr −79.6 meV (31)
-150 -100 -50 0 50
10 30 50 70 90
T=200 C
T=300 C 110
130
Energy Shift (meV)
RZ10
149
Sm Cross Section (kb)
FIG. 4. Expanded version of the RZ10 cross section plot of Fig.3
for temperatures 200 and 300◦C and the bounds onrobtained from our±2σ limits on the ˆσ149.
The left-branch negative solution is tentatively ruled out by Fujiiet al. [6] on the basis of other data, but we retain it here for completeness.
Damour and Dyson [5] analyzed the dependence onαof the Coulomb energy contribution to the resonance energy of149Sm and concluded that an energy shift due to the electromagnetic interaction was related to a shift inαby
α α =
r
1.1 MeV. (32)
The energy 1.1±0.1 MeV was estimated from known isotopic shifts in the mean square radii of the proton density distributions in samarium.
With our results for the bounds on the 97.3-meV resonance shiftr in149Sm in Eq. (32) we therefore obtain 2σ bounds (in units of 10−7) on theαchange of
−0.11α
α 0.24 (33)
or
−0.93α
α −0.72. (34)
Our result is quite insensitive to the assumption of fixedp. Varying the H/U ratio changes p and therefore affects the neutron spectrum and the resulting effective cross section. The major effect is due to change in the overlap of the neutron spec-trum with the149Sm 97.3-meV resonance. Combining the ef-fect on the derived ˆσ149and the change in the overlap of the neu-tron spectrum, we findδ(r)∼(50 meV)δp. A 10% change inp therefore leads to a change inr of order 5 meV, well within the 2σbounds assumed in extracting our final result.
In their analysis Damour and Dyson assumed that changes in the nuclear part of the Hamiltonian did not correlate with changes in the Coulomb energy over time. They noted that changes in the mq/mp could, in principle, show themselves as changes of the resonance position. However, at that time there was no theory to allow estimates of such effects. Recent quantum chromodynamics- (QCD) based developments have speculated that a time variation in α could be accompanied by a larger (up to a factor of 30) variation of the (QCD) scale parameter (=213MeV) [12,13] which characterizes the masses of participating particles. Changes in the effective nuclear potential from, e.g., changes in mπ/mp could, in principle, therefore have a significant effect on the resonance shift. A detailed theoretical analysis and quantitative estimates of the nuclear physics aspects of the neutron resonance shift remain to be carried out. In such a situation the present result from the Oklo reactor data, although stringent—and consistent with no shift inαover a 2-BY period—should be regarded as model dependent [9,11].
ACKNOWLEDGMENTS
[1] S. K. Lamoreaux and J. R. Torgerson, Phys. Rev. D 69, 121701(R) (2004).
[2] Yu. V. Petrov, A. I. Nazarov, M. S. Onegin, V. Yu. Petrov, and E. G. Sakhnovsky, At. Energy98, no. 4, 296 (2005); arXiv:hep-ph/0506186.
[3] A. Shlyakhter, Nature264, 340 (1976). [4] Yu. V. Petrov, Sov. Phys. USP.20, 937 (1977). [5] T. Damour and F. Dyson, Nucl. Phys.B480, 37 (1996). [6] Y. Fujii et al., Nucl. Phys. B573, 377 (2000), revisited in
arXiv:hep-ph/0205206, 19 May 2002.
[7] J. K. Webb, M. T. Murphy, V. V. Flambaum, V. A. Dzuba, J. D. Barrow, C. W. Churchill, J. X. Prochaska, and A. M. Wolfe, Phys. Rev. Lett.87, 091301 (2001).
[8] R. Srianand, H. Chand, P. Petitjean, and B. Aracil, Phys. Rev. Lett.92, 121302 (2004).
[9] E. Peik, B. Lipphardt, H. Schnatz, T. Schneider, Chr. Tamm, and S. G. Karshenboim, Phys. Rev. Lett.93, 170801 (2004). [10] J.-P. Uzan, Rev. Mod. Phys.75, 403 (2003).
[11] W. J. Marciano, Phys. Rev. Lett.52, 489 (1984).
[12] P. Langacker, G. Segre, and M. J. Strassler, Phys. Lett.B528, 121 (2002).
[13] X. Calmet and H. Fritzsch, Eur. Phys. J. C24, 639 (2002). [14] R. Naudet,Oklo: des R´eacteurs Nucl´eaires Fossiles(Eyrolles,
Paris, 1991).
[15] F. Gauthier-Lafaye, P. Holliger, and P.-L. Blanc, Geochimica et Cosmochimica Acta60, No. 23, 4831 (1996).
[16] H. Hidaka and P. Holliger, Geochimica et Cosmochimica Acta
62, No. 1, 89 (1998).
[17] A. P. Meshik, C. M. Hohenberg, and O. V. Pravdivtseva, Phys. Rev. Lett.93, 182302 (2004).
[18] C. H. Westcott, W. H. Walker, and T. K. Alexander, Proc. 2nd Int. Conf. Peaceful Use of Atomic Energy(United Nations, New York, 1958), Vol. 16, p. 70.
[19] A. M. Weinberg and E. P. Wigner, Physical Theory of Neutron Chain Reactors (Univ. of Chicago Press, Chicago, 1958).
[20] J. C. Ruffenach, J. Menes, C. Devillers, M. Lucas, and R. Hagemann, Earth Planet. Sci. Lett. 30, 94 (1976).
[21] J. C. Ruffenach, in: IAEA-TC-119/16,Natural Fission Reactors: Proceedings (International Atomic Energy Agency, Vienna, 1978), p. 441.
[22] Econometric Modeling and Computing Corporation, Palm Harbor, FL (www.speakeasy.com).
[23] S. F. Mughabghab, M. Divadeenam, and N. E. Holden,Neutron Cross Sections(Academic Press, New York, 1981), Vol. 1. [24] N. Larson,SAMMY: Multilevel R-Matrix Fits to Neutron Data
Using Bayes’ Equations, available from RSICC-ORNL, P.O. Box 2008, Oak Ridge, TN 37831-6362.
[25] J. F. Briesmeister, ed., MCNPTM—A General Monte Carlo