ABSTRACT
KIRSCHMEIER, BENJAMIN ANDREW. Wing-Wake Interactions in Aeroelastic Systems. (Under the direction of Dr. Matthew Bryant).
Wing-wake interactions have been a topic of considerable interest due to the complex
in-teractions between wings and incident vorticity. Common examples of wing wake inin-teractions
occur in insect flight, such as the dragon fly, fish swimming with tail and dorsal fin interaction,
and energy harvesting applications. Interactions in each of these applications are determined
by the shed vorticity from an upstream oscillating wing. The transfer of vortex energy to the
downstream wing dictates the aeroelastic response. The dissertation presented here discuss
ex-perimental investigations into nonlinear wing-wake aeroelastic phenomena. Specifically, this
work studies the effect of vortical disturbances on an aeroelastic wing undergoing limit cycle
oscillations and develops signal analysis techniques to understand those interactions.
Experi-ments were conducted using two different upstream bodies to generate vortical disturbances
on the downstream aeroelastic wing: another aeroelastic wing in a limit cycle and a fixed bluff
body. In conjunction with these wake-interaction experiments, an aeroelastic inverse technique
was developed to estimate the aerodynamic loads and power distribution for a wing
undergo-ing limit cycle oscillations. The work was divided into three separate studies, as summarized
below.
The first study experimentally investigated tandem aeroelastic wing-wake interactions to
quantify how structural properties dictate vortex energy transfer. The pitch stiffness of the
downstream wing was varied such that it was less than or equal to that of the upstream wing. It
was hypothesized that pitch stiffness modulates the sensitivity of the wing to incoming vortex
disturbances thus changing vortex energy transfer to the wing. The experimental results showed
are dependent on its pitch stiffness, while the upstream wing dictated the aeroelastic stability
and flutter point of the downstream wing.
The second study focused on developing an algorithm to compute the aerodynamic forces
and moments of an aeroelastic wing undergoing large amplitude heave and pitch limit cycle
oscillations. The aeroelastic inverse technique is based on inverting the equations of motion to
solve for the lift and moment generated on the wing. Bayesian inferencing is used to estimate
the structural parameters of the system and generate credible intervals on the lift and moment
calculations. The aeroelastic inverse technique is then validated against prescribed aeroelastic
motion in a water tunnel. The efficacy of the inversion technique was then shown by studying
the affect of mass coupling on limit cycle oscillation amplitude. By investigating the evolution
of the force, power, and energy of the system, the reasons for amplitude growth with wind
speed are determined.
Finally, in the third part of this work, the effect of an upstream wake generated by a
rectan-gular cylinder bluff body on an aeroelastic wing undergoing large amplitude limit cycle
oscilla-tions was studied. Experimental results show that under certain condioscilla-tions, the large amplitude
limit cycle is annihilated. The conditions under which annihilation occurs are dependent on the
limit cycle frequency, bluff body shedding frequency, and the magnitude of the mass coupling
in the system. The kinematic and aerodynamic behavior of limit cycle annihilation was
exam-ined by applying the aeroelastic inverse technique developed in the second study, along with
© Copyright 2019 by Benjamin Andrew Kirschmeier
Wing-Wake Interactions in Aeroelastic Systems
by
Benjamin Andrew Kirschmeier
A dissertation submitted to the Graduate Faculty of North Carolina State University
in partial fulfillment of the requirements for the Degree of
Doctor of Philosophy
Mechanical Engineering
Raleigh, North Carolina
2019
APPROVED BY:
Dr. Ashok Gopalarathnam Dr. Andre Mazzoleni
Dr. Venkat Narayanaswamy Dr. Matthew Bryant
DEDICATION
To my fiancée,
for showering me with endless love and support and making sure I defended before our
wedding;
To my parents,
for always encouraging me and believing in my success;
To my brother,
for always wanting the best for me;
To my friends,
BIOGRAPHY
Ben received his BS in Mechanical Engineering with a concentration in Aerospace engineering
from The George Washington University in May 2014. During his time at GWU, he gained
research experience working for Dr. Adam Wickenheiser for two summers. Additionally, he
started the GWU Rocket Team with his friends and they placed 3rd overall in their first ever
competition. After graduation Ben went North Carolina State University to pursue a doctoral
degree under the guidance of Dr. Matthew Bryant. He will complete the requirements for his
ACKNOWLEDGEMENTS
First and foremost, I would like to thank my advisor, Dr. Matthew Bryant, for his support and
guidance over the past five years, and for sparking my interest in aeroelasticity. I would also
like to thank the members of my committee, Dr. Ashok Gopalarathnam, Dr. Andre Mazzoleni,
Dr. Venkat Narayanaswamy and Dr. Ralph Smith, for their time and input into my research.
To all of my labmates over the years, Marc, Punnag, Ted, Tyler, Warren, Rag, Zach, Graham,
Jake, Stephan, Nick, and David, thank you for all your valuable feedback, joking around, and
providing useful distractions from work.
Finally, I would like to thank all my friends and family for helping me throughout graduate
school. To my parents, brother, and family, thanks for all the support, encouraging me, and
making sure I was doing well. To all my friends from high school, college, and graduate school,
thanks for always putting a smile on my face and putting up with my complaints about graduate
school. And finally, to my wonderful fiancée, Megan, for always believing in me, for her
fun-loving nature always bringing a smile to my face, and for keeping me on track to finish my
graduate studies.
I gratefully support from the Air Force Office of Scientific Research under award number
FA9550-17-1-0301, monitored by Dr. Gregg Abate. I gratefully acknowledge additional
fund-ing support for this research from the National Science Foundation under Award No. ECCS –
TABLE OF CONTENTS
LIST OF TABLES . . . vii
LIST OF FIGURES . . . ix
LIST OF SYMBOLS . . . xiii
Chapter 1 Introduction to wing wake interactions . . . 1
1.1 Aeroelastic Behavior of a Wing or Airfoil . . . 1
1.2 Research Aims . . . 3
Chapter 2 Experimental Investigation of Wake-Induced Aeroelastic Limit Cycle Oscillations in Tandem Wings . . . 5
2.1 Introduction . . . 5
2.2 Experimental Methods . . . 9
2.2.1 Experimental Apparatus . . . 9
2.2.2 Data Acquisition and Reduction . . . 12
2.3 Results and Discussion . . . 14
2.3.1 Aeroelastic Response of a Single Wing . . . 14
2.3.2 Tandem Wing Aeroelastic Interactions . . . 26
2.4 Conclusion . . . 42
Chapter 3 Aeroelastic Inverse: Estimation of Aerodynamic Loads During Large Amplitude Limit Cycle Oscillations . . . 43
3.1 Introduction . . . 43
3.2 Experimental Setup . . . 46
3.3 Aeroelastic Inverse Method . . . 48
3.4 System Identification and Uncertainty Quantification . . . 52
3.4.1 Model Selection and Sensitivity Analysis . . . 52
3.4.2 Uncertainty Quantification . . . 56
3.4.3 Model Calibration . . . 58
3.4.4 Aerodynamic Force Prediction and AEI Validation . . . 61
3.5 Results and Discussion . . . 64
3.5.1 Bifurcation Analysis . . . 64
3.5.2 Limit-cycle Kinematic Analysis . . . 66
3.5.3 Limit-cycle Force Analysis . . . 67
3.5.4 Limit-Cycle Power and Energy Analysis . . . 71
3.5.5 Coupling Energy Analysis . . . 74
Chapter 4 Amplitude Annihilation in Wake-Influenced Aeroelastic Limit Cycle
Oscillations . . . 78
4.1 Introduction . . . 78
4.2 Experimental Methods . . . 81
4.3 System Characterization and Modeling . . . 84
4.3.1 Parameter Estimation . . . 84
4.3.2 System Energies . . . 87
4.4 Results . . . 89
4.4.1 Wing Limit Cycle Oscillation Behavior . . . 89
4.5 Analysis and Discussion . . . 95
4.5.1 Recurrence Analysis . . . 95
4.5.2 Instantaneous Frequency Analysis . . . 100
4.5.3 Coupling and Aerodynamic Energy Analysis . . . 104
4.6 Conclusion . . . 107
Chapter 5 Conclusions and Future Work . . . 108
5.1 Key Findings of Tandem Wing Aeroelastic Experiments . . . 108
5.2 Key Findings of the Aeroelastic Inverse Method . . . 109
5.3 Key Findings of Limit Cycle Annihilation . . . 109
5.4 Future Work . . . 110
5.5 Final Conclusions . . . 112
LIST OF TABLES
Table 2.1 Limit cycle oscillation characteristics for AW-1. . . 16 Table 2.2 Limit cycle oscillation characteristics for AW-1. . . 25 Table 2.3 LCO amplitude and frequency characteristics of AW-1 and AW-2 in
tan-dem configuration withkpAW−2/kpAW−11 pitch configuration atU∞=6.21 m/s. . . 30 Table 2.4 LCO phase characteristics of AW-1 and AW-2 in tandem configuration
withkpAW−2/kpAW−1 1 pitch configuration atU∞=6.21 m/s. . . 31 Table 2.5 LCO amplitude and frequency characteristics of AW-1 and AW-2 in
tan-dem configuration withkpAW−2/kpAW−11 pitch configuration atU∞=6.51 m/s. . . 31 Table 2.6 LCO phase characteristics of AW-1 and AW-2 in tandem configuration
withkpAW−2/kpAW−1 1 pitch configuration atU∞=6.51 m/s. . . 31 Table 2.7 LCO amplitude and frequency characteristics of AW-1 and AW-2 in
tan-dem configuration with kpAW−2/kpAW−1 0.5 pitch configuration atU∞= 6.21 m/s. . . 33 Table 2.8 LCO phase characteristics of AW-1 and AW-2 in tandem configuration
withkpAW−2/kpAW−1 0.5 pitch configuration atU∞=6.21 m/s. . . 33 Table 2.9 LCO amplitude and frequency characteristics of AW-1 and AW-2 in
tan-dem configuration with kpAW−2/kpAW−1 0.5 pitch configuration atU∞= 6.51 m/s. . . 33 Table 2.10 LCO phase characteristics of AW-1 and AW-2 in tandem configuration
withkpAW−2/kpAW−1 0.5 pitch configuration atU∞=6.51 m/s. . . 34 Table 2.11 LCO amplitude and frequency characteristics of AW-1 and AW-2 in
tan-dem configuration with kpAW−2/kpAW−1 0.3 pitch configuration atU∞= 6.21 m/s. . . 35 Table 2.12 LCO phase characteristics of AW-1 and AW-2 in tandem configuration
withkpAW−2/kpAW−1 0.3 pitch configuration atU∞=6.21 m/s. . . 35 Table 2.13 LCO amplitude and frequency characteristics of AW-1 and AW-2 in
tan-dem configuration with kpAW−2/kpAW−1 0.3 pitch configuration atU∞= 6.51 m/s. . . 36 Table 2.14 LCO phase characteristics of AW-1 and AW-2 in tandem configuration
withkpAW−2/kpAW−1 0.3 pitch configuration atU∞=6.51 m/s. . . 36 Table 3.1 Results from Parameter Subset Selection Algorithm with the quasi-global
sensitivity matrix to determine least influential parameters ofM(θ). . . . 55
Table 3.2 Fixed structural parameter values. . . 56 Table 3.3 MAP estimates and credible intervals for the Config - 1 and Config - 2. . 60
LIST OF FIGURES
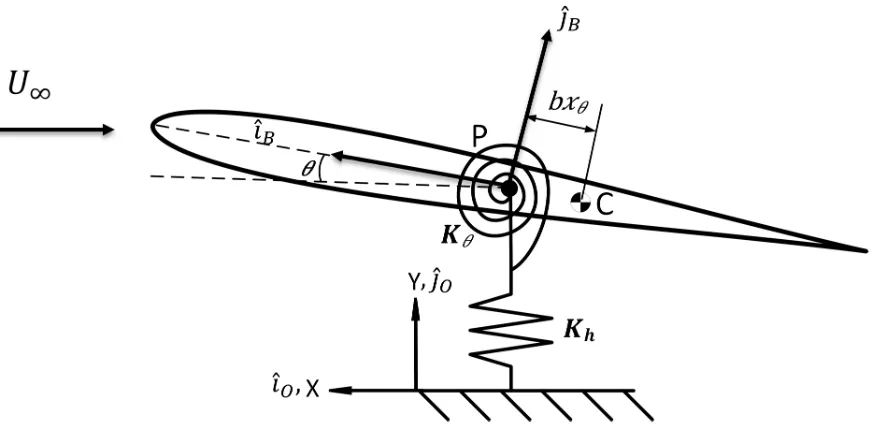
Figure 1.1 Typical aeroelastic section . . . 2
Figure 2.1 Top view schematic of compound double pendulum aeroelastic device with coordinates defined. See figure 3 for an isometric view of the de-vices with components labeled. . . 9 Figure 2.2 Restoring moment in heave (a) and pitch (b) degrees of freedom, theory
from Kirschmeier et al. [43]. . . 11 Figure 2.3 (a) Schematic of tandem wing wind tunnel tests (b) Experiment in wind
tunnel with hot-wire probe. . . 12 Figure 2.4 Total velocity signal decomposed into individual components (a) and
convergence of phase-averaged velocity (b). . . 13 Figure 2.5 Aeroelastic modal frequency responses in freestream for (a) AW-1 and
(b) AW-2 with various pitch stiffnesses. . . 15 Figure 2.6 Phase planes of AW-1 LCO at (a)U∞ = 6.21 m/s and (b) U∞= 6.51
m/s. Shaded area represents limit cycle orbits plotted over entire testing period and black dashed line is the phase-averaged heave and pitch cycle. 16 Figure 2.7 (a) Instantaneous wing position and trace of instantaneous wing pivot
location. (b)Scaled phase-averaged velocity profile 0.52c downstream of trailing edge of wing. x’s represent instantaneous trailing edge posi-tion while o’s represent instantaneous leading edge posiposi-tion.U∞=6.21 m/s for both (a) and (b). . . 17 Figure 2.8 Spatially distributed frequency content of<U(t)> /U∞at (a)U∞=6.21
m/s and (b)U∞=6.51 m/s. The hot-wire probe is located 0.52c down-stream of trailing edge for both (a) and (b). . . 19 Figure 2.9 Phase-averaged velocity downstream of AW-1 with and without the
pivot rod for AW-2 present. . . 20 Figure 2.10 (a) Time history of phase-average velocity for two streamwise locations
x/c = 0.52 and 2.12. (b) Calculated convective speeds from both phased-averaged and turbulent velocity signals.U∞= 6.21 m/s for both (a) and (b). . . 22 Figure 2.11 Phase planes of AW-2 LCO at (a)U∞= 7.04 m/s and (b)U∞= 7.30 m/s.
Shaded area represents limit cycle orbits plotted over the entire testing period and black dashed line is the phase-averaged heave and pitch cycle. 23 Figure 2.12 (a) Instantaneous wing position and trace of instantaneous wing pivot
Figure 2.13 Spatially distributed frequency content of<U(t)> /U∞at (a)U∞=7.04 m/s and (b)U∞=7.30 m/s. The hot-wire probe is located 0.89c down-stream of trailing edge. . . 25 Figure 2.14 Modal frequencies in tandem wing case for (a) initial deflections
ap-plied to AW-1, (b) initial deflections apap-plied to AW-2, and (c) initial deflections applied to both devices. Pitch stiffness on AW-2 is 0.09 Nm/rad in all cases. . . 27 Figure 2.15 (a) Time traces of heave motion for initial deflection to AW-1 (top row),
and initial deflection to AW-1 and AW-2 (bottom row). (b) Pitch re-sponse of AW-2 for each pitch stiffness for similar initial conditions. . . 29 Figure 2.16 (a) Phase planes of LCO for AW-1 and AW-2 in tandem configuration
withkpAW−2/kpAW−1 1 pitch configuration. (b) Spatially distributed fre-quency content of U(t)/U∞0.89c downstream of AW-2 forkpAW−2/kpAW−11 pitch configuration. (a) and (b) atU∞= 6.21 m/s. . . 32 Figure 2.17 (a) Phase planes of LCO for AW-1 and AW-2 in tandem configuration
withkpAW−2/kpAW−1 0.5 pitch configuration. (b) Spatially distributed fre-quency content of U(t)/U∞0.89c downstream of AW-2 forkpAW−2/kpAW−10.5 pitch configuration. (a) and (b) atU∞= 6.21 m/s. . . 34 Figure 2.18 (a) Phase planes of LCO for AW-1 and AW-2 in tandem configuration
withkpAW−2/kpAW−1 0.3 pitch configuration. (b) Spatially distributed fre-quency content of U(t)/U∞0.89c downstream of AW-2 forkpAW−2/kpAW−10.3 pitch configuration. (a) and (b) atU∞= 6.21 m/s. . . 37 Figure 2.19 a) Instantaneous wing position and trace of instantaneous wing pivot
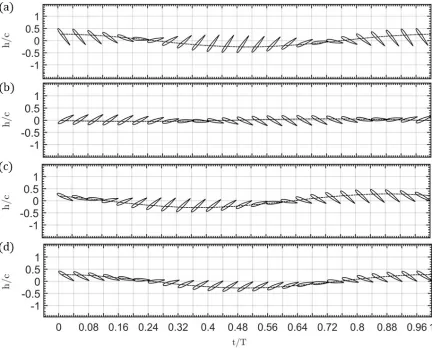
lo-cation withU∞= 6.21 m/s for (a) AW-1, (b) AW-2 withkpAW−2/kpAW−10.1 (c) AW-2 withkpAW−2/kpAW−1 0.5 and (d) AW-2 withkpAW−2/kpAW−1 0.3. . 40 Figure 3.1 Schematic of aeroelastic apparatus with relevant properties labeled and
picture of aeroelastic wing in subsonic wind tunnel. . . 47 Figure 3.2 Spring torque measurements with load cell compared to Eqn. 4.3 . . . . 54 Figure 3.3 Joint densities and marginal posterior histograms for Config - 1 . . . 59 Figure 3.4 Free decay comparison of experiment and model for (a) Config - 1 and
(b) Config - 2. . . 60 Figure 3.5 Comparison of (a)CL and (b)CM from AEI method and AFRL
pre-scribed motion measurements. Reynolds number for this case is 75,600. Note,· · ·represent the 95% credible interval for each measurement . . . 63 Figure 3.6 E(t)/E0 versus time for (a) Config - 1 and (b) Config - 2 for wind
Figure 3.7 (a) Heave amplitude, (b) pitch amplitude, and (c) pitch-heave phase dif-ference versus wind speed. Note error bars in amplitude plots represent the deviation in amplitude over the recorded time and not the measure-ment error. . . 67 Figure 3.8 Lift coefficient and effective angle of attack versus cycle fraction for
(a-c) Config - 1 atU∞=7.2m/s,U∞=10m/s, andU∞=12.1m/s, re-spectively, and (d-f) Config - 2 atU∞=7.2m/s,U∞=10m/s, andU∞= 12.1m/s, respectively. A,A0 represent the maximum and minimum lift whileB,B0 are when full lift stall occurs ([16]). Note,· · ·represent the 95% credible intervals. . . 69 Figure 3.9 Moment coefficient and effective angle of attack versus cycle fraction
for (a-c) Config - 1 atU∞=7.2m/s,U∞=10m/s, andU∞=12.1m/s, respectively and (d-f) Config - 2 atU∞= 7.2m/s, U∞= 10m/s, and U∞ = 12.1m/s, respectively. C,C0 represent the maximum and mini-mum moment whileD,D0are the corresponding moment when full lift stall occurs ([16]). Note,· · ·represent the 95% credible intervals. . . 70 Figure 3.10 a)CLmax vsh/cfor both mass coupling configurations. b) DynamicCL
versusθ compared to thin airfoil theory and static measurements
per-formed by AFRL. c) DynamicCMversusθ compared to static
measurements performed by AFRL, measured at the half chord (only Config -1 shown for clarity).Note,· · ·represent the 95% credible intervals. . . . 71 Figure 3.11 Aerodynamic energy for (a) Config - 1 and (b) Config - 2 and
aerody-namic efficiency for (c) Config - 1 and (d) Config - 2 versus wind speed. Note,· · ·represent the 95% credible intervals. . . 72 Figure 3.12 Power from aerodynamic lift and heave velocity versus cycle fraction
for (a-c) Config - 1 atU∞=7.2m/s,U∞=10m/s, andU∞=12.1m/s, respectively and (d-f) Config -2 at U∞ = 7.2m/s, U∞ = 10m/s, and U∞=12.1m/s, respectively. Note,A,A0,B,B0are the same time stamps from Figure 3.8 and· · ·represent the 95% credible intervals. . . 73 Figure 3.13 Power from aerodynamic moment and pitch velocity versus cycle
frac-tion for (a-c) Config - 1 at U∞ = 7.2m/s, U∞ = 10m/s, and U∞ = 12.1m/s, respectively and (d-f) Config -2 atU∞=7.2m/s,U∞=10m/s, andU∞ = 12.1m/s, respectively. Note,C,C0,D,D0 are the same time stamps from Figure 3.9 and· · ·represent the 95% credible intervals. . . 75 Figure 3.14 Coupling energy between the degrees of freedom for both
configura-tions. Note,· · ·represent the 95% credible intervals. . . 76
Figure 4.1 Schematic of aeroelastic apparatus with relevant properties labeled and picture of aeroelastic wing in subsonic wind tunnel. . . 83 Figure 4.2 Free decay comparison of experiment with model for (a) Config - 1 and
Figure 4.3 (a)Pitch time histories, (b) pitch amplitude versus wind speed and (c) heave amplitude versus wind speed for wing LCO without the bluff body upstream. . . 90 Figure 4.4 a) Frequency spectrum of pitch response for five selected wind speeds
without the bluff body present. b) Frequency spectrum of pitch response with the bluff body present for all wind speeds tested. xθ =0.078 for each figure. . . 91 Figure 4.5 a) Pitch time histories, (b) pitch amplitude versus wind speed and (c)
heave amplitude versus wind speed for wing LCO with the bluff body upstream. . . 93 Figure 4.6 Multiple LCO annihilations at fs/fLCO=2.92 forxθ =0.078, (a) first
two seconds of motion and (b) full time history. . . 94 Figure 4.7 a) Kinematic recurrence of LCO annihilation event with the rest of the
time signal. Regions of similarity are highlighted with blue markers. b) Kinematic and bluff body joint recurrence of LCO annihilation with the rest of the time signal.xθ =0.078 and fs/fLCO= 2.98 for both figures. . 98 Figure 4.8 Multi-trial cross recurrence for three different trials at fs/fLCO=2.98
andxθ =0.078. Corresponding regions of similarity between trials are highlighted with colored markers. . . 100 Figure 4.9 Continuous wavelet transforms for xθ =0.078 at (a) fs/fLCO = 2.72,
(b) fs/fLCO= 2.98, and (c) fs/fLCO= 3.21. . . 101 Figure 4.10 (a) Instantaneous frequency and (b) pitch heave frequency ratio versus
time for fs/fLCO=2.98 shown over the full time history. Instantaneous frequency and pitch-heave frequency ratio during (c) recoverable decay and (d) LCO annihilation. . . 103 Figure 4.11 Coupling energy and pitch-heave difference versus time for fs/fLCO=
2.98 for the same trial during(a) recoverable amplitude decay and (b) LCO annihilation. Note,· · ·represent the 95% credible intervals. . . 105 Figure 4.12 Aerodynamic energy and pitch amplitude difference versus time for
LIST OF SYMBOLS
¯
U Mean velocity [m/s]
β fitting parameter for softening pitch stiffness model
U(t) Phase-averaged velocity [m/s]
ε error
ηL,M aerodynamic efficiency in the heave and pitch degrees of freedom, respec-tively
λ eigenvalue
ω Structural natural frequency [Hz]
φθ,h pitch-heave phase difference[◦]
φθp1,θp2 Pitch phase difference between AW-1 and AW-2[
◦]
φh,θp Intra-wing heave-pitch phase difference[
◦]
φh1,h2 Heave phase difference between AW-1 and AW-2[
◦]
ρ freestream air density [kg/m3]
Θ Heaviside function
θ,θA pitch displacement and pitch amplitude, respectively[◦]
θ1,θ2 Heave angle displacement and wing angle relative B-axis, respectively[◦]
θP1,θP2 pitch transition angles[
θp,θp0 pitch angle and pitch amplitude, respectively[
◦]
AR wing aspect ratio
AW−1,AW−2 upstream wing and downstream wing, respectively
b airfoil semi-chord length [m]
c airfoil chord length [m]
C1,C2,C3 fitting parameters for softening pitch stiffness model
ch,cp viscous damping coefficient for heave and pitch, respectively [kg/s]
CM,CM lift and pitching moment coefficients, respectively
D bluff body characteristic length (short side) [m]
EL aerodynamic energy into the structure from the aerodynamic force [J]
EM aerodynamic energy into the structure from the aerodynamic moment [J]
Ex
θ,θ coupling energy into the heave degree of freedom [J]
Exθ,h coupling energy into the heave degree of freedom [J]
f frequency [Hz]
Ff force due to kinetic friction in the heave degree of freedom (DOF) [N]
fh,LCO,fθ,LCO heave and pitch limit cycle oscillation frequency, respectively [Hz]
fLCO fundamental frequency of limit cycle oscillation [Hz]
fshed bluff body shedding frequency [Hz]
h heave displacement[m]
h0,hA heave amplitude[m]
Iθ pitching inertia about elastic axis [kg m2]
Kh effective heave stiffness [N/m]
KθA,KθB,KθC effective pitch stiffness for linear, hardening, and softening regimes, respec-tively [Nm/rad]
KE kinetic energy [J]
Mf moment due to kinetic friction in the pitch DOF [Nm]
Mk
θ restoring moment due to structural pitch stiffness
mw,mtotal wing mass (rotating components), and total mass (all moving components), respectively [kg]
P power [W]
PL aerodynamic power into the structure from the aerodynamic force [J]
PM aerodynamic power into the structure from the aerodynamic moment [J]
q parameter set
S wing span [m]
T oscillation period [s]
t time [s]
U potential energy [J]
u0(t) Turbulent velocity[m/s]
U∞ freestream wind speed [m/s]
Uc Convective velocity[m/s]
Xb streamwise distance between bluff body trailing edge (TE) and wing leading edge (LE) [m]
xp non-dimensional pitching axis location (chord length fraction from LE)
Chapter
1
Introduction to wing wake interactions
This dissertation investigates how incident vorticity affects the flow energy transfer to an
aeroe-lastic wing with boundary layer separation. An oscillating wing or a bluff body are used to
generate vorticity impinging on a downstream aeroelastic wing. A brief introduction to
aeroe-lasticity and nonlinear aeroelastic studies will prepare the reader for the phenomena discussed
in this dissertation.
1.1
Aeroelastic Behavior of a Wing or Airfoil
Aeroelastic structures are systems who response is governed by coupled structural, inertial, and
fluid dynamic forces [8] and have been studied for more than 80 years. Theodorsen [99] was a
pioneer of early aeroelastic research and developed some of the theoretical foundation required
for aeroelastic analysis. Theodorsen’s analysis was concerned with developing stability criteria
for airplanes to avoid flutter. Flutter is a dynamic instability of an elastic body, usually a wing,
in a fluid stream [8]. At a certain fluid velocity, the system damping goes to zero, the system
loses stability, and the structure begins to oscillate. The flutter instability and the oscillatory
Figure 1.1Typical aeroelastic section
canonical aeroelastic section is shown in Figure 1.1. Typical aeroelastic analysis focuses on
an elastically restrained airfoil in heave (y-direction) and pitch (θ) degrees of freedom, while
the elastic axis, pointP, is rigidly constrained in thex−direction. Additionally, the center of mass of the wing, pointC, can be located at different point along the chord line fromP. The heave motion of the wing is coupled to the pitching motion and vice versa when pointsPand C are not collocated. The placement of ofPandCrelative to each other and Prelative to the wing aerodynamic center are important design parameters for the aeroelastician and influence
the linear stability of the system. Additional parameters that affect the linear stability are the
system damping, the heave and pitch natural frequencies and how close those frequencies are
to each other. While aeroelastic stability is an important design parameter, modern aeroelastic
research has focused on understanding the fluid structure interaction once the system loses
The post-flutter response is concerned with studying the nonlinear limit-cycle response of
the system. Limit-cycles are bounded oscillations in nonlinear systems on an isolated trajectory
[96]. Depending on their amplitude and frequency, these limit cycles can range from mild
sustained oscillations that can be exploited in aeroelastic energy harvesting devices [14] to
dangerous oscillations that can cause structural fatigue failures in aircraft. Additionally,
limit-cycles can exist above and below the flutter speed and their existence is dependent upon the
nature of the bifurcation. In a subcritical hopf-bifurcation, a stable limit-cycle exists around a
fixed point [96], or equilibrium. If an aeroelastic system has a subcritical hopf-bifurcation, the
wing can grow to a limit-cycle if, when given a perturbation, that perturbation exceeds a certain
threshold [96, 22, 92, 34, 91]. Subcritical hopf-bifurcations result in limit cycle oscillations
(LCO) below the flutter speed. Additionally, a supercritical hopf-bifurcation can exist after
the flutter speed. The supercritical hopf-bifurcation is characterized by the fixed point losing
stability[46, 47, 55, 80]. Once in a LCO, the type of structural and aerodynamic nonlinearities
present influences the amplitude, frequency, and phase kinematics.
1.2
Research Aims
Aeroelastic wing-wake interactions result in a plethora of aeroelastic responses due to the
vari-ation in freestream disturbances, nonlinear aerodynamic effects, and structural properties. How
each of these characteristics influence the overall aeroelastic response requires further
investi-gation and will be the focus of this dissertation. This dissertation is composed of experimental
investigations to understand the underlying physics of aeroelastic wing-wake interactions and
the development of an algorithm to compute the aerodynamic loads during wing limit cycle
oscillations. The first study investigates tandem aeroelastic wing interactions, specifically
study develops an aeroelastic inverse technique to estimate the aerodynamic loads during limit
cycle oscillations. Finally, the third study applies the aeroelastic inverse method to investigate
Chapter
2
Experimental Investigation of Wake-Induced
Aeroelastic Limit Cycle Oscillations in
Tandem Wings
2.1
Introduction
This work is published in Journal of Fluids and Structures 2018
https://doi.org/10.1016/j.jfluidstructs.2018.04.015
Wing-wake interactions have been a topic of considerable interest recently due to the
com-plex interactions between wings and incident vorticity. Common examples of wing wake
in-teractions occur in insect flight, such as the dragon fly, fish swimming with tail and dorsal fin
interaction, and energy harvesting applications. Interactions in each of these applications are
determined by the shed vorticity from an upstream oscillating wing. The ability of the
research primarily focused on thrust producing mechanism, however the study presented here
examines drag producing/energy harvesting mechanisms.
Numerous researchers investigated tandem wing-wake interactions in thrust generating
systems including pure pitch oscillations[2, 9], pure plunge oscillations[28, 29, 68, 26], and
combined pitch plunge motions (Akhtar et al., 2007 [12, 51, 86, 88]). For example, Gong et
al.[28, 29] (2015, 2016) investigated tandem heaving wings, finding peak lift enhancement
when a leading edge vortex (LEV) from the upstream wing interacts with an LEV on the
downstream wing that has opposite rotation. For background information on LEVs, the reader
is referred to [58, 59, 16, 25, 24, 62, 102, 17, 6, 19, 65, 66, 67, 63, 93, 49]. Broering et al.
(2012) investigated combined pitching and plunging kinematics and found complex tradeoffs
between LEV enhancement and destruction on total thrust and efficiency. LEV enhancement on
the downstream wing resulted in a higher thrust, whereas LEV muddling resulted in higher
re-sultant efficiencies. Their findings provided evidence that insects change their inter-wing phase
difference depending on their operating flight regime. Each of the studies cited demonstrated
strong dependence of the system thrust and efficiency on the wing spacing and inter-wing phase
difference. This dependence occurs because the wing spacing and inter-wing phase difference
dictate the timing of when shed vortex interacts with the downstream wing, thus affecting the
aerodynamic state of the downstream wing.
While there have been numerous studies on tandem thrust producing oscillating wing wake
interactions, few have investigated tandem wings as related to energy harvesting or aeroelastic
limit cycle oscillations (LCO). Kinsey and Dumas [41] and Xu et al. [103] numerically
inves-tigated tandem oscillating wings undergoing prescribed, energy-extracting motions. Their
re-search focused on the effects of spacing, oscillation frequency, and inter-wing phase difference
on energy harvesting efficiency and aerodynamic power. Their results showed that a tandem
yielded nearly double the energy harvesting efficiency of a single wing operating in freestream.
The separation distance is significantly different than traditional horizontal axis wind turbines
which can require separation distances on the order of 25 rotor diameters to avoid deleterious
interactions (Du Pont and Cagan [23]). Kinsey and Dumas [41] and Xu et al. [103] also found
that the LEV shed by an upstream wing undergoing prescribed motion provided a vortex energy
transfer mechanism, which can enhance or disrupt the LEV on a downstream wing. However,
in a low aspect ratio highly tapered (backwards delta) aeroelastic wing, McCarthy et al. [57]
found that a horseshoe cone vortex structure affected the downstream wing rather than a LEV.
Bryant et al. [13] experimentally demonstrated that aeroelastic energy harvesters in tandem can
produce more power together than if they were oscillating separately. The driving mechanism
is this study was found from the flow deflection changes caused by the upstream wing and
not shed LEVs. Therefore, several aerodynamic mechanisms exist that can induce a range of
different aeroelastic LCOs in downstream devices.
The above literature in tandem wing aeroelastic energy harvesting systems investigated
how spatial arrangement of aeroelastic devices change the wake energy transfer to a
down-stream wing. Additionally, prior studies have posited that for enhanced LCOs in downdown-stream
aeroelastic wings, the devices should have near identical aeroelastic behavior. However, few
re-searchers have investigated how other structural parameters govern the aerodynamic coupling
between the two devices and the wake energy transfer to the downstream wing. In this paper,
we hypothesize that the pitch stiffness of the downstream wing plays an important role in the
tandem wing response and can tune the energy transfer to the downstream wing. This
hypothe-sis will be tested in wind tunnel experiments to determine how structural parameters govern the
aerodynamic coupling between the shed wake and the downstream wing by varying the pitch
wing. The study is divided into three different focuses to analyze this hypothesis: aeroelastic
stability, wake characterization, and LCO behavior.
Aeroelastic stability experiments are performed to characterize the pre-flutter behavior of
each device as well as the relationship between pitch stiffness and flutter wind speed.
Aeroelas-tic stability is tested for the tandem wing case as well to determine the instability mechanisms
and transient response characteristic. Wake characterizations of single wing devices with
sim-ilar pitch stiffness are conducted to determine the frequency content of the single wing wake
as well as the type of wake structure present. The wake behind the downstream wing is also
characterized in tandem configuration to determine how wake frequency content compares to
single wing LCO wake. Additionally, steady state LCO behavior for both individual wing cases
2.2
Experimental Methods
2.2.1
Experimental Apparatus
A pair of compound double pendulum aeroelastic apparatuses that rotate in heave (h(t)) and pitch (θp (t)) degrees of freedom (Figure 1) are used to study tandem aeroelastic wing-wake interaction phenomena. A small surge velocity component is present due to the rotational heave
degree of freedom kinematics considered. The two devices are referred to as aeroelastic wing
one (AW-1) and aeroelastic wing two (AW-2), AW-1 is the upstream device in tandem
config-uration.
Both devices are constructed to have similar geometric and structural parameters including
matched dimensions, center of gravity locations, wing masses, and wing pivot locations. Small
differences arise from the amount of dissipative forces acting on each degree of freedom. The
wing is a standard NACA 0012 airfoil profile across the entire span, s, with chord, c, equal to
0.1m, and span equal to 0.3m, giving a wing aspect ratio of 3. The wing is constructed from
3D printed plastic that has spanwise steel rods inside to move the center of gravity aft of the
pivot the location. The wing pivot location is one-third chord length behind the leading edge of
the airfoil, the wing mass, heave, and pitch inertia are 0.13 kg, 0.01 kgm2, and 0.00013 kgm2,
see Kirschmeier et al. [43] for other wing details. The pitch degree of freedom is passively
controlled through linear extension springs that are attached a distance 12.7mm away from
the pivot axis to create a restoring moment. The heave degree of freedom also uses linear
extension springs attached a distance 35mm away from the pivot location to create a heave
restoring moment. The wing is mounted between two parallel aluminum arms that extend from
the heave pivot rod out a distance of 200mm. The inertia of the heave degree of freedom, and
consequently the natural frequency, can be modified by varying the lengths of the aluminum
arms. The heave pivot rod extends the full span of the wind tunnel, with the bottom of the
rod attached to the heave springs and the top portion being free to rotate but supported by ball
bearings. A US Digital E6 3600 optical encoder with 0.11 degree uncertainty connected to
the upper portion of heave pivot rod monitors the heave rotation. Another US Digital E6 3600
encoder is mounted beneath the lower wing assembly and records the relative angle between
heave and pitch motions with 0.16 degree uncertainty.
The geometrically nonlinear stiffness characteristics of each degree of freedom in the
sys-tem were measured over a range of deflections. The structural dynamics, derived in Kirschmeier
et al. [43], show nonlinear coupling between the heave and pitch motions. The heave springs
non-linearity (Figure 2a). The pitch springs show a linear response for+−35◦deflections, (Figure
2b).
Figure 2.2Restoring moment in heave (a) and pitch (b) degrees of freedom, theory from Kirschmeier et al. [43].
Aeroelastic experiments were performed in the NCSU closed return subsonic wind tunnel
with a 0.81x1.14x1.17m3test section and maximum wind speed around 40m/s. The operating free stream velocity varied from 6m/s to 7.5m/s for LCO experiments, and 3 m/s to 10 m/s for modal frequency characterizations. The chord based Reynolds number for LCO tests was
40,000.
A Dantec miniature-wire straight CTA probe connected to a Dantec MiniCTA unit
mea-sured the velocity profile downstream of the mid-span of the oscillating wings to capture the
dominant dynamics in the wake (Parker et al. [71]). For single wing tests of AW-1, the hot-wire
probe was placed 0.52 and 2.12 chord lengths downstream of the trailing edge. For single wing
of the trailing edge of AW-2. The probe traversed a distance of 4 chord lengths across the flow
(y-direction) with a 0.16 chord step size for single wing testing, while for tandem
configura-tions, the traversed distance was 5 chord lengths across the flow with a 0.22 chord step size. A
Velmex Unislide series B6000 stepper motor with 0.00635mm resolution controlled the
posi-tion of the probe. Figure 3 shows the experimental setup installed in the wind tunnel for tandem
testing.
Figure 2.3(a) Schematic of tandem wing wind tunnel tests (b) Experiment in wind tunnel with hot-wire probe.
2.2.2
Data Acquisition and Reduction
Hot-wire anemometer voltage and encoder signal measurements were taken simultaneously for
one minute at each y/c measurement location. A National Instruments PXIe 6363 card recorded
data at a rate of 5kHz. A Keysight 335000 waveform function generator triggered the data
col-lection. The LCO oscillation frequency for both wings was nominally 5Hz, this resulted in
each cycle resulted from the 5kHz sampling rate, proving useful for phase-averaging. Cross
correlation techniques calculated vortex convection speeds (Uc) as well as intra pitch-heave (φh,θp), inter-wing heave-heave (φh1,h2), and pitch-pitch phase differences (φθp1,θp2). The
coor-dinate system used in Figure 4.1 is used to define the intra and inter-wing phase differences.
The phase-averaging technique decomposed the velocity signal into three different
compo-nents: mean ( ¯U), phase-averaged (<U(t)>), and turbulent velocity components (u0(t)) (Hus-sain and Reynolds [36]) (Figure 2.4(a)). The phase-averaged component required averaging
the measured velocity at a given cycle fraction across all oscillation cycles. The encoder signal
defined peak-to-peak oscillation cycles. The phase-averaged velocity error converged to 1e-3
for each y/c probe location in under 240 cycles, therefore the one minute recording time is sufficient to reconstruct the velocity information.
2.3
Results and Discussion
2.3.1
Aeroelastic Response of a Single Wing
2.3.1.1 Modal Frequency Behavior
Aeroelastic stability experiments determined the modal frequencies as functions of wind speed
for each of the devices in freestream flow. These single-wing results highlight effects from
in-cident wind speed and allow for isolating differences when in tandem configuration. In each
test, the wing was deflected in the heave degree of freedom toh/c= 0.2 and consequently in the pitch degree of freedom toθp= 6 deg, and then released. The frequencies of the resulting oscillations were recorded and segregated into heave and pitch degrees of freedom. From these
experiments, both AW-1 and AW-2 were found to exhibit a modal convergence type response
with increasing wind speed (Figure 2.5(a,b)). It should be noted that no self-excited oscillations
were observed in this velocity range, rather the initial perturbations described above were
re-quired to initiate LCO at the point of modal convergence. Therefore, the wing response to these
perturbations is characteristic of a sub-critical Hopf bifurcation. We also note that even for the
case of equal pitch stiffness, AW-1 and AW-2 had slightly different flutter wind speeds due to
differences in damping and wind-off heave natural frequency. Other pitch stiffnesses tested on
the downstream wing wereKp= 0.046 Nm/rad and 0.03 Nm/rad. Figure 2.5(b) shows that, as expected, the flutter speed increased with reducing pitch stiffness because the zero-wind speed
modal frequencies are spaced further apart. The error bars in the plot represent the modal
fre-quency resolution. The resolution improves with flow speed because as wind speed increases
the modal damping decreases, and therefore the number of oscillation cycles and consequently
Figure 2.5Aeroelastic modal frequency responses in freestream for (a) AW-1 and (b) AW-2 with various pitch stiffnesses.
2.3.1.2 AW-1 Limit Cycle behavior forKp=0.09Nm/rad
The limit cycle behavior of the individual wings was studied to explore how LCO
characteris-tics evolved with incident wind speed. The resulting limit cycle of AW-1 is consistent during the
entire test, as shown in Figure 2.6. The resultant LCO produced large displacements well above
static stall angles (Table 2.1) thus providing initial indications that nonlinear aerodynamic
phe-nomena are present. h0 andθp0 refer to the heave and pitch oscillation amplitude where f is the oscillation frequency. Heave displacements do not extend in the nonlinear restoring force
range (Figure 2.2) therefore nonlinear pitching moment and aerodynamic phenomena must be
affecting the wing for limit cycles to be present. The limit cycle shows small increases in heave
amplitude while the pitch amplitude and intra-wing pitch heave phase difference remain
con-stant within the wind speed range tested. These indicate that the shape of the limit cycle is
Table 2.1Limit cycle oscillation characteristics for AW-1.
U∞[m/s] h0/c θp0 φh,θp f c/U∞
6.21 0.26±0.01 42.67±2.59 -165.40±0.78 0.08
6.51 0.29±0.02 42.58±1.59 -165.42±0.27 0.08
Figure 2.6Phase planes of AW-1 LCO at (a)U∞= 6.21 m/s and (b)U∞= 6.51 m/s. Shaded area
represents limit cycle orbits plotted over entire testing period and black dashed line is the phase-averaged heave and pitch cycle.
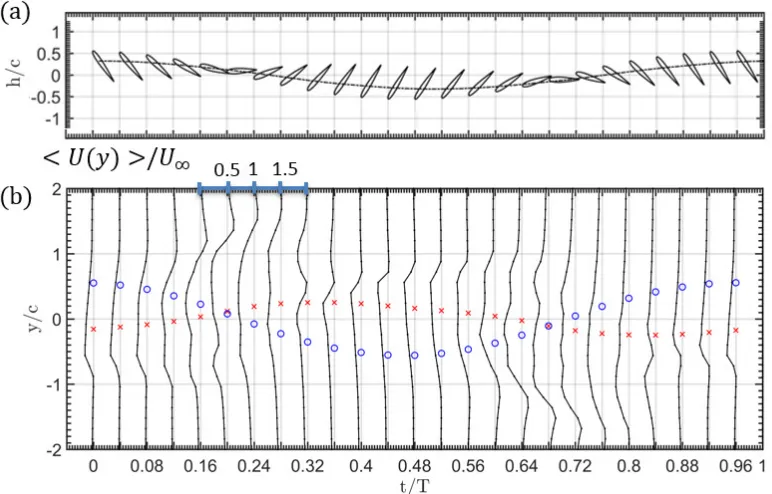
The hot-wire anemometer was traversed 0.52cdownstream of the oscillating wing allowing for insight into the type of wake structure shed from the wing, as well as the flow over the
wing. The phase-averaged velocity profiles, Figure 2.7, depict two characteristic velocity deficit
regions occurring aroundt/T = 0.2 and 0.7. These regions are indicative of a vortex structure being convected past the anemometer probe. Vortex rotation direction can be inferred from the
and Pollard [98]). Since only a single direction velocity probe is used; true calculations of
vorticity are not possible, and only directional information can be determined. In Figure 2.7(b)
a vortex with sign ˘k, as defined by Figure 4.1(a), is seen neart/T = 0.2, whereas as vortex with sign +k is seen neart/T = 0.7. The wake pattern corresponds to a drag-producing wake, as expected for a passively controlled oscillating wing in free stream flow. The vortex structures
att/T = 0.2 and 0.7 are derived from large leading edge vorticity, which can be determined by examining the instantaneous wing position (Figure 2.7a) accounting for convective speed.
Therefore, LEV’s provide nonlinear aerodynamic phenomena to help facilitate the limit cycle
oscillation.
Figure 2.7(a) Instantaneous wing position and trace of instantaneous wing pivot location. (b)Scaled phase-averaged velocity profile 0.52c downstream of trailing edge of wing. x’s represent instantaneous trailing edge position while o’s represent instantaneous leading edge position.U∞=6.21 m/s for both (a)
Analysis of the spatially distributed frequency content of the phase-averaged velocity
re-veals two characteristic regions, an inner wake region under the influence of the shed vortices,
and an outer wake region under the effect of either a single vortex structure or air deflected by
the wing. The inner wake dominant frequency is a harmonic of the oscillation frequency and
can clearly be seen by the spike at 2fLCO. As noted in Jung and Park ([37]) the x-component of the hot-wire velocity produces a frequency doubling effect for wake vortices. Therefore,
the wake vortex forcing frequency is equivalent to 1fLCO. Wake frequency content is also dis-tributed to higher harmonics with significant frequency content decaying by 10fLCO. Young and Lai [105, 104] demonstrated that as oscillation amplitude grew larger the frequency content of
the wake dropped to match the oscillation frequency of the wing. This is because significant
separation occurred over the wing and leading edge vortices were produced. Therefore, the
wake frequency content predicts vortex structure growth and separation over the wing.
The inner and outer wake regions change width with increasing wind speed respectively
due to the larger swept area of the wing oscillation at higher wind speed. The wake width
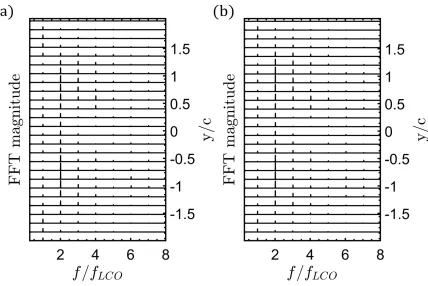
Figure 2.8Spatially distributed frequency content of<U(t)> /U∞at (a)U∞=6.21 m/s and (b) U∞=6.51 m/s. The hot-wire probe is located 0.52c downstream of trailing edge for both (a) and (b).
Periodic vortex shedding from the heave pivot rod exists for all wind speeds tested.
Mea-surements of the pivot rod wake were conducted with the hot-wire anemometer. MeaMea-surements
were taken at x/d = 22, which would correspond to the 10mm behind the wing leading edge if the wing was present. The measured shedding frequency was 35fLCO with a wake width of +−0.5c. The measured centerline velocity is 0.8U∞. This indicates that the wing oscil-lates through a shear flow during LCO. However, during wing LCO, spectral analysis of the
LCO, such that the wing either destroys or significantly disperses the vortices such that the
overall wake flow is not appreciably affected. Additionally, measurements were taken of the
single wing wake with the downstream rod present to determine what effect, if any, there was
on the measured wake response due to the downstream rod. As shown in Figure 2.9, the phase
averaged velocity profilesx/c=1.9 downstream do not appreciably change with the presence of the rod downstream nor do the measured wake statistics such as wake width and vortex size.
Thus, vortices forming over the wing dominate the response.
Figure 2.9Phase-averaged velocity downstream of AW-1 with and without the pivot rod for AW-2 present.
2.3.1.3 Convective Time Scales and Vortex Size
Wake vortex convection speed fundamentally influences the wing-wake interaction and the
response of a downstream wing. Vortex structure convective speed is calculated by cross
corre-lating the velocity signal measured at two streamwise probe positions. Convective speeds were
mea-sured 0.52cand 2.12cdownstream of the oscillating AW-1. Representative phased-average ve-locity signals fory/c=0.48 are plotted in Figure 2.10(a), and demonstrate a time shift between signals of 0.05s. Convective velocity was calculated using this time shift and the distance
be-tween the two sample locations (Figure 2.10b) which is equivalent to 0.5U∞fory/c= +−0.5c. Carr et al. [16] found the vortex convection speed in two-dimensional pitching wings
signifi-cantly differs from free stream velocity, with estimated convection speeds around 0.4U∞. Park et al. [70] investigated vortex convection speeds for a lightly stalled two-dimensional
oscillat-ing woscillat-ing, discoveroscillat-ing vortex wake convection speed was a constant 0.6U∞. Conversely, Rival et al. [87] showed that LEV convection speed asymptotically approached free stream velocity
as the vortex convected downstream. From Rival et al.’s [87] experiments, the vortex
con-vection speed for similar streamwise locations is around 0.5U∞, therefore measurements are comparable with their previous two-dimensional experimental counterparts. Vortex convection
speeds calculated from the phase-averaged and turbulent velocity signals begin to differ as the
measurement locations move further away fromy/c=0. Differences occur because the phase-averaged velocity is sensitive to the transition between inner and outer wake regions causing
inaccurate measurements of convective speeds. Convective speeds will be used to analyze
Figure 2.10(a) Time history of phase-average velocity for two streamwise locations x/c = 0.52 and 2.12. (b) Calculated convective speeds from both phased-averaged and turbulent velocity signals.U∞=
6.21 m/s for both (a) and (b).
Estimates of mid-plane vortex size are also possible from the turbulent hot-wire signal.
Autocorrelation performed on the turbulent velocity signal finds the typical time required for
the energy containing eddies (Bradshaw [11]) to traverse past the hot wire probe at a single
streamwise location. A time scale is calculated for each oscillation cycle, then averaged over
the entire measurement time for an estimate of the mid-plane vortex size time scale at each
y/clocation. Measurements from the inner region of the wake are averaged together to find an estimated time scale of the vortex. Mid-plane vortex structure size is estimated as the product
of the vortex size time scale and convective speed, which results in a length scale of 0.9c.
2.3.1.4 AW-2 LCO characteristics forKp=0.09Nm/rad
AW-2 withKp=0.09Nm/radwas tested in similar fashion to AW-1 to quantify its freestream LCO behavior and wake characteristics. The LCO results provide a baseline for comparing the
of AW-1 but with slightly higher oscillation amplitudes, due to the higher operating flow speed
range. Non-dimensional frequencies and intra-wing phase differences are similar between
AW-2 and AW-1; therefore, similar vortex formation can be expected over the wing. In this case, a
combination of nonlinear restoring forces and nonlinear aerodynamics dictate the response.
Figure 2.11Phase planes of AW-2 LCO at (a)U∞= 7.04 m/s and (b)U∞= 7.30 m/s. Shaded area represents limit cycle orbits plotted over the entire testing period and black dashed line is the
phase-averaged heave and pitch cycle.
Similar to AW-1, the passing of two large-scale vortex wakes affect the phase-averaged
velocity profile (Figure 2.12). These vortices form from the leading edge of the wing and
convect downstream past the anemometer probe, with vortex events occurring around t/T = 0.2 and 0.7. Despite AW-2 having a higher flutter wind speed and kinematic displacement, the
overall shape and structure of the wake is similar to that of AW-1, thus they are influenced by
Figure 2.12(a) Instantaneous wing position and trace of instantaneous wing pivot location. (b)Scaled phase-averaged velocity profile 0.89c downstream of trailing edge of wing. x’s represent instantaneous trailing edge position while o’s represent instantaneous leading edge position.U∞=7.04 m/s for both (a)
and (b).
The frequency content of the wake shows a similar trend to that of AW-1 with an inner
wake region dominated by the 2fLCO wake vortices and an outer wake region at 1fLCO. The inner wake region width is greater for AW-2 due to the larger swept area of the wing, and owing
to the measurement location further downstream of the wing. This wake region is similar to that
Figure 2.13Spatially distributed frequency content of<U(t)> /U∞at (a)U∞=7.04 m/s and (b) U∞=7.30 m/s. The hot-wire probe is located 0.89c downstream of trailing edge.
Table 2.2Limit cycle oscillation characteristics for AW-1.
U∞[m/s] h0/c θp0 φh,θp f c/U∞
6.21 0.26±0.01 42.67±2.59 -165.40±0.78 0.08
2.3.2
Tandem Wing Aeroelastic Interactions
To investigate the global effect of tandem wing-wake vortex energy transfer, the problem is
broken into two different regimes, flutter characterizations and limit cycle behavior.
Experi-mental flutter characterization and transient response experiments are useful to determine the
forcing mechanism on the downstream wing and how the aeroelastic stability of the
down-stream wing is affected by the wake of the updown-stream wing. Additionally, limit cycle behavior
defines how pitch stiffness affects the energy transfer from the wake to the downstream wing
after steady oscillation is established. In tandem configuration, AW-2’s leading edge is located
179mm downstream of AW-1’s trailing edge.
2.3.2.1 Modal Frequency Behavior and Transient Response
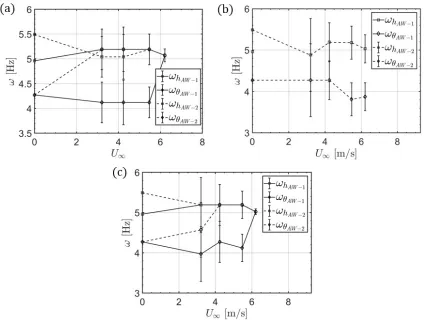
Three different initial conditions were tested to investigate the wake vortices effect on the
sta-bility and response of the downstream wing. The different conditions were: 1) initial heave
deflection applied to the upstream device, 2) initial heave deflection applied to the downstream
device, and 3) initial heave deflection applied to both devices. Figure 2.14 demonstrates that
the choice of initial conditions influences the frequency behavior of the system. In the first set
of initial conditions, when the upstream device only is deflected, the downstream wing exhibits
oscillations in both degrees of freedom near the heave natural frequency of the upstream
de-vice for all nonzero wind speeds. The converged modal frequencies in the downstream wing
demonstrate that the heave motion of the upstream device dictates the motion of AW-2 via its
oscillating wake. In the second set of initial conditions, when the downstream wing only is
ini-tially deflected, the downstream wing modal frequencies are similar to those observed in single
wing experiments, thus negligible upstream aerodynamic coupling exists because no
vortex shedding from the static wing upstream does not induce oscillations in the downstream
wing. The third set of initial conditions shows distinct modes in the downstream wing for the
first nonzero wind speed tested, but then converged modes for all other wind speeds tested, as
the wake from the upstream device dominates the response of AW-2.
Figure 2.14Modal frequencies in tandem wing case for (a) initial deflections applied to AW-1, (b) initial deflections applied to AW-2, and (c) initial deflections applied to both devices. Pitch stiffness on
These results demonstrate that the downstream wing is forced to move due to the unsteady
wake of the oscillating upstream device. Therefore, the stability of the downstream wing is
dependent on the stability of the upstream device, aerodynamically coupling the two devices
in one direction. In the first and third initial condition cases tested, the wake of the upstream
device effectively acts as an external forcing function applied to the downstream wing. Thus,
there exists an inherent frequency-lock between the devices. Notably, although the single wing
tests revealed that the pitch stiffness strongly affected the modal convergence behavior of
AW-2 when operating in freestream, the same trends in Figure AW-2.14 were observed for all pitch
stiffnesses tested.
While the modal convergence plots are useful in determining the frequency content of the
structural motion, the transient response provides insight into the uniqueness of LCOs. The
downstream wing LCO response showed independence to the initial condition, and settled into
the same inter-wing heave-heave phase difference relative to the upstream wing for both case 1
and 3 initial conditions (Figure 2.15(a)). Independence to initial condition indicates that there
exists a unique LCO for the downstream wing when in the unsteady wake of the upstream
wing. The existence of only one limit cycle is shown in Figure 2.15(a) where two distinct
inter wing phase differences are quickly changed within 8 flapping cycles to a phase difference
much closer to the final LCO inter wing phase difference. Additionally, the response time of the
downstream wing changes with pitch stiffness for cases 1 and 3 (Figure 2.15(b)). Lower pitch
stiffness values respond quicker to incident vorticity, while higher pitch stiffnesses respond
more slowly. Under attached flow theory, this has a compounding effect due to the location of
the pivot axis, whereby increases in effective angle of attack increase lift, which tends to rotate
the wing to a larger angle of attack. With higher pitch stiffness, a larger flow angle is required
to deflect the wing, and therefore, in the transient response, a stiffer downstream wing responds
wing pitch stiffness introduces an additional lag in response to incoming vortical wakes and
defines wing susceptibility to vortical disturbances.
Figure 2.15(a) Time traces of heave motion for initial deflection to AW-1 (top row), and initial deflection to AW-1 and AW-2 (bottom row). (b) Pitch response of AW-2 for each pitch stiffness for
similar initial conditions.
2.3.2.2 Tandem LCO Behavior
Steady LCO behavior of the tandem aeroelastic wings was tested for each of the three
down-stream wing pitch stiffnesses to examine pitch stiffness effects on vortex energy transfer. The
wake of the oscillating upstream wing destabilizes the downstream wing in every case tested,
exciting sustained oscillations in the downstream wing even though the wind speed is below
the freestream flutter speed of the downstream wing. However, due to differences in pitch
stiff-ness, the system exhibits either a high vortex energy transfer (HVET) regime resulting in a
large LCO and a high maximum kinetic energy or a low vortex energy transfer (LVET) regime
resulting in significantly smaller LCOs and lower maximum kinetic energy in the structure.
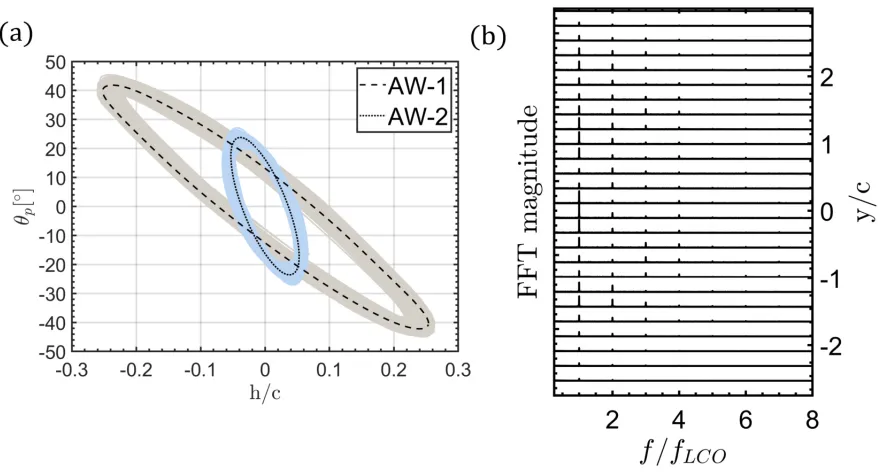
in the downstream wing (Figure 2.16(a)). The resultant heave amplitude is 80% less than the
heave amplitude of the upstream wing forU∞= 6.21m/s and 64% less forU∞= 6.51m/s (Table 2.3-2.6)) demonstrating weak vortex energy transfer. From the previous wake-width estimates,
the upstream wing shed vortex wake fully envelopes the downstream wing oscillation cycle.
The previous vortex size estimates also indicate that during these interactions, the downstream
wing is under the influence of one vortex structure at a given time. In these wind speed ranges,
the intra-wing pitch-heave phase difference in AW-2 shows a change of 12% between single
and tandem wing tests as a result of the incident wake. Inter-wing heave-heave phase difference
shows that the stable LCO for the downstream wing trends towards out of phase motion with
increasing wind speed. During these LVET interactions, there exists little backward
aerody-namic coupling from the downstream device on the upstream device even in LCO conditions.
This is exhibited by the similar LCOs achieved in AW-1 during tandem as compared to single
wing testing. Ristroph et al. [85] postulated that when two flapping flags interact in a
destruc-tive mode, the tandem wake pattern is less structured as compared to the single wing wake.
This can be seen in the spatially distributed frequency plot of the phase-averaged velocity at
U∞= 6.21m/s, which now has dominant frequency components in the 1fLCOrange compared to the single wing frequency plot. The dominant frequency at 1fLCOcharacterizes that the flow downstream of the wing is dominated by the deflection of both of the wings and muddles inner
and outer wake regions defined by the spatially distributed frequency.
Table 2.3LCO amplitude and frequency characteristics of AW-1 and AW-2 in tandem configuration withkpAW−2/kpAW−1 1 pitch configuration atU∞=6.21 m/s.
U∞[m/s] h0/c θp0 f c/U∞
AW-1
6.21
0.25±0.02 41.46±2.81 0.08
Table 2.4LCO phase characteristics of AW-1 and AW-2 in tandem configuration withkpAW−2/kpAW−1 1
pitch configuration atU∞=6.21 m/s.
U∞[m/s] φh,θp φh1,h2[
◦] φ
θp,1,θp,2[
◦]
AW-1
6.21
-163.29±0.58 106.11
±4.46
129.31
±1.37
AW-2 -140.12±5.67
Table 2.5LCO amplitude and frequency characteristics of AW-1 and AW-2 in tandem configuration withkpAW−2/kpAW−1 1 pitch configuration atU∞=6.51 m/s.
U∞[m/s] h0/c θp0 f c/U∞
AW-1 6.51
0.25±0.02 41.22±2.10 0.08
AW-2 0.09±0.01 30.13±1.76
Table 2.6LCO phase characteristics of AW-1 and AW-2 in tandem configuration withkpAW−2/kpAW−1 1
pitch configuration atU∞=6.51 m/s.
U∞[m/s] φh,θp φh1,h2[
◦] φ
θp,1,θp,2[
◦]
AW-1 6.51
-165.01±0.58 119.46
±3.10
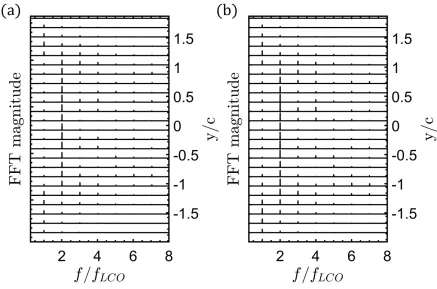
128.21
±0.84
Figure 2.16(a) Phase planes of LCO for AW-1 and AW-2 in tandem configuration withkpAW−2/kpAW−1 1
pitch configuration. (b) Spatially distributed frequency content of U(t)/U∞0.89c downstream of AW-2
forkpAW−2/kpAW−1 1 pitch configuration. (a) and (b) atU∞= 6.21 m/s.
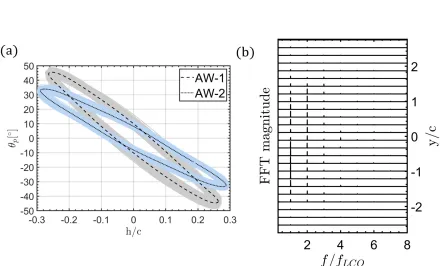
When the downstream wing pitch stiffness is approximately half that of the upstream wing,
a HVET interaction exists for AW-2 and large limit cycle oscillations exist in the downstream
wing for the range of wind speeds tested (Table 2.7-2.10). The resulting AW-2 oscillations are
characterized by having similar heave amplitudes to that of AW-1 (Figure 2.17(a)).
Further-more, intra-wing pitch-heave phase difference in the downstream wing is almost identical to
the intra-wing phase difference on the upstream wing. Pitch amplitude on the downstream wing
is 25% less than that of the upstream wing, indicating that pitch amplitude is not a sufficient
proxy for aerodynamic force; heave structural properties of AW-1 and AW-2 are similar, thus,
amplitude. Varying pitch amplitudes introduces ambiguity into aerodynamic forces because it
presents a departure from classical single wing experimental results of Carr et al. [16].
Table 2.7LCO amplitude and frequency characteristics of AW-1 and AW-2 in tandem configuration withkpAW−2/kpAW−1 0.5 pitch configuration atU∞=6.21 m/s.
U∞[m/s] h0/c θp0 f c/U∞
AW-1 6.21
0.26±0.01 45.34±2.10
0.08
AW-2 0.28±0.02 33.40±1.61
Table 2.8LCO phase characteristics of AW-1 and AW-2 in tandem configuration with
kpAW−2/kpAW−1 0.5 pitch configuration atU∞=6.21 m/s.
U∞[m/s] φh,θp φh1,h2[
◦]
φθp,1,θp,2[
◦]
AW-1 6.21
-167±0.52 45.48
±4.19
46.85
±4.86
AW-2 -166.24±0.77
Table 2.9LCO amplitude and frequency characteristics of AW-1 and AW-2 in tandem configuration withkpAW−2/kpAW−1 0.5 pitch configuration atU∞=6.51 m/s.
U∞[m/s] h0/c θp0 f c/U∞
AW-1 6.51
0.26±0.02 41.22±2.10
0.08
Table 2.10LCO phase characteristics of AW-1 and AW-2 in tandem configuration with
kpAW−2/kpAW−1 0.5 pitch configuration atU∞=6.51 m/s.
U∞[m/s] φh,θp φh1,h2[
◦] φ
θp,1,θp,2[
◦]
AW-1 6.51
-164.74±0.42 85.96±
1.07
82.99
±0.59
AW-2 -167.64±0.71
Figure 2.17(a) Phase planes of LCO for AW-1 and AW-2 in tandem configuration with
kpAW−2/kpAW−1 0.5 pitch configuration. (b) Spatially distributed frequency content of U(t)/U∞0.89c
downstream of AW-2 forkpAW−2/kpAW−1 0.5 pitch configuration. (a) and (b) atU∞= 6.21 m/s.
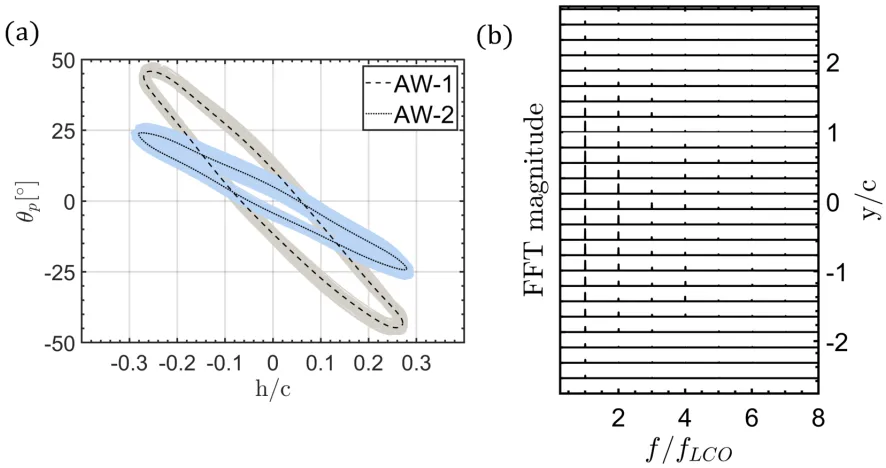
In the case where downstream wing pitch stiffness is roughly one third that of the upstream
am-plitude are achieved over the range of wind speeds test as seen in Figure 2.18(a) and Table
2.11-2.14. Intra-wing phase difference of AW-2 is slightly higher than AW-1, and is closer to
in phase pitch-heave oscillations. The pitch amplitude in the downstream wing is 50% less than
the upstream wing forU∞ = 6.21m/s, a significant departure from the previous HVET oscilla-tion case. Again, the incident vortices must be affecting the flow over the airfoil to generate the
required aerodynamic forces to oscillate the wing with a large heave amplitude.
Table 2.11LCO amplitude and frequency characteristics of AW-1 and AW-2 in tandem configuration withkpAW−2/kpAW−1 0.3 pitch configuration atU∞=6.21 m/s.
U∞[m/s] h0/c θp0 f c/U∞
AW-1 6.21
0.27±0.02 45.74±2.06
0.08
AW-2 0.27±0.02 23.87±1.83
Table 2.12LCO phase characteristics of AW-1 and AW-2 in tandem configuration with
kpAW−2/kpAW−1 0.3 pitch configuration atU∞=6.21 m/s.
U∞[m/s] φh,θp φh1,h2[
◦] φ
θp,1,θp,2[
◦]
AW-1 6.21
-166±0.53 2.91±
2.29
-0.13
±2.62
Table 2.13LCO amplitude and frequency characteristics of AW-1 and AW-2 in tandem configuration withkpAW−2/kpAW−1 0.3 pitch configuration atU∞=6.51 m/s.
U∞[m/s] h0/c θp0 f c/U∞
AW-1 6.51
0.27±0.01 41.57±1.88
0.08
AW-2 0.31±0.02 26.11±1.73
Table 2.14LCO phase characteristics of AW-1 and AW-2 in tandem configuration with
kpAW−2/kpAW−1 0.3 pitch configuration atU∞=6.51 m/s.
U∞[m/s] φh,θp φh1,h2[
◦] φ
θp,1,θp,2[
◦]
AW-1 6.51
-164.97±0.54 61.01±
10.19
52.08
±9.75
Figure 2.18(a) Phase planes of LCO for AW-1 and AW-2 in tandem configuration with
kpAW−2/kpAW−1 0.3 pitch configuration. (b) Spatially distributed frequency content of U(t)/U∞0.89c
downstream of AW-2 forkpAW−2/kpAW−1 0.3 pitch configuration. (a) and (b) atU∞= 6.21 m/s.
Distinct inter-wing phase differences exist for each pitch stiffness combination. It is
ex-pected that a LVET interaction and a HEVT interaction would have disparate inter-wing phase
differences. However, both HVET interaction cases have distinct inter-wing phase difference.
This suggests that inter-wing phase differences are not the only variable in determining the type
of interaction and that structural parameters strongly influence the resultant inter-wing phase
difference. Counterintuitively, while reducing the pitch stiffness of AW-2 makes the device less
susceptible to flutter in freestream as seen in Figure 2.5(b), it makes the device more
suscep-tible to HVET wake-induced oscillations in tandem configuration. This result occurs because