RECOMBINATION AND DNA REPLICATION I N
THE
DROSOPHILA MELANOGASTER OOCYTE1
RHODA F. GRELL
Biology Division, Oak Ridge National Laboratory,
Oak Ridge, Tennessee 37830
Manuscript received August 7, 1972
ABSTRACT
A method is described that permits the recovery of a well-synchronized population of oocytes. Utilizing this pupal system, the heat-responsive period for increasing crossing-over in the Drosophila genome has been defined for the X chromosome and a portion of chromosome 2. The response is initiated close to the time of oocyte formation (premeiotic interphase) and is terminated after -36 hr. During the 36-hr period different regions show characteristic responses, which vary in degree, in duration, and in initiation and termination points, so as to generate the beginning of a thermal recombination map for the Dro- sophila genome. Centromere regions exhibit the greatest increases in crossing- over f o r their respective chromosomes but are distinctly asynchronous in time; interstitial regions respond the least. Correlated autoradiographic studies have localized DNA replication in the oocyte to a -24-hr period, which also begins close to oocyte formation (premeiotic interphase) ; late labeling in restricted regions, undetectable with the present method, could extend the period, as could prolonged synthesis in the oocyte. The results demonstrate that DNA repli- cation and the heat-sensitive period for enhancement of crossing-over are coincident processes over most and possibly all of their length.
H E temporal relationship between DNA replication and exchange in eukary- Totic gametocytes remains unresolved. Traditionally, replication and recombi- nation were considered to be coupled phenomena, both taking place during the pachytene stage of meiosis. Decisive evidence against this hypothesis came from spectrophotometric and autoradiographic studies which showed that the DNA replication in the meiocyte occurred during interphase, sometimes extending into early prophase (SWIFT 1950, TAYLOR 1957). Since then it has been widely assumed that the two events are independent and that exchange pairing of homologs at zygonema is a necessary preliminary to exchange at pachytene. Although exchange pairing is undoubtedly a prerequisite for exchange, the pair- ing requirement is not an insurmountable obstacle to a recoupling of the two processes. In fact, there is considerable evidence to suggest that pairing between homologs may be initiated much earlier, during anaphase o r telophase of the final gonia1 division or during premeiotic interphase (SMITH 1942; CHAUHAN
and ABEL 1968; for discussion see GRELL 1969).
GRELL and CHANDLEY (1965) first attempted to examine the times of exchange
Research sponsored by the U.S. Atomic Energy Commission under conwact with the Union Carbide Corporation.
88 R . F. GRELL
and of DNA replication simultaneously in the meiocyte. Enhancement of cross- ing-over in the Drosophila oocyte by heat was employed as a genetic “marker” for the first event, and incorporation of r3H] thymidine was used as a cytological “marker” for the second. Within the limits of resolution permitted by the method, the two events were found to be close or coincident in time. Subsequent studies effectively eliminated the possibility that heat-induced crossovers were partly or entirely oogonial in origin (GRELL 1966) and the possibility that the labeled oocytes followed cytologically had incorporated their label as oogonia ( CHANDLEY
1966). HENDERSON’S (1966, 1970) suggestion to rule out coincidence on the grounds that a one to two day differential might exist between the cytological endpoint (the labeled mature egg) and the genetic endpoint (the deposited egg) is completely negated by an examination of the number of eggs in passage. Should oviposiiton require one to two days, a typical female laying about 50 eggs per day would be required to carry in her oviducts and uterus 50-100 mature eggs. Dissections disclosed most frequently one and occasionally two eggs in passage. These results verified, then, for both the genetical and cytological studies, that the correct cell had been marked and the proper endpoints had been chosen.
One serious question remained. This was the possibility raised by several authors
(HENDERSON
1966; PEACOCK 1968, 1970;RHOADES
1968), that a 24-hr brooding period might fail to separate two close but nonoverlapping events. TOobtain a more precise resolution of the temperature-sensitive period, the recovery of a well-synchronized population of oocytes was required. A method has now been devised, and is reported here, for accomplishing this end. The “pupal system,” as it is called, involves heat treatment of immature rather than adult females. It permits the recovery of so well-synchronized a population of oocytes that it becomes possible to characterize temporally and quantitatively the specific response of different regions of the genome. The method and some of the results were briefly described in a symposium paper (GRELL 1967). Correlated with the improved genetic technique, a more exact delineation of the time of DNA repli- cation in the oocyte has been achieved by autoradiography of immature ovaries exposed to C3H]thymidine at different times during and after the period recog- nized as heat-sensitive by genetic tests.
The present results fully confirm our previous conclusion. The sensitive period for significantly increasing meiotic crossing-over for most if not all of the genome coincides with a time when DNA replication is occurring in the oocyte. Both processes begin very shortly after oocyte formation. Whether the two periods are completely coextensive has not been determined.
T H E P U P A L SYSTEM
RECOMBINATION A N D REPLICATION IN OOCYTES
6 Hr Egg Laying b y G, ? ?
G z
Development
1
1-
of G 2 H e a t ??I
Larvae
Pupae Treatment
I
Adhts /-
8 Hr Egg Laying by G, ??( First 10 -15 Eggs Per ? )
89
1.
G, Progeny
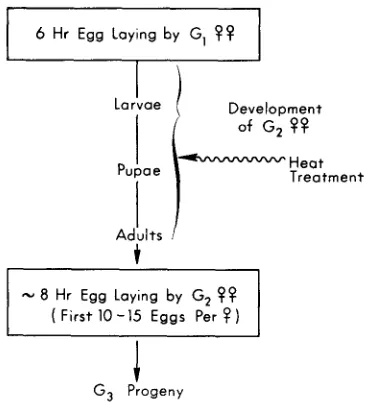
FIGURE 1 .-Outline of “pupal system” for recovering a synchronized oocyte population.
and the responsive period is extended; the greater the variation in age at the time of treatment of the recovered sample, the greater the dilution and extension. The method that has been designed is illustrated in Figure 1.
It
incorporates (1) a restricted egg-laying period for the first-generation females, (2) heat treatment of the immature second-generation females at a time when those germ cells destined to become her first eggs will respond, and (3) a restricted egg-laying period for the newly eclosed second-generation female, so as to limit the number of eggs sampled to -1/2 of her first “set.” (Egg laying is a continuous process, and the term “set” is used here to denote the first -30 eggs to mature, one in each of the -30 egg strings o r ovarioles that make up the two ovaries.) Limi- tation of egg number is of prime importance in achieving the desired synchrony. This method has the great advantage of eliminating dilution of the recovered sample by older but more slowly developing oocytes, since there are no older oocytes, and of reducing dilution by younger but more rapidly developing oocytes through the strict limitation placed on the number of eggs each mother is per- mitted to lay. The result is a well-synchronized population of oocytes, as judged by the criteria of (1 ) a relatively short sensitive period, within which increases occur for all responding regions examined thus far, (2) characteristic maxima and durations of response for different regions during the sensitive period, and( 3 ) reproducibility of both the total and specific responses.
90 R. F. GRELL
_ _ _ _ _ _ _ _ _ _ _ _ _ _ _ _ - _ _ _ _ _ _ _ _
"---]---
I---
4
n r - 0 24 48 72 96 120 144 168 I92 216 240
d o l - 1 ~ 2 u3 u4 5 -6 ~7 8 u9 u u
TIME AFTER EGG LAYING
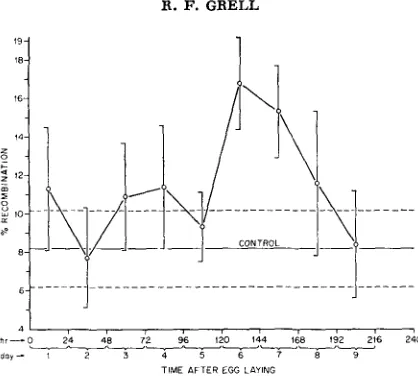
FIGURE 2.-Determination of temperature-sensitive period for crossing-over in oldest oocytes of developing female.
between nub2 (47.0) and
B1
(54.8) on chromosome 2. As shown in Figure 2, a significant increase in crossing-over occurs only with treatment on days 6 and 7, corresponding to 120-168 h r after egg laying. The peak effect is found on day 6 (120-144 hr), corresponding to the very early pupal period. Through the use of briefer treatment periods (12 hr) and the initiation of treatments of different groups of females at 6-hr intervals between 120 and 168 hr, i t became possible to delineate the sensitive period still more sharply. In some experiments, earlier(1 14 h r ) and later (1 74, 180, 186 h r ) initiation points were used.
MATERIALS A N D METHODS
Genetic studies; The effect of heat on crossing-over was studied for the entire X chromosome
and for a portion of chromosome 2. In the case of the X chromosome, females were of the geno- type y 2 sc car
.
y+/y2 cu U f. In this way five regions were marked for study: region 1 (sc, 0.0-cu,13.7), region 2 (cu, 13.7-u, 33.0), region 3 (U, 33.0-f, 56.7), region 4 ( j , 56.7-cur, 62.5), and region 5 (cur, 62.5-scV1,y+, 68.5). The region between cur and the spindle fiber attachment was measured by use of Zn(lLR)scVI, a pencentric inversion of the X that places y+ to the right of the centromere. The left arm of X , which carries a deficiency, was subsequently replaced with a normal X carrying the markers y2 sc and car, so that the chromosome carries a duplication for the y locus.
Following the procedure outlined in Figure 1, 20-30 bottles were prepared, each containing 25 virgin females of the genotype y2 cu U f / y 2 cu u f and 25 males of the genotype y2 sc car
.
y + / Y .These were the first-generation parents. Two days later the flies were transferred to fresh bottles f o r a 6-hr egg-laying period. The egg-laying procedure was repeated with fresh bottles for as many sets of bottles as was convenient to handle in one expenment-usually six or seven sets. One set constituted the control and was kept at 25 f 0.5"C throughout development. The remain- ing sets were subjected to a heat treatment of 35
*
0.5"C for 12 h r a t different times between 114and 186 hr. The initiation point for the first set was 114 hr after egg laying, for the second 120 hr, for the third 1 2 6 hr, etc., up to and including 186 hr. Since the initiation points were 6 h r apart, 13 different time intervals were studied. To obtain sufficiently large numbers of progeny for each time interval it was frequently necessary to repeat an experiment.
R E C O M B I N A T I O N A N D REPLICATION IN OOCYTES 91
Virgin females of the desired genotype (y2 cu u f / y 2 sc car . y+) were collected shortly after eclosion and mated in vials to X Y , y B / Y males (4 9 9 and 6 8 8 per vial). After 24 h r the parents were transferred to bottles for an additional 24 hr and then discarded. Since egg laying begins about 4 0 hr after eclosion, the second-generation females were permitted to lay eggs for -8 hr. The average number of eggs laid per female during the period was 15, equivalent to -% of her first “set” of mature eggs.
The developing third-generation progeny arising from the heat-treated oocytes were kept at 25 -+ 0.5”C until eclosion. Crossing-over was measured among the male progeny. Progeny non- disjunctional for the X’s, identifiable as B+ females and y B males, were also scored.
The genotype of the females used for study of chromosome 2 was nub2 cn en/Bl L. Here four regions were marked f o r study, including proximal region 1 in the left arm of chromosome 2
(nub2, 47.0-B1, 54.8), region 2, which spans the centromere (BZ, 54.8-cn, 57.5), proximal region 3
in the right arm of chromosome 2 (cn, 57.5-en, 62.O), and interstitial region 4 in the right arm of Chromosome 2 (en, 62.0-L, 72.0).
The protocol followed was similar to that used for the X chromosome. The genotypes of the G, females and males were nub2 cn en/SM5, C y and BZ L / S M 5 , C y , respectively. Treatment of the developing second-generation females was given at nine different time intervals, beginning at 120 hr and ending at 168 hr. Upon eclosion, the nub2 cn en/Bl L virgins were selected and mated to nub cn en/SM5, C y males. Crossing-over was scored among the non-Cy female and male progeny.
CytoZogica2 studies: For identification of the sensitive target for the heat treatment it was
necessary to determine the stage the oldest germ cell had reached a t the time of response, since the consequence of the response is scored in the third-generation progeny. Although earlier studies had shown heat-induced exchanges to be meiotic in origin (GRELL 1966), the possibility remained that the response was a delayed one and that sensitivity to heat resided in a preoocytic cell. For identification of the stage of the responding germ cell, nub cn en/SM5, C y females that had been mated to BZ L / S M 5 , C y males were permitted to lay eggs f o r 6 hr. At puparium for- mation (120 hr) and approximately every 6 h r thereafter up to 156 hr, female pupae were dissected, and their ovaries were removed, placed in Drosophila Ringer, stained with 2% orcein in 45% acetic acid, and squashed. The ovaries were examined for the presence and frequencies of single germ cells and two-, four-, and eight-cell oogonial cysts a t the metaphase stage of mitotic division. Division within an oogonial cluster is completely synchronous (KING, RUBINSON, and SMITH 1956), and this synchrony permits identification of cells belonging to the same cyst. The eight-cell cyst at metaphase will, upon completion of the division, give rise to 14 nurse cells and two potential oocytes, only one of which will become the oocyte (GUY~NOT and NAVILLE 1933; KOCH, SMITH and KING 1967). The interval between metaphase and completion of division is very short, so in these studies the appearance of an eight-cell cluster is equated with the appear- ance of the oocyte.
T i m e of D N A replication in the oocyte: For determination of the relation between the time
of DNA synthesis in the first oocyte and the temperature-sensitive period for enhancing crossing- over in that oocyte, autoradiograms of pupal ovaries were prepared. Autoradiographic studies of heat treated and untreated females have shown that the timetable of progression of labeled 16- cell cysts from the anterior region of the germarium to the stage-one egg chamber (i.e. the interval including premeiotic interphase and DNA replication) is unaffected by heat treatment of 24 h r (GRELL and CHANDLEY 1965). This result indicates that heat does not alter the timing of DNA replication in the treated oocyte.
92 R . F. GRELL
saline on a subbed slide, the saline was removed, a drop of Carnoy’s fixative was placed on the tissue, and the slide was transferred to a Coplin jar of Carnoy’s for 20-30 min. The tissue was hydrated by passage through absolute, 95% and 70% alcohol, placed in cold 5% TCA for one hour with intermittent agitation, rinsed three times in cold 70% alcohol, then passed through 70% alcohol at room temperature, 50% alcohol and distilled water. For Feulgen staining, the slide was placed in 1 N HCl 60°C for 60 min and then in Schiff reagent for 2 hr a t room temper- ature. The slides were rinsed in distilled water, taken to a darkroom, there transferred to distilled water at 42”C, dipped in emulsion (Kodak NTB, 0.1% Dreft solution, l : l ) , and set in a rack to
dry for about 30 min. They were then placed in a slide box and sealed with black photographic tape for exposure. After 6 days of exposure, the slides were developed in Kodak D-19 for 3 min, rinsed, and fixed in Kodak acid fixer for 6 min. After treatment with Kodak hypo clearing agent and rinsing, they were dehydrated up through 95% alcohol and counterstained with Fast Green, and the dehydration was continued through 95% alcohol, absolute alcohol, and xylene. The slides were mounted in a drop of Permount.
RESULTS AND ANALYSIS
Cytological Studies
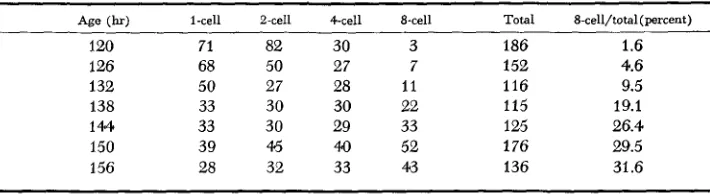
Time of oocyte formation: Table 1 shows the numbers of single germ cells and two-, four-, and eight-cell oogonial cysts at mitotic metaphase in ovaries taken from developing females a t sequential 6-hr intervals beginning at 120 and ending at 156 h r after egg laying. The proportions of the different types of oogonial cysts a t the progressively later times are illustrated in Figure 3. Eight-cell oogonial cysts are first found in very low frequency at -120 hr. They increase in number and in proportion up to 144 hr, at which time the four types are present i n approximately equal frequencies. Between 144 and 150 h r the eight-cell cysts reach a steady-state population and are the most frequent type found. Thus the oocyte, which we here equate with the eight-cell cyst, begins to appear in sizable numbers between 126 and 132 hr. By 138 h r some ovarioles contain several 16-cell cysts. The fraction that makes up -1/2 of the first “set” of oocytes and corresponds to the group of eggs sampled in the genetic studies is probably pro- duced by 132
hr.
These results are in good agreement with the timing reported by BUCHER (1957), who found that the eight-cell cyst first appeared at 129 hr. A t that time she reported that they constituted -20% of the total number oftwo-, four-, and eight-cell cysts, suggesting that had larger numbers been studied
TABLE 1
Numbers of one-, two-, four-, and eight-cell oogonial cysts at mitotic metaphase in
ovaries taken from females between 120 and 156 hr
Age (W I-cell %cell 4-cell 8-cell Total 8-cell/total (percent)
120 71 82 30 3 186 1.6
126 68 50 27 7 152 4.6
132 50 27 28 11 116 9.5
138 33 30 30 22 115 19.1
1 4 4 33 30 29 33 125 26.4
150 39 45 4.0 52 176 29.5
RECOMBINATION A N D REPLICATION IN OOCYTES 93
50
2 4 0 0
UJ
J
W U
F
J 30
z m
c
10W
(3
0
1 io 18 l i 2 138 144 156
TIME AFTER EGG LAYING (hr)
FIGURE 3.-Frequencies of one-, two-, four-, and eight-cell oogonial cysts at metaphase in ovaries taken from developing females at ages between 120 and 156 hr.
their initial appearance might have been detected slightly earlier. I t may be concluded that oocyte formation begins between 120 and 126 hr.
Time of D N A replication: The ovary of an adult female consists of a n anterior germarium and a posterior vitellarium. The stem cells, oogonia, and early oocyte stages (including the stage-one egg chamber) are found approximately in the order given from the anterior to the posterior region of the germarium; later egg chambers between stages-two and fourteen (the mature egg) lie the vitellarium. The first stage-one egg chamber is formed in the pupa between 162 and 168 hr, so ovaries taken from pupae before this time contain no vitellarium and the germarial cysts have not yet formed a stage-one chamber. Again, these results are in good agreement with those of BUCHER (1957), who reported that the stage-one chamber is formed at 168 hr.
Differentiation of the -15 ovarioles comprising each ovary is a well-synchro- nized process. The synchrony is evident in Figure 4, as judged by the similarity in size and structure of the ovarioles within single ovaries taken from pupal females between 132 and 168 hr. Thus the first 16-cell cysts, containing the first oocytes, are formed in the -15 ovarioles of a n ovary at approximately the same time and mature at about the same rate. The cysts move posteriorly as they mature, so the oldest 16-cell cyst is found in the most posterior region of the germarium.
The presence of label in the most posterior 16-cell cyst of an ovariable indicates that DNA replication was occurring in the oldest oocyte at the exposure to
C3H]
94 R . F. GRELL
I ~ I G ~ : R I : ~I..--hi~tnradio~n~,tis sliowinfi Inheling in thr posterior 16-cell cysts of the ovarioles in ovaries taken frnm pupae i32-lG8 Iir alter egg laying. DC = hasal cells: DS = hasnl stalk; PCL =
R E C O M B I N A T I O N A N D REPLICATION IN OOCYTES 95
TABLE 2
Frequency of labeling in posierior cyst of ovarioles with increasing age
Set 1 set 2
Slides L Slides L
Age (hr) inspected L* U' Total (percent) inspeaed L* U* Total (percent) 132 14 214 108 322 66.5 r4 2.6 8 84 55 139 60.4 f 4.1 138 11 154 82 236 65.3 +- 3.1 11 147 48 195 75.1 k 3.1 144 26 436 166 602 72.4 +- 1.8 26 334 234 568 58.8 f 2.1 150 12 154 50 204 75.5 t 3.0 14 131 60 191 68.6 C 3.4 156 4 85 4-9 134 63.4 +- 4.2 13 211 135 346 61.0 C 2.6 1 62 5 30(63+) 85 178 16.9(35.+)
168 7 141$ 14 155 90.3$
* L, number of labeled cysts; U, number of unlabeled cysts.
+
Indicates label restricted to several centers in posterior region of cyst.$ Nurse cells only.
Figure 4c is an autoradiogram of part of a 138-hr ovary, showing the growth and posterior differentiation that has occurred between 132 and 138 hr. Label is seen in the posterior 16-cell cyst of each ovariole. At 144 hr (Figure 4d), 150 hr (Figure 4e), and 156 hr (Figure 4f) label is present in most of the posterior cysts of each ovariole. By 162 hr (Figure 4g), when label is present in the posterior cyst it is generally confined to the most posterior region, where the oocyte lies. This may represent replication continuing in the oocyte after its cessation in the nurse cells, but identification of the oocyte at this time is uncertain. The premise
of extended synthesis in the oocyte finds some support in our earlier observation that egg chambers with a labeled karyosome and unlabeled nurse cells were occasionally seen ( GRELL and CHANDLEY 1965). By 168 hr (Figure 4h) the stage- one and some stage-two egg chambers have been formed and a second round of
replication, which is restricted to the nurse cells, is underway. The most posterior region of the stage-two chamber, occupied by the oocyte, is now seen to be devoid of label, and in several ovarioles replication is occurring in the penultimate 16- cell cyst as well as in some 16-cell cysts in the anterior region of the germarium.
Table 2 gives the numbers of labeled and unlabeled 16-cell cysts in the most posterior position in each ovariole in ovaries taken from pupae between 132 and 162 hr. Scoring was carried out independently by two individuals. The frequen- cies of labeled posterior cysts in the two sets (Table 2, columns 6 and 11) are not statistically different except for the 144-hr sample. The results indicate that the majority of the ultimate 16-cell cysts undergo replication between 132 and 156 hr
lines of eight ovarioles and positions of labeled 16-cell cysts. (c) 138-hr ovary showing three ovarioles with posterior 16-cell cysts labeled. (d) 144-hr ovary showing seven ovarioles with posterior 16-cell cysts labeled. (e) 150-hr ovary with label in many posterior cysts. (f) 156-hr ovary with label in many posterior cysts. ( g ) 162hr ovary with label restricted to posterior sites within posterior 16-cell cysts, suggesting continued synthesis in oocytes. Arrow (4) indicates labeled posterior sites. (h) 168-hr ovary showing ovarioles with labeled Stage 2 egg chambers representing second round of DNA replication in nurse cells. Arrows (+) indicate unlabeled
96 R. F. GRELL
and that incorporation of label throughout the cyst decreases drastically to 17% by 162 hr, although many cysts show restricted labeling at this time. By contrast, at 168 h r 91
%
of the nurse cells of the ultimate cysts are labeled, indicating that a second round of replication is occurring. The oocyte at the posterior end of the egg chamber is clearly unlabeled (Figure 4h).Genetic Studies
Heat-induced changes in total exchange in the X chromosome: The effect of heat treatment on total crossing-over in the X chromosome is shown in column 2 of Table 3. Treatment begun at 114 or 120 hr, corresponding to a preoocytic stage, results in a significant decrease in exchange as compared to the untreated control; treatment initiated at 132, 138, or 144 hr, corresponding to the early oocyte and necessarily including premeiotic interphase, results in a significant increase in crossing-over; treatment initiated at 150 h r or later gives crossover values that do not differ significantly from the control.
When the crossover data are converted to tetrad frequencies ( WEINSTEIN 1936), the frequencies of noncrossover tetrads (En’s) are increased from the control level of 7.1
%
to 22.6% at 114 hr, 30.8% at 120 hr, and 20.9% at 126 h r (Table 3, column 3). Correlated with the decrease in exchange and the increase in Eo’s, the frequency of primary X nondisjunction is tripled (Table 3, column 4). On the other hand, enhancement of total crossing-over (132-144 hr) is not associated with significant alterations in either the frequency of E, tetrads or of primary X nondisjunction; nor are there significant departures in either case after total exchange values have returned to normal (150-186 hr).
Regional responses of the
X
chromosome to heat: Dissection of the X responseTABLE 3
Frequencies of total crossing-over, E , tetrads, and primary nondisjunction of the X chromosomes
with heat treatment at 6-hr intervals between 114 and 186 hr after egg laying
Treatment time
Control 114-126 120-1 32 126-138 132-14% 138-150 144-156 150-162 156-168 162-174 168-1 80 1 74-1 86 180-192 186198
Noncrossover tetrads Nondisjunction Total map units (percent) (percent)
68.5 t 0.9 7.1 0.2
55.8* k 1.4 22.6 0.7
51.8* f 1.7 30.8 0.7
65.2 i 1.6 20.9 0.7
82.4* f 0.9 8.9 0
80.3’ t 0.9 5.8 0.4
77.4* f 1.0 10.9 0.1
70.8 f 1.3 9.6 0.3
69.0 f 1.4 7.6 0.2
68.7 t 1.3 8.0 0
66.8 f 1.0 6.7 0.2
69.4 t 1.0 7.2 0.1
71.1 f 1.1 3.6 0.2
66.3 zk 1.5 5.2 0.2
RECOMBINATION AND REPLICATION I N OOCYTES
97
1.4
m 1.2
0 a
"
8 fama.
y'sc CY
I I .
0.4 , I I I I I I I I I , I 114 120 126 132 138 144 150 156 162 168 174 180 186
TIME AFTER EGG LAYING (hr)
FIGURE 5.-Crossing-over response of five regions comprising the total X chromosome to 12-hr heat treatments initiated at 6-hr intervals beginning at 114 hr and terminating a t 186 hr.
into the regional responses of its five component parts is shown in Figure 5, where the experimental value for each region is divided by the control value for the same region and plotted as a function of the time of treatment. At the earliest treatment time (1 14 hr)
,
the decrease in total exchange values noted above finds its counterpart in regional decreases that occur in all five regions. By 120 hr, crossing-over is further depressed in all but distal region 1 and reaches its mini- mal value for regions 2, 3 , 4 and 5; in the case of region 2 the decrease is 50%.At 126 hr, coinciding with oocyte formation, interstitial regions 2 and 3 still show depressed values, and distal region 1 and proximal region 4 are slightly above control levels, whereas region 5 shows a sharp and highly significant increase. Since regions 2 and 3 occupy -2/3 of the length of the genetic map, the net effect at this time is a total value not significantly different from that of the control. By 132 hr, distal region 1 and proximal region 5 reach their maximal values, region 4 shows a significant increase, and regions 2 and 3 attain control levels. The latter two regions show no significant departure from the control for the duration of treatment, so that the sole effect of heat on the interstitial regions is to induce a significant decrease in crossing-over, which is maximal when treat- ment is initiated at 120 hr, just preceding oocyte formation. Quantitatively, region 5 , the most proximal, shows the greatest increase in exchange, with a near doubling at 132 hr.
98 R. F. GRELL
cide with boundaries dividing the chromosome into five differently responding segments. For example, the location of the marker within the large interstitial segment between cu and f might well have been many units to the right or left of u without markedly altering the results. On the other hand, had a more distal marker than cu been used, so as to perhaps exclude dilution of region 1 with a
portion of a n interstitial segment giving a contrasting response, the increase in region 1 might have been more impressive. Nevertheless, the markers are so placed as to separate effectively regions that give n o increase, regions that give an early increase, and a region that gives both a n early and a late increase, the latter probably reflecting the nonhomogeneous composition of this segment. To the degree that the markers used define regions that behave differently, it is already evident that the temporal responses of the regions are asynchronous.
Heat-induced increases in total exchange between nub2 and L in chromosome 2: The segment of chromosome 2 investigated thus far includes proximal regions of 2L and 2R and an interstitial region of 2R. Consequently, it is not possible to appraise the effect of heat on total exchange in chromosome 2 o r on E, tetrad formation as has been done f o r the X chromosome. Figure 6 shows the response of the -30-unit segment between nub2 and L to temperature treatments initiated a t 6-hr intervals between 120 and 168 hr. Here again the experimental value obtained from each treatment is divided by the control value, and the quotient is plotted as a function of treatment time. Significant increases are observed with treatments initiated between 126 and 156 hr, and maximal responses are observed between 138 and 156 hr. By 162 hr crossing-over has returned to the control value, indicating that the high level of response at 156 h r arises primarily from treatment during the first half (156-162) of the period from 156 to 168 hr. Similarly, the absence of a significant response to treatment between 120 and
0.8 1 1 I
120 126 132 138 144 150 156 162 1 0 TIME AFTER EGG LAYING ( h r l
RECOMBINATION AND REPLICATION I N OOCYTES 99
132 h r indicates that the sensitive period during the interval from 126 to 138 h r occurs in the latter half, between 132 and 138 hr. The responsive period for the
nubZ to L segment appears then to have a duration of -30 hr (132-162).
Regional responses of the nuba to
L
segment: Figure 7 gives the responses of the four contiguous regions comprising the nub2 to L segment. Again the experi- mental value for each region is divided by the control value for the same region, and the quotient is plotted as a function of the time of treatment. As i n the case of the X , the responses of the different regions are asynchronous. Although the increases begin more or less simultaneously, the return to control level varies con- siderably. Thus, region 4, the most distal studied, shows no increase when treat- ment is initiated after 144 hr, nor region 3 after 156 hr, nor regions 1 and 2 after 162 hr. In fact, the peak response of region 2 at 156 h r occurs a t a time when region 4 has been at a control level for at least 6 hr.In addition to temporal differences, the responses of the four regions also show quantiative differences, which correspond roughly with the proximity of the region to the centromere. Region 2, spanning the centromere, shows the greatest response, and region 4 the least. In this respect
X
and 2 resemble one another, since the greatest enhancement of crossing-over in both chromosomes occurs in the region spanning the centromere. On the other hand, the time of peak response of this region in X is very early (132 hr),
whereas in 2 it is late (156 hr).
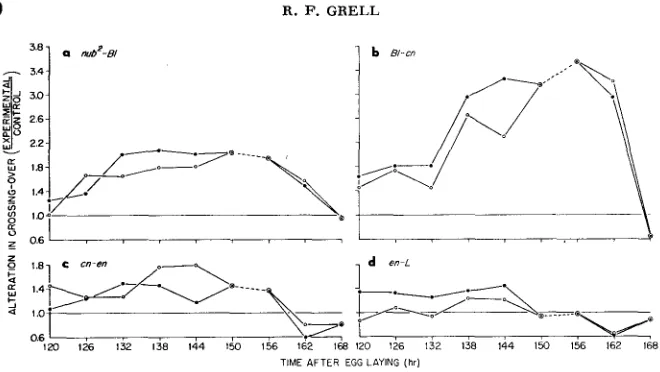
Reproducibility of the response: One criterion for evaluating the synchrony of the population of sampled oocytes is to determine the reproducibility of the temperature-induced changes. Figure 8 presents the results from two indepen- dent sets of experiments, each with its own control. The response of regions 1,2,
3, and 4 are shown in graphs 8a, b, c, and d, respectively. The curves again corre- spond to the ratio of experimental value to control value plotted as a function of the time of initiation of the treatment. Each point represents -500 flies. The
3.81
I
C O N ~ R O LL
\
I I I I 1
120 126 132 138 144 150 156 162 168
TIME AFTER EGG LAYING (hr)
100 R. E'. GRELL
3.4
y
2 6301
$ 1.8, c cn-en 0--9
J
----.-./--:~
I , , , , , I
120 126 132 138 144 150 156 162 168
TIME AFTER EGG LAYING (hr)
FIGURE 8.-Reproducibility of temperature responses for four regions between nub2 and L.
(a) nub2-BZ. (b) BI-cn. (c) cn-en. (d) en-L.
(0)
at 150, 156 and 168 h r indicates tests only runonce at these times.
three intervals for which single points are given (150-162, 156-168, and 168- 180) are those for which only a single experiment was done, since it provided sufficient progeny. Inspection of the set of two curves for each of the four regions shows tkat each set is strikingly similar. The quantitative and temporal repro- ducibility of the responses necessarily reflects the recovery of samples of oocytes that had entered and proceeded through oogenesis in a well-synchronized fashion.
Times of oocyte formation, D N A replication, and heat-induced crossing-ouer:
Figure 9 presents a timetable of the events under investigation. The bars repre- sent the relative frequency of oocytes (eight-cell cysts at metaphase) at the times indicated on the abscissa. The solid bar at the top denotes the period during which
DNA replication in the oocytes has been demonstrated. Curves 1 , 2 , and 3 repre- sent heat-induced alterations in crossing-over in the entire X chromosome; in the proximal portion of the X , and in part of chromosome 2, respectively.
RECOMBINATION A N D REPLICATION I N OOCYTES
2 . 0 1
101
0.6
'
1 I I I I I I I I I I I '114 120 126 132 138 144 150 156 162 168 174 180 186
-1 t
OOCYTE STAGE I
FORMATION EGG CHAMBER
TIME AFTER EGG LAYING (hr)
FIGURE S.-Temporal relation between DNA replication, heat-induced recombination, and oocyte appearance. Vertical bars represent frequencies of eight-cell oogonial cysts at metaphase in ovaries taken from developing females at ages indicated on abscissa. Horizontal bar at top represents duration of D N A replication in the oocyte. Curve 1 represents crossover response of total X chromosome; curve 2, the response of proximal region 5 of the X; curve 3, the response of chromosome 2 between nub2 and L.
Finally, response to temperature treatment, as judged by alterations in exchange, is contingent upon the synchrony during the sensitive period of the recovered sample. I n the original studies (GRELL and CHANDLEY 1965), using adult females and a 24-hr treatment period, increases were observed in five to six daily broods corresponding to a period of 120-144 hr. I n the present studies, the period during which a significant increase is detected is reduced to -36 hr. Although synchrony appears to be very good, there is no reason to assume that it is complete. Dilution of the recovered sample by younger, nonresponding germ cells during early periods of treatment and by younger responding oocytes during late periods of treatment probably distorts the responses slightly at both ends.
A terminal extension may be especially marked for regions that show a late peak followed by a sudden cessation of response, as occurs for that spanning the centro- mere of chromosome 2. Slight asynchrony acting to contaminate a nonresponding population with a highly responding one might misleadingly maintain non- responding populations ai levels higher than those of the controls for some time. Despite the uncertainties surrounding the precise initiation and particularly the termination points of the events, it is abundantly clear.from Figure 9 that maximal increases in total X exchange, in proximal X exchange, and in chromo- some 2 exchange coincide with times (132-156 hr) when D N A replication has been unambiguously demonstrated in our sample of oocytes.
102 R. F. GRELL
decrease in total and proximal exchange in the X chromosome just prior to and coincident with oocyte formation. The decrease is associated with a rise in both
E,
X
tetrads and in primary X exceptions (Table 3 ) . A lengthening of the treat- ment period to 24 h r markedly enhances all of these effects (GRELL 1971a). Nocorresponding early reduction is observed in chromosome 2, and efforts to detect the induction of autosomal nondisjunction by treatment at these times have proved unsuccessful (GRELL 1971a). Since heat-induced crossovers have been shown to be meiotic in origin, the decrease in exchange that occurs with treat- ment preceding oocyte formation must be considered to be an indirect effect. The decrease has been provisionally interpreted as a n effect on exchange pairing during the premeiotic anaphase or telophase of the final gonia1 division. This conclusion finds additional support in the drastic alterations in interference patterns induced by heat treatment at that time
(R.
F. GRELL in preparation). The second feature to be noted in Figure 9 is the amount of total exchange that occurs with heat treatments initiated between 132 and 144 hr.HENDERSON
(1966) suggested, on the basis of the decrease in chiasmata that he observed in heat-treated grasshoppers, that proximal increases in crossing-over might actually reflect an overall decrease with a tendency for proximal localization. This notion can be tested only by examining exchange throughout a chromosome, as has been done for the
X .
In this case it is apparent that HENDERSON’S premise is incorrect, and that heat not only increases proximal exchange but induces a n increase in total exchange as well.DISCUSSION
Not only the intricacies but the broad outlines of the recombination process continue to be elusive. The extent of the uncertainty is highlighted by the contro- versial nature of such basic questions as the role of DNA replication in recombi- nation, the relation between conversion and intergenic crossing-over, and the reciprocality of the recombination event at the nucleotide level. As with repli- cation, the enzymatic mechanisms of recombination seem most accessible to characterization in prokaryotes, but it is questionable whether this approach will furnish all the answers. For example, identification of a biochemical sequence of steps may provide little information concerning the phenomenon of positive interference, which seems to operate at a higher level of chromosome organiza- tion but is an integral feature of crossing-over in eukaryotes. Further, the emerg- ing complexities surrounding the presumably simpler process of DNA replication do not suggest that a biochemical solution is at hand.
R E C O M B I N A T I O N A N D REPLICATION IN OOCYTES 103
of recombination by significantly altering its frequency.
In
addition, the agent should act selectively on meiotic exchange and during a time considered com- patible with normal crossing-over in the meiocyte. On this basis radiation and alkylating agents are unsuitable, since both induce gonial exchange (WHITTING-
HILL 1955; SCHEWE, SUZUKI and ERASMUS 1971), and radiation acts as late as the stage 7 oocyte, well beyond the normal exchange period (PARKER 1963).
Temperature, by contrast, affects crossing-over during a discrete period, corre- sponding to the earliest oocyte (PLOUGH 1917, GRELL and CHANDLEY 1965) and induces neither gonial exchange (GRELL 1966) nor late prophase exchange
(GRELL and CHANDLEY 1965). Unlike radiation and alkylating agents, which cause chromosome breakage, temperature is relatively gentle, and fluctuations of the magnitude employed here are encountered by the fly in its natural habitat.
It is, in fact, an environmental variable that normally influences the level of exchange. For these reasons it was initially selected as the most suitable agent for experimentally marking the time of recombination.
Following the report that replication and enhancement of crossing-over by heat are roughly coincident during premeiotic interphase in Drosophila ( GRELL
and CHANDLEY 1965), similar procedures were applied to a variety of eukaryotes by a number of investigators. The results are conflicting and most meaningfully divisible into those which confirm and those which deny coincidence. Inter- estingly, confirmation and denial are generally correlated with the use of a genetic or a cytological approach, respectively. Thus ABEL’S (1968) studies with
Sphaerocarpus, MAGUIRE’S (1968) studies with maize and the work of HASTINGS (1964) i n conjunction with that of CHIANG and SUEOKA (1967) on ChZamy- domonas reinhardi indicate coincidence between the sensitive period for increas- ing crossing-over by heat and meiotic
DNA
replication and/or premeiotic inter- phase. Lu (1969) finds that heat administered to Coprinus Zagopus induces a maximal increase in crossing-over during karyogamy and synapsis, although the increase extends through pachytene as well. Since karyogamy and pachytene are separated by only 4 hr, the heat treatment takes 3 hr, and the establishment of karyogamy is asynchronous by at least 2 hr, the procedure cannot precisely resolve the critical period. As with other basidiomycetes, the time of meiotic replication is unknown for Coprinus.I n cases where the effect of temperature has been measured less directly, by studying changes in chiasma frequency or increases in univalents, the sensitive period has often been identified as zygotene or pachytene. Thus,
HENDERSON
104 R . F. GRELL
sensitive stage for chiasma reduction in Goniaea australasiae as early pschytene,
a stage that follows synthesis by four days and precedes pachytene by six days and is probably more correctly identified as prepachytene. CHURCH and WIMBER
(1969) report that heat sensitivity, as measured by reduced chiasma frequency in Melanoplus femur-rubrum extends from premeiotic S to midzygotene, but the same authors find the cold-sensitive stage for univalent formation in Ornithago- Zum uirens to be premeiotic interphase or G,-early leptotene (CHURCH and
WIMBER 1971). Subjective differences in the criteria used by various investi- gators for the identification of stages may account, in part, for the differences in results. Careful comparisons of heat sensitivity and labeling, irrespective of stage, might be more informative. Sensitivity at leptotene or even zygotene does not preclude coincidence with the major DNA synthetic period, since the latter is known to extend into prophase stages in some organisms (TAYLOR 1957).
It
is of more than a little interest that the predominant genetically-detected effect of heat is increased recombination, whereas the only cytologically-detected effects are decreased chiasmata and univalent formation. HENDERSON’S ( 1966) suggestion that the genetic results might arise from a heat-induced clustering of exchanges in the marked chromosome regions, with more than compensatory decreases elsewhere leading to a reduction in total exchange, is effectively ruled out by the present work, which shows that total crossing-over in theX
chromo- some is significantly increased with treatment at 132, 138, or 144 hr. Another possibility is that different components of the process were measured in the two types of studies. Substitution of chiasma for exchange implies that the two events are equivalent in time as well as in origin. But, just as the formation of two daughter chromatids is not completed with DNA replication, so the formation of the chiasma may be incomplete at the time of exchange. If the chiasma is susceptible to resolution by heat during or even after its maturation process, then discrepancies in the direction and time of response as measured by crossing-over vs. chiasmata are readily explained. The effect of heat on chiasmata could vary from organism to organism. In Drosophila, the failure to detect nondisjunction when heat is applied to the oocyte stage indicates that univalents are not pro- duced (GRELL 1971).RECOMBINATION A N D REPLICATION I N OOCYTES 105
The regions examined thus far provide the following information:
1 . Enhancement of crossing-over by heat begins with oocyte formation during premeiotic interphase and continues for -36 hr.
2. During the 36-hr period different regions are asynchronous with respect to peaks, duration, initiation, and termination points, as well as degree of response.
3. The reproducibility of the asynchronous regional responses has permitted the generation of a thermal recombination map. Thus far, the map reveals, quantitatively, that the regions spanning the centromeres show the greatest enhancement within their respective chromosomes. Proximal and distal regions are enhanced to a lesser degree, and interstitial regions show still less o r no enhancement. Temporally, the peaks for the centromere regions are distinct, with the X peaking very early (treatment at 132 hr) and the 2 late (treatment at 156 hr)
.
To this may be added the recent finding forchromosome 3 , that its centromeric region peaks at a n intermediate time (treatment at 138 or 144 hr) and exhibits a degree of enhancement that is an order of magnitude greater than that observed elsewhere i n the genome
(GRELL 1972).
Correlated autoradiographic studies show that, like heat response, DNA repli- cation begins close to oocyte formation at premeiotic interphase (-132 h r ) and continues for a minimum of 24 h r (-156 hr). This means that synthesis and heat enhancement are coextensive for at least 24 hr, and that the responsive period for most of the genome measured thus far occurs during the S period. Three regions continue to respond after 156 hr, one peaking a t 162 hr, but all terminating before 168 hr. Several explanations compatible with complete coex- tension of the two processes are possible. First, DNA replication may occur in the oocyte after 156 hr, as suggested by the high frequency of restricted labeling in
posterior region of the cyst at 162 h r (Table 2 ) . Such labeling may represent replication continuing in the oocyte after its termination in the nurse cells. A
conspicuous extension of the replication period in the meiocyte has been fre- quently reported (MONESI 1962; WIMBER and PRENSKY 1963; CRONE, LEVY and
PETERS 1965; CALLAN 1972). Second, within the oocyte certain regions may be late in replicating. Should such regions comprise a small fraction of the genome, autoradiographic detection would be difficult. Third, as suggested earlier, slight asynchrony could dilute a nonresponding population so as to give a n apparent increase in crossing-over. This possibility is particularly applicable for a region whose peak is late and immediately precedes termination of response; it could not account for peaks occurring after replication. On the other hand, response in certain regions of the genome may actually follow replication, suggesting, per- haps, the operation of a different mechanism of recombination.
106 R. F. GRELL
recombination in progress, heat can cause the conspicuous and characteristic increases observed 24 h r before recombination begins. The same assumption would be required to account for newly induced exchange in chromosome 4 , since the effective period for heat induction (132-156 hr) coincides with the S period
(GRELL 1971b). The finding that heat induces dramatic changes in interference patterns, that these changes often precede enhancement of exchange, and that they appear to be independent of and separable from the latter, does not support the notion that heat accomplishes increases in crossing-over indirectly by acting on chromosome pairing (R. F. GRELL in preparation).
Several recent reports implicate DNA synthesis in the recombination process in procaryotes.
STAHL
and STAHL (1971) find that recombination in phage X is accompanied by extensive DNA synthesis in most regions of the genome, although the association is unclear. Genetic studies byBOON
and ZINDER (1971) with phage f 1 suggest that recombinant formation may often be accompanied by synthesis.BRESLER,
LANZOR and LUKJANIEE-BLINKOVA ( 1968) and WLODARCZYKand KUNICKI-GOLDFINGER ( 1970) report that during conjugation in Escherichia coli K12, recombinant formation in the F- recipient cell requires unabated DNA synthesis. Studies of Bacillus subtilis by ERICKSON and
BRAUN
(1968) have shown a cyclic shift in the transformation peaks of nonlinked markers, corre- sponding with their known position on the linkage map. The authors interpret their results to mean that DNA is integrated via association with homologous regions of replicating DNA of the recipient cell at the membrane replication site. I n addition,ROTH
(1972) reports that in diploid strains of the eukaryote Sac-chromyces cerevisiae, meiotic replication and intragenic recombination both begin 4-6 h r after incubation on sporulation medium, prdceed in a coordinate manner, and cease 24 h r later.
Finally, it may be of some relevance to consider the temporal relation of DNA replication, heat-induced recombination, and synaptonemal complex formation in the Drosophila oocyte. Although the function of the complex has not been resolved, it is considered by some to be an essential feature of exchange pairing and/or exchange
(MOSES
1968; MEYER 1960; COMINGS and OKADA 1970).In
this view, the complex should first appear when homologs synapse. The studies
of KOCH, SMITH and KING (1967) provide some information concerning the time of its appearance in the Drosophila oocyte. They report that within 6 h r of oocyte formation the complex is present in 75% of the oocytes found in the anterior region of the germarium where newly formed 16-cell cysts lie (see Figure 6
GRELL 1969). The present studies have shown that DNA replication and heat induction of recombination also begin within 6 h r of oocyte formation and con- tinue for at least 24 hr. Apparently, then, the three events must be concurrent during premeiotic interphase in the Drosophila oocyte.
The author wishes to thank DR. J. W. DAY for his excellent cytological studies.
LITERATURE CITED
RECOMBINATION AND REPLICATION I N OOCYTES 107
BOON, T. and N. D. ZINDER, 1971
BRESLER, S. E., V. A. LANZOR and A. A. LUKJANIEE-BLINKOVA, 1968
BUCHER, N., 1957
CALLAN, H. G., 1972
CHANDLEY, A., 1966
CHAUHAN, K. P. S. and W. 0. ABEL, 1968
CHIANG, K. and N. SUEOKA, 1967
On the genotypes produced by individual recombination events involving bacteriological f l . J. Mol. Biol. 58: 133-151.
On the mechanisms of conjugation in Escherichia coli K12. Molec. Gen. Genet. 102: 269-284.
Experimentelle Untersuchungen uber die Beziehungen zwischen Keimzellen und somatischen Zellen im Ovar von Drosophila melanogaster. Rev. Suisse Zool.
a:
91-188.Replication of DNA in the chromosomes of eucaryotes. Proc. Roy. SOC.
Lond. Ser. B. 181: 19-41.
Studies on oogenesis in Drosophila melanogaster with 3H-thymidine label. Exptl. Cell Res. 4: 201-215.
Evidence for the association of homologous chromo- somes during premeiotic stages in Impatiens and Salvia. Chromosoma 25: 297-302.
Replication of chromsomal and cytoplasmic DNA during mitosis and meiosis in the eucaryote Chlamydomonas reinhardi. J. Cell. Physiol. 70 (Suppl.
Meiosis in the grasshopper: Chiasma frequency after elevated temperature and X rays Can. J. Genet. Cytol. 11: 209-216. ----, 1971 Meiosis
in Ornithogalum uirens (Lilliaceae). 11. Univalent production by preprophase cold treat-
ment. Exptl. Cell Res. 64: 119-124.
COMINGS, D. E. and T. A. OKADA, 1970 Mechanism of chromosome pairing during meiosis. Nature 227: 45-456.
CRONE, M., E. LEVY and H. PETERS, 1965 The duration of the premeiotic DNA synthesis in
mouse oocytes. Exptl. Cell Res. 39: 678-688.
ERICKSON, R. J. and W. BRAUN, 1968 Apparent dependence of transformation on the stage of deoxyribonucleic acid replication of recipient cells. Bacteriol. Rev. 32 : 291-296.
GRELL, R. F., 1966 The meiotic origin of temperature-induced crossovers in Drosophila melano-
gaster females. Genetics 54: 411-421.
-
, 1967 Pairing at the chromosomal level.J. Cell. Physiol. 70 (Suppl. 1): 119-145.
-
, 1969 Meiotic and somatic pairing. pp. 361-492. In: Genetic Organizntion. Edited by E. W. CASPARI and A. W. RAVIN. Academic Press, New York. - , 1971a Induction of sex chromosome nondisjunction by elevated temperature. Mutation Res. 11: 347-349.-,
1971b Heat-induced exchange in the fourth chromosome of diploid females of Drosophila melanogaster. Genetics 69 : 523-527.-
, Studies on the coincidence of heat-induced crossing-over and DNA replication in the Drsosophila oocyte. Genetics 71: s21-s22.Evidence bearing on the coincidence of exchange and DNA replication in the oocyte of Drosophila melanogaster. Proc. Natl. Acad. Sci. U.S. 53: 1340-1346.
GUY~NOT, E. and A. NAVILLE, 1933 Les premier& phases de I’ov6gen6se de Drosophila melano-
gaster. Cellule 42 : 213-230.
HASTINGS, P. J., 1964 Genetic recombination studies with C h l a m y d o m o m reinhardi. PbD.
thesis, University of Cambridge.
Time of chiasma formation in relation to the time of deoxyribonucleic acid synthesis. Nature 211: 1043-1047.
Oogenesis in adult Drosophila melanogaster.
The division and differentiation of Drosophila
Evidence on the stage of heat induced crossover effect in maize. Genetics 1): 89-118.
CHURCH, K. and D. E. WIMBER, 1969
1972
GRELL, R. F. and A. C. CHANDLEY, 1965
HENDERSON, S. A., 1966
KINO, R. C., A. C. RUBINSON and R. F. SMITH, 1956 Growth 20: 121-157.
KOCH, E. A., P. A. SMITH and R. C. KING, 1967 cystocytes. J. Morphol. 121: 55-70. MAGUIRE, M. P., 1968
108 R. F. GRELL
MEYER, G. F., 1960 pp. 951-954. In: Proc. European Regional Conf. on Electron Microscopy,
MONESI, V., 1962 Autoradiographic study of DNA synthesis and the cell cycle in spermatogonia
MOSES, M. J., 1968
PARKER, D., 1963 On the nature of sensitivity changes in oocytes of Drosophila melanogaster.
pp. 11-19. In: Repair from Genetic Radiation Damage. Edited by F. H. Sobels. Pergamon, Oxford.
Chiasmata and crossing-over. pp. 242-252. In: Replication and Recombi- nation of Genetic Material. Edited by W. J. PEACOCK and R. D. BROCK. Australian Academy of Science, Canberra. -, 1970 Replication, recombination and chiasmata in Goniaea australasiae (Orthoptera: Acrididae). Genetics 6 5 : 593-617.
PLOUGH, H. H., 1917 The effect of temperature on crossingover in Drosophila. J. Exptl. Zool.
24: 147-194.
RHOADES, M. M., 1968 Studies on the cytological basis of crossing over. pp. 229-241. In: Repli- cation and Recombination of Genetic Material. Edited by W. J. PEACOCK and R. D. BROCK. Australian Academy of Sciences, Canberra.
Coordinate genetic control of replication and recombination during meiosis in yeast. Abst. Ann. Meeting Amer. Soc. Microbiology. p. 73.
The genetic effects of mitomycin C i n
Drosophila melanogaster. 11. Induced meiotic recombination. Mutat. Res. 12 : 269-279.
Polarization and progression in pairing. 11. Premeiotic orientation and the initiation of pairing. Can. J. Res. 20: 221-229.
I. Recombination in a DNA-negative host. pp. 431-4442. In: The Bacteriophage Lambda. Edited by A. D. HERSHEY. Cold Spring Harbor Laboratory, New York.
The deoxyribose nucleic acid content of animal nuclei. Physiol. Zool. 23:
The time and mode of duplication of chromosomes. Amer. Natur. 91:
The theory of multiple-strand crossing-over. Genetics 21 : 155-199.
Delft (Vol. 2).
and spermatocytes of mouse testis using tritiated thymidine. J. Cell Biol. 14: 1-18. Synaptinemal complex. Ann. Rev. Genet. 2: 363-412.
PEACOCK, W. J., 1968
ROTH, R. M., 1972
SCHEWE, M. J., D. T. SUZUKI and U. ERASMUS, 1971
SMITH, S. G., 1942
STAHL, M. M. and F. W. STAHL, 1971
SWIFT, H., 1950
TAGLOR, J. H., 1957
WEINSTEIN, A., 1936 WHITTINHILL, M., 1955
WIMBER, D. E. and W. PRENSKY, 1963
WLODARCZYK, M. and W. KUNICKI-GOLDFINGER, 1970 169-198.
209-221.
Crossover variability and induced crossing over. J. Cell. Physiol. 45
(Suppl. 2): 189-220.
Autoradiography with meiotic chromosomes of the male newt (Triturus viridescens) using H3-thymidine. Genetics 48: 1731-1738.