R E S E A R C H
Open Access
A cooperative spectrum sensing method
based on information geometry and fuzzy
c-means clustering algorithm
Shunchao Zhang
1, Yonghua Wang
1,2*, Jiangfan Li
1, Pin Wan
1,3, Yongwei Zhang
1and Nan Li
1Abstract
To improve spectrum sensing performance, a cooperative spectrum sensing method based on information geometry and fuzzy c-means clustering algorithm is proposed in this paper. In the process of signal feature extraction, a feature extraction method combining decomposition, recombination, and information geometry is proposed. First, to improve the spectrum sensing performance when the number of cooperative secondary users is small, the signals collected by the secondary users are split and reorganized, thereby logically increasing the number of cooperative secondary users. Then, in order to visually analyze the signal detection problem, the information geometry theory is used to map the split and recombine signals onto the manifold, thereby transforming the signal detection problem into a geometric problem. Further, use geometric tools to extract the corresponding statistical characteristics of the signal. Finally, according to the extracted features, the appropriate classifier is trained by the fuzzy c-means clustering algorithm and used for spectrum sensing, thus avoiding complex threshold derivation. In the simulation results and performance analysis section, the experimental results were further analyzed, and the results show that the proposed method can effectively improve the spectrum sensing performance.
Keywords: Cooperative spectrum sensing, Information geometry, Decomposition and recombination, Fuzzy
c-means clustering algorithm
1 Introduction
With the development of wireless communication, spec-trum resources have become increasingly scarce, but most of the existing spectrum resources have not been fully uti-lized. Cognitive radio (CR) technology allows secondary users (SUs) to access the spectrum when the authorized primary user (PU) is idle, thus effectively alleviating the spectrum scarcity problem [1]. In CR, spectrum sensing is a key step that is mainly used to sense the existence of the PU [2].
1.1 Related work
Classical spectrum sensing methods include energy tion, matched filter detection, and cyclic eigenvalue
detec-*Correspondence:[email protected]
1School of Automation, Guangdong University of Technology, Guangzhou 510006, China
2State Key Laboratory of Management and Control for Complex Systems, Institute of Automation, Chinese Academy of Sciences, Beijing 100190, China Full list of author information is available at the end of the article
tion [3]. As the simplest spectrum sensing algorithm, energy detection has low computational complexity and does not require prior information from the PU. There-fore, this method has been widely used. However, the algorithm is susceptible to noise uncertainty, which will greatly reduce detection performance [4,5]. Matching fil-ter detection is the optimal signal detection algorithm when all the information of the PU is known. However, the disadvantages of this method are also very obvious, because it requires prior knowledge of the PU that include the packet format and sequence, and the modulation type [6,7]. The calculation of cyclic eigenvalue detection is rel-atively complicated, so it cannot be detected in real time; therefore, rapid detection is not possible [8].
The application of random matrix theory to spectrum sensing has attracted the interest of many researchers [9,10]. By acquiring the sensing data of multiple SUs and composing the sampling signal matrix, and then calculat-ing the covariance matrix, the correspondcalculat-ing eigenvalue is finally calculated as the decision statistic. Nowadays,
many cooperative spectrum sensing algorithms based on random matrices have been proposed. Liu et al. proposed a maximum to minimum eigenvalue (MME) spectrum sensing method. The modified method uses the extracted MME feature value as a statistical fea-ture of the signal and compares with a preset thresh-old to determine whether the PU exists [11]. However, when the number of sampling points is insufficient, the detection performance is obviously degraded. Liu et al. proposed a spectrum sensing method for the difference between the maximum eigenvalue and the average energy (DMEAE) . The method uses the DMEAE feature as a sta-tistical feature of the signal and then compares it with a preset threshold to achieve spectrum sensing [12]. Tulino et al. proposed a spectrum sensing method based on the difference between the maximum eigenvalue and the min-imum feature (DMM) [13]. Similar to the above method, the DMM feature is also used as a statistical feature, and spectrum sensing is implemented by comparing with a preset threshold. However, this method has poor per-ceived performance when the number of cooperative SUs is small and the signal-to-noise ratio (SNR) is low. A statistical feature extraction method based on decompo-sition and recombination (DAR) is proposed. To logically increase the number of cooperative users, the method firstly splits and reorganizes the signal matrix, thereby effectively improving the spectrum sensing performance [14]. From the above analysis, it can be known that the tra-ditional spectrum sensing based on random matrix needs to derive and calculate the threshold of the decision in advance. The whole process is complex, and there are problems such as inaccurate thresholds.
With the rapid development of information geometry theory, the concept of statistical manifolds is used to transform signal detection problems into geometric prob-lems on manifolds, and then geometric tools can be used to visually analyze detection problems. Liu et al. used information geometry theory to detect radar signals. At the same time, a matrix constant false alarm rata (CFAR) and a distance detector based on geodesic were proposed [15]. Chen applied the information geometry method to spectrum sensing, increased the measurement of mani-folds, and obtained the decision threshold through simu-lation [16]. Lu et al. used the matching method to obtain the closed expression of the decision threshold, which has higher computational complexity [17]. However, in spec-trum sensing, the derivation of the threshold is not only complicated, but there is always some deviation in using the fixed decision threshold to determine whether the PU exists.
In recent years, machine learning has developed rapidly, which also provides a new idea for spectrum sensing. Spectrum sensing can be considered as a problem of two classifications that is whether the PU exists [18–20].
Kumar proposed a spectrum sensing method based on K-means clustering algorithm and energy feature. The method takes the energy value of the signal as the feature and then uses K-means clustering algorithm to classify these features [21]. Zhang et al. proposed a spectrum sens-ing method based on K-means and signal features that combines the feature extraction methods in the random matrix and selects MME, DMM, and DMEAE as the char-acteristics of training and classification [22]. Thilina et al. used K-means, Gaussian mixture model (GMM) in unsu-pervised learning, and neural network (NN) and support vector machine (SVM) in supervised learning to study spectrum perception [23]. Xue et al. proposed a cooper-ative spectrum sensing algorithm based on unsupervised learning. The dominant features and the maximum and minimum eigenvalues are used as features. K-means clus-tering and GMM are selected as the learning framework [24]. Compared with the traditional spectrum sensing method, spectrum sensing based on machine learning can effectively eliminate the cumbersome threshold calcula-tion and has better adaptability. Similarly, the method does not need to know the priori information of the PU.
1.2 Contributions
Based on the above researches, this paper proposes a cooperative spectrum sensing method based on infor-mation geometry and fuzzy c-means (FCM) clustering algorithm (IGFCM). In the feature extraction process, the order-DAR (O-DAR) and interval-DAR (I-DAR) are intro-duced to obtain two new matrices, then two covariance matrices of two new matrices are calculated separately, and then two covariance matrices are mapped to the man-ifold using information geometry theory. Then, use the geodesic distance to calculate the distance on the man-ifold and use it as a feature. Finally, the FCM clustering algorithm is used to implement spectrum sensing. The spectrum sensing method proposed in this paper does not require any prior information about the communi-cation system, and the unmarked training data is more easily obtained. In the experiment, the spectrum sensing performance of IGFCM was further analyzed. The simu-lation results show that the method effectively improves the spectrum sensing performance.
1.3 Methods or experimental
the amplitude modulation signal to verify the proposed method.
2 Cooperative spectrum sensing system model
According to the perception of PU by a single SU in a cognitive radio network (CRN), the following binary hypothesis [25] about PU can be obtained. H0indicates that the PU signal does not exist, andH1indicates that the PU signal exists.
x(n)=
w(n) H0
s(n)+w(n) H1 (1)
where s(n) represents the signal transmitted by the PU andw(n)is the ambient noise. Since CR is primarily used for relatively fixed networks, the actual channel model is similar to additive white Gaussian noise (AWGN). The systems false alarm probability (Pf) and detection proba-bility (Pd) can be defined as:
Pf =P[H1|H0] (2)
Pd=P[H1|H1] (3)
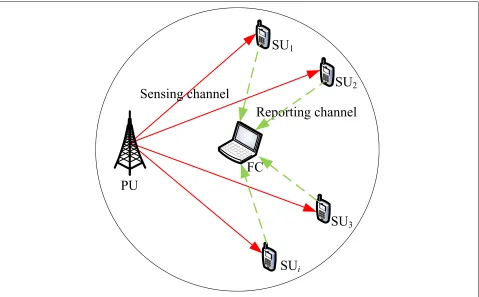
In CRN, spectrum sensing is often done in complex envi-ronments. Therefore, the SU needs to consider peripheral multi-path fading, shadow effects, and hidden terminals in the process of sensing the PU [26, 27]. Cooperative spectrum sensing reduces the impact of environmental
factors by increasing the diversity of SUs. Therefore, to improve the performance of the spectrum sensing system, the method of multi-SU cooperative spectrum sensing is adopted. First, SUs collect information about the autho-rized channel and then transmits the information to a fusion center (FC) through the reporting channel; finally, the unified processing by the FC and the final decision is made. Cooperative spectrum sensing system model is shown in Fig.1.
Assuming that there areMSUs in a CRN, the signals collected by theMSUs can form a signal vector matrix
xi =[xi(1),xi(2),. . .,xi(N)], whereX=[x1,x2,. . .,xM]T represents the signal sample value of theith SU. Therefore,
Xis a matrix ofM×Ndimensions.
X=[x1,x2,. . .,xM]T = ⎡ ⎢ ⎢ ⎢ ⎣
x1(1) x1(2) · · · x1(N)
x2(1) x2(2) · · · x2(N) ..
. ... . .. ...
xM(1) xM(2) · · · xM(N) ⎤ ⎥ ⎥ ⎥ ⎦(4)
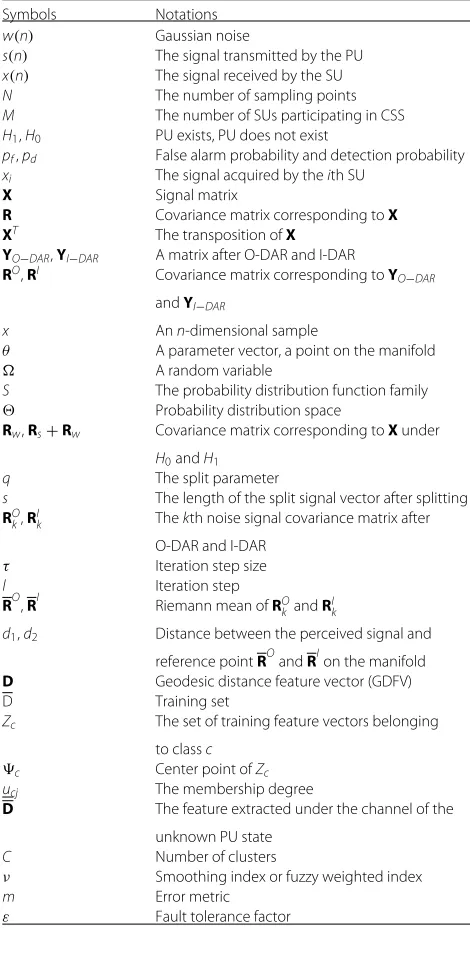
For ease of reference, the symbols and notations used in this paper are summarized in Table1.
Table 1Summary symbols and notations
Symbols Notations
w(n) Gaussian noise
s(n) The signal transmitted by the PU
x(n) The signal received by the SU
N The number of sampling points
M The number of SUs participating in CSS
H1,H0 PU exists, PU does not exist
pf,pd False alarm probability and detection probability
xi The signal acquired by theith SU
X Signal matrix
R Covariance matrix corresponding toX
XT The transposition ofX
YO−DAR,YI−DAR A matrix after O-DAR and I-DAR
RO,RI Covariance matrix corresponding toYO−DAR
andYI−DAR
x Ann-dimensional sample
θ A parameter vector, a point on the manifold
A random variable
S The probability distribution function family
Probability distribution space
Rw,Rs+Rw Covariance matrix corresponding toXunder
H0andH1
q The split parameter
s The length of the split signal vector after splitting RO
k,RIk Thekth noise signal covariance matrix after O-DAR and I-DAR
τ Iteration step size
l Iteration step
RO,RI Riemann mean ofROkandRIk
d1,d2 Distance between the perceived signal and
reference pointROandRIon the manifold
D Geodesic distance feature vector (GDFV)
D Training set
Zc The set of training feature vectors belonging
to classc
c Center point ofZc
ucj The membership degree
D The feature extracted under the channel of the
unknown PU state
C Number of clusters
ν Smoothing index or fuzzy weighted index
m Error metric
ε Fault tolerance factor
3 Feature extraction based on decomposition and recombination and information geometry 3.1 Feature extraction model
In the feature extraction process, the noise environment needs to be estimated first, and two covariance matri-ces are obtained by splitting and recombining the noise signal matrix in sequence and interval. The model of feature extraction based on decomposition and recombi-nation and information geometry is shown in Fig. 2. In order to accurately estimate the noise environment, col-lect enough noise signal matrices and perform O-DAR and I-DAR and covariance transformation (as shown in the box in Fig.2). Then, use the Riemann mean calculation method to solve the Riemann mean of these covariance matrices. Similarly, the signal matrix with the perception is also subjected to two kinds of split recombination, and the covariance matrix is transformed. Finally, the distance from the covariance matrix obtained from the environ-ment to be perceived to the Riemann mean is calculated. Then, use this distance as a statistical feature of the signal.
3.2 Information geometry overview
According to the matrixX, the corresponding covariance matrix can be calculated as shown in Eq.5.
R= 1 NXX
T (5)
From the theory of information geometry, we assume a set of probability density functionsp(x|θ), wherexis an
n-dimensional sample belonging to the random variable ,x ∈ ∈Cn.θ is anm-dimensional parameter vector, θ ∈⊆Cm. Therefore, the probability distribution space can be described by parameter set . The probability distribution function familySis as shown in Eq.6.
S= p(x|θ)|θ ∈⊆Cm (6)
Under a certain topological structure,Scan form a micro-scopic manifold, called a statistical manifold, andθ is the
coordinate of the manifold. From the perspective of infor-mation geometry, the probability density function can be parameterized by the corresponding covariance matrix. Under the two hypothesesH0andH1of spectrum sens-ing, the signal can be mapped to a point that isRw or
Rs+Rw, on the manifold. Rw andRs+Rw are respec-tively the covariance calculated from the noise matrix and the signal matrix. In particular, bothRwandRs+Rware Toeplitz Hermitian positive definite matrices [17]. There-fore, a symmetric positive definite (SPD) matrix space composed of a covariance matrix can be defined as an SPD manifold.
3.3 Decomposition and recombination
In this section, we first split and reorganize the signal matrix for SU to logically increase the number of coop-erative SUs. The DAR is divided into O-DAR and I-DAR. At the same time, the O-DAR and I-DAR are used to process the signal vector perceived by the SU. The specific algorithm is as follows [14]:
In the process of O-DAR,xiwill be sequentially split into sub-signal vectors ofq(q > 0) segments = N/q long. Then, the result of splittingxiis as follows:
xi
The signal vector in Eq.4is split according to Eq.7, and then, the split sub-signal vector is recombined to obtain a
qM×sdimensional signal matrixYO−DAR.
In the process of I-DAR, select sampling points in the sampled data everyq−1 units and then recombine the sig-nal matrixX. The sampled data is separated byq−1 units, the sample points are reselected, and the signal matrix is recombined. According to I-DAR, the sampled data can be split into sub-signal vectors ofq(q>0)segments=N/q
long. Then, the result of splittingxiis as follows:
xi
The signal vector in Eq.4is split according to Eq.9, and then, the split sub-signal vector is recombined to obtain a
qM×sdimensional signal matrixYI−DAR.
According to YO−DAR and YI−DAR, the corresponding covariance matricesROandRIcan be calculated.
RO= 1
First, SUs collectPenvironmental noise matrices. These noise matrices are then processed using O-DAR and I-DAR, and the covariance matrix will be calculated. Thus, we can obtainROk(k=1, 2,. . .,P)andRIk(k=1, 2,. . .,P)
matrices. Their Riemann mean objective functions are shown in Eqs.13and14, respectively.
on the manifold described below.
Assume that for the case where there are two pointsR1 andR2on the matrix manifold,Ris located at the mid-point of the geodesic line connecting the two mid-pointsR1 and R2 on the manifold. Its expression is as shown in Eq.17. IfP > 2, the Riemann mean will be difficult to calculate. Literatures [28,29] give a method of iteratively calculating
Rusing the gradient descent algorithm, and finally obtain the Riemann mean calculation formula as shown in Eq.18.
Rl+1=R where τ is the step size of iteration and l indicates the number of iteration steps. Therefore, we use the gradient descent algorithm to calculate the Riemann matrix, and getROandRI.
3.5 Geodesic distance
The study of a geometric structure is mainly to study some properties such as distance, tangent, and curvature on the structure. There are many ways to measure the dis-tance between two probability distributions on a statistical manifold. The most common is the geodesic distance.
Assumingθis a point on the manifold, the metric on the statistical manifold can be defined by G(θ)of the following equation, called the Fisher information matrix.
G(θ)=E
Due to the nature of the manifold curvature, we determine the distance between the two points by defining the length of the curve connecting the two points on the manifold. Consider an arbitrary curveθ(t)(t1≤t≤t2)between two
It can be seen that the distance betweenθ1andθ2depends on the selection of the curveθ(t). We call the curve that makes Eq.20have the smallest distance as the geodesic, and call the corresponding distance as the geodesic dis-tance.
For any probability distribution, the calculation of geodesic distance is more complicated, which has some adverse effects on its application. For a multivariate Gaus-sian distribution family with the same mean but different
covariance matrices, consider the two members of R1 andR2 in the covariance matrix. The geodesic distance between them is shown in the following Eq.21[31].
D(R1,R2)= According to the feature extraction process and the above analysis, the signal matrix to be perceived is split and recombined in sequence and interval, and the covari-ance matrix is transformed to obtainROandRI. Then, we use Eq.21to solve the corresponding geodesic distance.
d1=D
According to the geodesicd1 andd1, a two-dimensional feature vectorD=[d1,d2] is used to represent the signal sensed by the SU. Finally, the feature vectorDis used for spectrum sensing.
4 Cooperative spectrum sensing based on FCM clustering algorithm
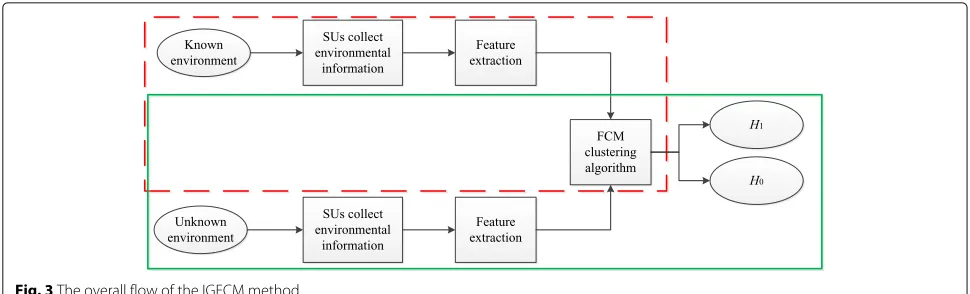
Fig. 3The overall flow of the IGFCM method
The method of IGFCM is divided into two parts. In the first part, the red box indicates the training process. In the second part, the spectrum sensing process is represented in the green box.
4.1 Training process based on FCM
Before training, we need to prepare a training set D:
D=D1,D2,. . .,DJ
(24)
Among them,Djis the feature vector extracted in the third section and J represents the number of training feature vectors. The clustering algorithm divides the unlabeled training feature vectors intoCnon-overlapping clusters. LetZcdenote the set of training feature vectors belonging to classc, wherec=1, 2,. . .,C, then
Zc= Dj|Dj∈Cluster c∀j
(25)
The classZchas a corresponding centerc, and each sam-pleDjbelongs tocwith a membership degree ofucjand 0 < ucj < 1. The objective function of the FCM clus-tering algorithm is shown in Eq.26, and the constraint condition is shown in Eq.27.
=Cc=1Jj=1umcj!!Dj−c!!2 (26)
C
c=1ucj=1, ∀j=1, 2,. . .,J (27)
where!!Dj−c!!2is an error metric andmis a weighted power exponent of the membership degree ucj, which may also be referred to as a smoothness index or a fuzzy weighted index, andm>1.
Using Lagrange to collate the objective functionand constraints, the objective function shown in Eq. 28 is obtained.
=C
c=1 J
j=1umcj!!Dj−c!!2+λ1Cc=1uc1−1
+. . .+λjCc=1ucj−1
+. . .+λJCc=1ucJ−1 (28)
Then, the membership degreeucj and the cluster center care respectively derived, and the constraint condition is substituted [33,34], thereby obtaining the calculation formulas ofucjandc, as shown in the Eqs.29and30.
ucj=
1 C
k=1 D
j−c
Dj−k
2
m−1
(29)
c= J
j=1
Djumcj
J j=1umcj
(30)
The training process based on the FCM clustering algo-rithm is as follows:
Step 1 Input training data set D, number of clusters
C, smoothing indexm, initialization membershipucj, and fault tolerance factorε
Step 2 Calculate the class centercby Eq.30
Step 3 Calculate ν = !!Dj−c!!2 , if ν < ε, the algorithm stops; otherwise, continue to step 4
Step 4 Recalculate the membership degreeucjaccording to Eq.29, return to step 2
Step 5 Output class center pointc
4.2 Spectrum sensing process based on FCM
After the training is successful, we can get a classifier for spectrum sensing, as shown in Eq.31.
!!
!D−1!!! min
c=2,3,...,C !!
!D−c!!!
> ξ (31)
Fig. 4Unclassified feature vectors
The parameter ξ is used to control the probability of missed detection and false alarm probability in the sensing process [21].
5 Simulation results and performance analysis
The cooperative spectrum sensing algorithm based on fuzzy c-means clustering algorithm is simulated and
analyzed in this section. The simulation PU signal is the amplitude modulation (AM) signal, and the noise is Gaus-sian white noise. In order to ensure the accuracy of the experiment, according to the feature extraction method described in Section4, 2000 signal feature vectors were extracted, of which 1000 are training samples and 1000 are used as test samples.
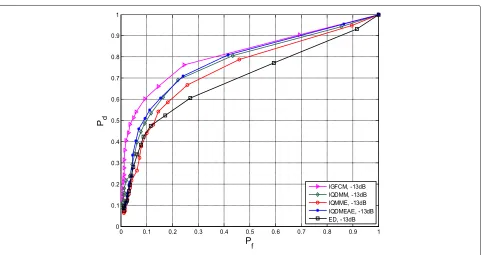
Fig. 6ROC curves for different algorithms atSNR= −13 dB andM=2
Firstly, we analyze the clustering effect of FCM clus-tering algorithm under this feature. Set the simulation parameters: cooperative SU M = 2, sampling points
N = 1000,SNR = −11 dB. Figure4 shows the signal and noise feature training samples obtained by the fea-ture extraction method of split recombination combined
with information geometry as the training input of the classifier.
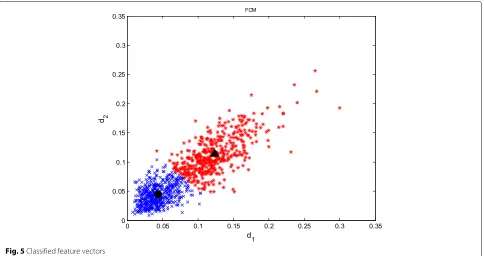
Figure5shows the clustering data after using the fuzzy c-means clustering algorithm. The blue dot in Fig.5 rep-resents the noise feature vector, and the red dot reprep-resents the signal feature vector. Black dots and black triangles
Fig. 8ROC curve at different number of SU withSNR= −15 dB
represent the center of the noise class and the PU signal class, respectively.
Further, we compare and analyze the performance of IGFCM and other methods, which are respectively char-acterized by energy (ED), and the IQMME, IQDMM, IQDMEAE methods are proposed in literature [22]. Given the simulation parameters, the cooperative SU number
M = 2, the number of sampling pointsN = 1000, and the simulation diagrams when theSNR = −13 dB and
SNR = −11 dB respectively are shown in Figs.6and7. Compared with other methods, the IGFCM has better spectrum sensing performance.
Given the number of sampling pointsN = 1000, the
SNR = −15 dB. The simulation results obtained when
the number of SUs is 2, 4, 6, 8, and 10 respectively are as shown in Fig.8. As can be seen from Fig.8, the num-ber of cooperative SUsMhas a great relationship with the detection probability of the algorithm. AsMincreases, the detection probabilities of several algorithms increase to varying degrees.
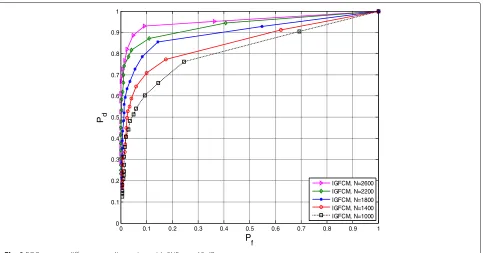
As the number of sampling points increases, the per-ceived signal information is more comprehensive, so the extracted features are more representative. In order to observe the spectral sensing performance of the IGFCM method under different sampling points, keep the simula-tion parametersM= 2 andSNR= −13 dB unchanged. The IGFCM algorithm simulation diagram obtained when the number of sampling points is 1000, 1400, 1800, 2200, or 2600 respectively. As can be seen from Fig.9, the spec-trum sensing performance increases as the number of sampling points increases.
6 Conclusion
In this paper, a spectrum sensing method based on infor-mation geometry and FCM clustering is proposed. In the feature extraction process, a feature extraction method combining split recombination and information geometry is proposed to transform complex signal detection prob-lems into manifolds. Geometric probprob-lems on the indirect analysis of signal detection problems using geometric tools. Finally, the FCM clustering algorithm is used to train the extracted features to obtain a classifier for spec-trum sensing to realize specspec-trum sensing. The perceptual performance of the method described in this paper is fur-ther analyzed in the experimental part. The experimental results show that the method improves the spectrum sensing performance to some extent. In the future work, we will continue to study the application of clustering algorithms in spectrum sensing, such as kernel fuzzy c-means clustering (KFCM) and the scope of possibilistic fuzzy c-means (PFCM). It is hoped that the spectrum sensing performance can be further effectively improved.
Abbreviations
AWGN: Additive white Gaussian noise; CFAR: Constant false alarm rata; CR: Cognitive radio; DAR: Decomposition and recombination; DMEAE: Difference between the maximum eigenvalue and the average energy; DMM: Difference between the maximum eigenvalue and the minimum feature; FCM: Fuzzy c-means; GMM: Gaussian mixture model; I-DAR: Interval decomposition and recombination; IGFCM: A cooperative spectrum sensing method based on information geometry and fuzzy c-means clustering algorithm; KFCM: Kernel fuzzy c-means; MME: Maximum to minimum eigenvalue; NN: Neural network; O-DAR: Order decomposition and recombination; PFCM: The scope of possibilistic fuzzy c-means; PU: Primary user; SNR: Signal-to-noise ratio; SPD: Symmetric positive definite; SU: Secondary user; SVM: Support vector machine
Acknowledgements
The author wants to thank the author’s organization because they have provided us with many conveniences.
Funding
This work was supported in part by special funds from the central finance to support the development of local universities under No. 400170044, the project supported by the State Key Laboratory of Management and Control
for Complex Systems, Institute of Automation, Chinese Academy of Sciences under grant No.20180106, the degree and graduate education reform project of Guangdong Province under grant No.2016JGXM_MS_26, the foundation of key laboratory of machine intelligence and advanced computing of the Ministry of Education under grant No.MSC-201706A and the higher education quality projects of Guangdong Province and Guangdong University of Technology.
Availability of data and materials
The materials are mainly from different journals and conferences, as shown in the references. In the simulation results and performance analysis section, mainly use MATLAB tools to simulate.
Authors’ contributions
SZ provided this idea and wrote the manuscript. YW demonstrated the idea. JL and YZ designed the experiment and conducted the experimental
verification. PW and NL give constructive suggestions for the structure of the paper. All authors read and approved the final manuscript.
Authors’ information
Shunchao Zhang received his B.S. degree in Hunan Institute of Engineering in 2016. He is currently pursuing the M.S. degree in Guangdong University of Technology, Guangdong, China. His research interests include spectrum sensing in cognitive radio.
Yonghua Wang received his B.S. degree in Electrical Engineering and Automation from Hebei University of Technology in 2001, the M.S. degree in Control Theory and Control Engineering from Guangdong University of Technology in 2006, and Ph.D. degree in Communication and Information System from SUN-YAN SEN University in 2009. He now with School of Automation in Guangdong University of Technology.
Jiangfan Li received his B.S. degree in Foshan University in 2016. He is currently pursuing the M.S. degree in Guangdong University of Technology,
Guangdong, China. His research interests include spectrum sensing in cognitive radio.
Pin Wan received his B.S. degree in Electronic Engineering from Southeast University in 1984, the M.S. degree in Circuit and System from Southeast University in 1990, and Ph.D. degree in Control Theory and Control
Engineering from Guangdong University of Technology in 2011. He currently is a professor in School of Automation in Guangdong University of Technology. Yongwei Zhang received his B.S. degree in Jiaying University in 2016. He is currently pursuing the M.S. degree in Guangdong University of Technology, Guangdong, China. His research interests include spectrum sensing in cognitive radio.
Nan Li is currently pursuing the B.S. degree in Guangdong University of Technology, Guangdong, China. Her research interests include spectrum sensing in cognitive radio.
Competing interests
The authors declare that they have no competing interests.
Publisher’s Note
Springer Nature remains neutral with regard to jurisdictional claims in published maps and institutional affiliations.
Author details
1School of Automation, Guangdong University of Technology, Guangzhou
510006, China.2State Key Laboratory of Management and Control for Complex
Systems, Institute of Automation, Chinese Academy of Sciences, Beijing 100190, China.3Hubei Key Laboratory of Intelligent Wireless Communications,
South-Central University for Nationalities, Wuhan 430074, China.
Received: 26 August 2018 Accepted: 4 January 2019
References
1. A. A. Khan, M. H. Rehmani, M. Reisslein, Cognitive radio for smart grids: survey of architectures, spectrum sensing mechanisms, and networking protocols. IEEE Commun. Surv. Tutor.18, 860–898 (2016)
3. K. Cichon, A. Kliks, H. Bogucka, Energy-efficient cooperative spectrum sensing: a survey. IEEE Commun. Surv. Tutor.18, 1861–1886 (2016) 4. N. S. Kim, J. M. Rabaey, A dual-resolution wavelet-based energy detection
spectrum sensing for UWB-based cognitive radios. IEEE Trans. Circ. Syst. I Regular Papers.PP, 1–14 (2017)
5. E. Chatziantoniou, B. Allen, V. Velisavljevic, P. Karadimas, J. Coon, Energy detection based spectrum sensing over two-wave with diffuse power fading channels. IEEE Trans. Veh. Technol.66, 868–874 (2017) 6. X. Zhang, R. Chai, F. Gao, inIEEE Global Conference on Signal and
Information Processing: 09 February 2015; Atlanta. Matched filter based spectrum sensing and power level detection for cognitive radio network (IEEE, Atlanta, 2015), pp. 1267–1270
7. A. Surampudi, inIndia International Conference on Information Processing: 2016. An adaptive decision threshold scheme for the matched filter method of spectrum sensing in cognitive radio using artificial neural networks (IEEE, Doha, 2016), pp. 1–5
8. R. Mahapatra, inIEEE International Symposium on Wireless Communication Systems: 2016;Reykjavik. Cyclostationary detection for cognitive radio with multiple receivers (IEEE, Reykjavik, 2008), pp. 493–497
9. W. Zhang, G. Abreu, M. Inamori, Y. Sanada, Spectrum sensing algorithms via finite random matrices. IEEE Trans. Commun.60, 164–175 (2012) 10. Y. Zeng, Y. C. Liang, Eigenvalue-based spectrum sensing algorithms for
cognitive radio. IEEE Trans. Commun.57, 1784–1793 (2009) 11. C. Liu, in7th International Conference on Wireless Communications,
Networking and Mobile Computing: 2011;Wuhan. A distance-weighed algorithm based on maximum-minimum eigenvalues for cooperative spectrum sensing (IEEE, Wuhan, 2011), pp. 1–4
12. N. Liu, H. S. Shi, B. Yang, D. P. Yuan, Spectrum sensing method based on ME-S-ED. Meas. Control. Technol.35, 125–128 (2016)
13. M. T. Antonia, V. Sergio, Random matrix theory and wireless communications. Commun. Inf. Theory.1, 1–182 (2004)
14. W. Hu, inInternational Conference on Wireless Communications, Networking and Mobile Computing: 26-28 September 2014;Beijing. Cooperative spectrum sensing algorithm based on bistable stochastic resonance (IET, Beijing, 2014), pp. 126–130
15. J. K. Liu, X. S. Wang, W. Tao, Q. U. Long-Hai, Application of information geometry to target detection for pulsed-Doppler radar. J. Natl Univ. Defense Technol.33, 77–80 (2011)
16. Q. Chen, inInternational Conference on Cloud Computing and Security: 16-18 June 2017;Nanjing. Research on cognitive radio spectrum sensing method based on information geometry (IEEE, Nanjing, 2017), pp. 554–564 17. Q. Lu, S. Yang, F. Liu, Wideband spectrum sensing based on Riemannian
distance for cognitive radio networks. Sensors.17, 661 (2017) 18. L. Xiao, Y. Li, G. Han, W. Zhuang, PHY-layer spoofing detection with
reinforcement learning in wireless networks. IEEE Trans. Veh. Technol.65, 10037–10047 (2016)
19. S. P. Maity, S. Chatterjee, T. Acharya, On optimal fuzzy c-means clustering for energy efficient cooperative spectrum sensing in cognitive radio networks. Dig. Signal Proc.49, 104–115 (2016)
20. A. Paul, S.P. Maity, Kernel fuzzy c-means clustering on energy detection based cooperative spectrum sensing. Dig. Commun. Netw.4, 196–205 (2016)
21. V. Kumar, inTwenty Second National Conference on Communication: 4-6 March 2016;Guwahati. K-mean clustering based cooperative spectrum sensing in generalized k-u fading channels (IEEE, Guwahati, 2016), pp. 1–5 22. Y. Zhang, P. Wan, S. Zhang, Y. Wang, N. Li, A spectrum sensing method
based on signal feature and clustering algorithm in cognitive wireless multimedia sensor networks. Adv. Multimedia.2017, 1–10 (2017) 23. K. M. Thilina, K. W. Choi, N. Saquib, E. Hossain, Machine learning
techniques for cooperative spectrum sensing in cognitive radio networks. IEEE J. Sel. Areas Commun.31, 2209–2221 (2013)
24. G. C. Sobabe, inInternational Congress on Image and Signal Processing, Biomedical Engineering and Informatics. A machine learning based spectrum-sensing algorithm using sample covariance matrix (IEEE, Shanghai, 2018), pp. 1–6
25. S. Chatterjee, A. Banerjee, T. Acharya, S. P. Maity, Fuzzy c-means clustering in energy detection for cooperative spectrum sensing in cognitive radio system. Proc. Mult. Access Commun.8715, 84–95 (2014)
26. A. S. Kannan, inInternational Conference on Control Communication and Computing: 13-15 December 2013; Thiruvananthapuram. Performance analysis of blind spectrum sensing in cooperative environment (IEEE, Thiruvananthapuram, 2013), pp. 277–280
27. L. Xiao, J. Liu, Q. Li, N. B. Mandayam, H. V. Poor, User-centric view of jamming games in cognitive radio networks. IEEE Trans. Inf. Forensics Secur.10, 2578–2590 (2015)
28. C. Lenglet, M. Rousson, R. Deriche, O. Faugeras, Statistics on the manifold of multivariate normal distributions: theory and application to diffusion tensor MRI processing. J. Math. Imaging Vis.25, 423–444 (2006) 29. M. Menendez, A differential geometric approach to the geometric mean
of symmetric positive-definite matrices. Siam J. Matrix Anal. Appl.26, 735–747 (2008)
30. M. Menendez, D. Morales, L. Pardo, M. Salicru, Statistical tests based on geodesic distances. Appl. Math. Lett.8, 65–69 (1995)
31. M. Calvo, J. M. Oller, A distance between multivariate normal distributions based in an embedding into the Siegel group. J. Multivar. Anal.35, 223–242 (1991)
32. M. N. Ahmed, S. M. Yamany, N. Mohamed, A. A. Farag, T. Moriarty, A modified fuzzy c-means algorithm for bias field estimation and segmentation of MRI data. IEEE Trans. Med. Imaging.21, 193–199 (2002) 33. D. M. S. Bhatti, inInternational Conference on Information and
Communication Technology Convergence: 18-20 October 2017; Jeju. Fuzzy c-means and spatial correlation based clustering for cooperative spectrum sensing (IEEE, Jeju, 2017), pp. 486–491
34. D. M. S. Bhatti, N. Saeed, H. Nam, Fuzzy c-means clustering and energy efficient cluster head selection for cooperative sensor network. Sensors.