Open Access
Proceedings
Analysis of high-density single-nucleotide polymorphism data: three
novel methods that control for linkage disequilibrium between
markers in a linkage analysis
Kristina Allen-Brady*
1, Benjamin D Horne
1, Alka Malhotra
2, Craig Teerlink
1,
Nicola J Camp
1and Alun Thomas
1Address: 1Department of Biomedical Informatics, University of Utah, 391 Chipeta Way, Suite D, Salt Lake City, Utah 84108, USA and 2Genetic
Basis of Human Disease Division, Translational Genomics Research Institute, 445 North 5th Street, Phoenix, Arizona 85004, USA
Email: Kristina Allen-Brady* - [email protected]; Benjamin D Horne - [email protected]; Alka Malhotra - [email protected]; Craig Teerlink - [email protected]; Nicola J Camp - [email protected]; Alun Thomas - [email protected]
* Corresponding author
Abstract
We performed a multipoint linkage analysis for rheumatoid arthritis (RA) using high-density single-nucleotide polymorphism (SNP) data for chromosome 6 and chromosome 21 using Genetic Analysis Workshop 15 (GAW15) data. These regions were previously shown to have high LOD scores, not accounting for linkage disequilibrium (LD). We propose three novel methods to control for LD in a linkage analysis: allow for LD between markers using graphical modeling, eliminate high-LD markers by principal-component analysis (PCA) using haplotype data, and eliminate high-LD markers by PCA using genotype data. All three novel methods were compared to the previously published SNPLINK high-LD elimination method. Although all four methods verified the previous results, differences in linkage peak height and position were observed across methods. Additional work is required to further understand the effects of LD on linkage results and explore LD control methodology.
Background
The recent availability of rapid, accurate, and relatively low-cost genome-wide, high-density single-nucleotide polymorphism (SNP) panels is changing the study of many complex diseases. Linkage analysis to track inherit-ance of chromosomal regions in pedigrees no longer must rely on highly informative but sparsely spaced conven-tional microsatellite markers. Rather, SNPs, which are far
more abundant than microsatellite markers, have the capacity to yield a higher information content, and hence an improved potential for localizing disease genes [1].
Classical linkage analysis assumes linkage equilibrium between markers. Applying classical linkage packages to genome-wide SNP panels may generate biased results, if parental genotypes are missing, as SNP panels will include from Genetic Analysis Workshop 15
St. Pete Beach, Florida, USA. 11–15 November 2006
Published: 18 December 2007
BMC Proceedings 2007, 1(Suppl 1):S160
<supplement> <title> <p>Genetic Analysis Workshop 15: Gene Expression Analysis and Approaches to Detecting Multiple Functional Loci</p> </title> <editor>Heather J Cordell, Mariza de Andrade, Marie-Claude Babron, Christopher W Bartlett, Joseph Beyene, Heike Bickeböller, Robert Culverhouse, Adrienne Cupples, E Warwick Daw, Josée Dupuis, Catherine T Falk, Saurabh Ghosh, Katrina A Goddard, Ellen L Goode, Elizabeth R Hauser, Lisa J Martin, Maria Martinez, Kari E North, Nancy L Saccone, Silke Schmidt, William Tapper, Duncan Thomas, David Tritchler, Veronica J Vieland, Ellen M Wijsman, Marsha A Wilcox, John S Witte, Qiong Yang, Andreas Ziegler, Laura Almasy and Jean W MacCluer</editor> <note>Proceedings</note> <url>http://www.biomedcentral.com/content/pdf/1753-6561-1-S1-info.pdf</url> </supplement>
This article is available from: http://www.biomedcentral.com/1753-6561/1/S1/S160
© 2007 Allen-Brady et al; licensee BioMed Central Ltd.
markers that are in linkage disequilibrium (LD). LD between markers may inappropriately weight shared hap-lotypes in the likelihood calculations, which can lead to inflated LOD scores, resulting in false-positive evidence of linkage [2]. To overcome the potential bias in a linkage analysis by using SNP data, ideally LD must either be incorporated into the analysis or markers in high LD must be eliminated. The commonly used, freely available SNPLINK [3] program eliminates high-LD SNPs using a simple algorithm between contiguous pairs of SNPs. However, we have previously shown that a non-contigu-ous LD structure is more likely to model the complex pat-tern of recombination and mutation that have been observed to exist in candidate genes [4,5].
Here we propose three novel methods to control for LD between markers in a linkage analysis that do not require a contiguous LD structure: one method that allows for LD between markers using graphical modeling and two meth-ods that eliminate markers in high LD using principal components. Our three novel methods were compared to the previously published analysis generated by the SNPLINK [3] program. We used genome-wide scan data made available for the Genetic Analysis Workshop (GAW15), Problem 2. The North American Rheumatoid Arthritis Consortium (NARAC) provided 5744 SNPs from a genome-wide scan of 757 families, approximately 90% of which were Caucasian. The NARAC Caucasian families were previously analyzed by Amos et al. [6], who found their two highest linkage results on chromosome 6 (LOD = 18.53) and chromosome 21 (LOD = 11.59), not accounting for LD. However, when markers in high LD were eliminated using SNPLINK [3], Amos et al. [6] found that the chromosome 6 peak remained (LOD = 16.14) but the chromosome 21 peak disappeared (LOD = 1.11). By reanalyzing the chromosome 6 and 21 peaks with three novel LD control methods, we verify the previous results and suggest alternative methods for controlling for high LD without requiring contiguous LD structure.
Methods
Details regarding NARAC subject enrollment, phenotype designation, and genotype information are published elsewhere [6]. Using the total 404 SNPs available for chro-mosome 6 and the 104 SNPs available from chrochro-mosome 21, we checked for genotype errors using the software CheckErrors [7], which uses graphical modeling to calcu-late the posterior probability of genotype errors in pedi-grees. For chromosome 6 we eliminated 16 SNPs and for chromosome 21 we eliminated 1 SNP because of errors. We performed a linkage analysis on each of these cleaned files using the multipoint Markov-chain Monte Carlo (MCMC) linkage method MCLINK [8], which computes the robust multipoint TLOD [9] statistic. For each chro-mosome, we identified peak regions (TLOD ≥ 2.0), not
accounting for LD. To ensure that the peak could be resolved in other analyses, we included ~20 SNPs on either side of the peak and called these data our "Com-plete" SNP sets. These linkage results are likely to be biased because of underlying LD as 63.7% of the parents in the data set were not genotyped.
The four methods (i.e., the three novel methods and SNPLINK) were each applied to the "Complete" SNP data files. For the graphical modeling of LD combined with linkage analysis method, we used the new McLink soft-ware http://www-genepi.med.utah.edu/~alun/softsoft-ware/, which we will refer to as McLink-LD in this manuscript. For the three LD elimination methods, we used both the original MCLINK [8] and Merlin [10] software packages to perform the linkage analyses. Allele frequencies were esti-mated from observation of all genotyped individuals at each locus, rather than only the founders. Genotype data was available for only ~15% of the pedigree founders, and because the total number of individuals with genotype data was large (n = 1991 individuals) the estimated allele frequencies from all genotyped individuals provides rea-sonable estimates of the founder allele frequencies, even without adjustment for familial relationships. The origi-nal pedigree structure for all 757 pedigrees was used for all analyses, except for the Merlin analyses, in which 56 large pedigrees were removed because of memory limitations. For the genetic map, we assumed that 1 Mb was equiva-lent to 1 cM. Although this is a simplistic assumption, when inter-marker distances are relatively short and when a dense marker map is used, the assumption has been shown to produce nearly identical linkage results as a more detailed genetic map [11]. We performed a paramet-ric analysis using a dominant model, assuming a minor allele frequency of 0.01 and a penetrance of 0.008, 0.5, and 0.5 for carriers of none, one, and two disease alleles, respectively. Our parametric model results in an overall prevalence rate of 7.5 cases per 1000 individuals, which is consistent with published prevalence rates for rheumatoid arthritis [12].
McLink-LD
initial graphical model is assumed, and given the observed genotypes, an imputation of the haplotypes is made. In the second stage, given the imputed haplotypes a new graphical model is estimated. These stages are iter-ated in a simuliter-ated annealing search for an optimal LD model, and implemented in a program called HapGraph http://www-genepi.med.utah.edu/~alun/software/.
Through application of graphical modeling to the haplo-types of founders in a pedigree, we are able to obtain valid linkage statistics for dense SNP loci without having to dis-card any data. The new McLink-LD software, made availa-ble by Alun Thomas, incorporates the LD model obtained from graphical modeling and computes LOD score statis-tics using MCMC methods similar to those described by Thomas et al. [8] The program also models genotype errors using the approach of Thomas and Camp [15], so that checking for apparent Mendelian segregation is unnecessary. Recombination fractions can be estimated on the interval (0, 1) to take advantage of any potential evidence for linkage and to identify possible model mis-specification. Full details of the method, including use of the program, are given by Thomas [16].
Although McLink-LD can estimate an LD model using a large subset of unrelated individuals and it can also model genotype errors, for consistency with our other LD elimi-nation methods, LD assessment was performed on 100 unrelated, random individuals with genotype data selected from the 757 rheumatoid arthritis families. LD modeling using 100 individuals has been shown previ-ously to be a sufficient sample size to capture the underly-ing genetic variation [17]. All SNPs in the "Complete" SNP sets were included in the analyses. Genotype errors were previously eliminated from these data files. For con-sistency with the other LD methods, the results displayed are over the recombination fraction interval (0, 0.5).
PCA-haplotype method
Principal-component analysis (PCA) has been used for selection of tagging-SNPs for candidate gene studies [4,5]. Advantages of PCA include that the methodology can cap-ture the underlying genetic variation without redundancy, genetic markers are not required to be contiguous, and statistical packages (e.g., SAS, SPSS, STATA) are readily available to perform analyses. Here we apply PCA meth-odology to larger genomic regions of interest using both haplotype data and genotype data. Applying the method to haplotype data, we used the same 100 unrelated, ran-dom individuals as described above as a subset of the total arthritis resource to characterize the LD structure of the regions. We performed pair-wise D' analysis for the 100 independent individuals and all pairs of SNPs in the "Complete" SNP data sets using an in-house modified version of the EMLD [18] software that increases the
number of markers that can be studied at one time. All markers with a D' value ≥ 0.7 and within 2 million base pairs of each other were considered for potential removal due to high LD. These high-LD markers were phased using the software SNPHAP [19], and the resulting haplotypes were entered into PCA. Eigenvalue thresholds were set to capture at least 90% of the genetic variation of extracted factors. For each of the resulting LD groups, the SNP with the highest factor loading (required to be ≥|0.4|) was retained while all other SNPs were eliminated as provid-ing redundant information. Linkage analysis was then performed on the "Complete" SNP set containing all 757 families but modified to only include SNPs with D' < 0.7 and SNPs selected from the PCA analysis.
PCA-genotype method
For the PCA-Genotype method, we also used the same 100 unrelated, random individuals described above to characterize LD. For each SNP we recoded all of the geno-type data from the "Complete" SNP data sets as -1, 0, 1 [20]; corresponding to homozygous wild type (1, 1), het-erozygous [(1, 2) or (2, 1)], or homozygous rare genotype (2, 2), respectively. All of the recoded genotype data were then entered into the two-step PCA analysis method pro-posed by Horne and Camp [17]. The first PCA step was performed as described above for the PCA-Haplotype method. The second PCA step was used to select, among multiple markers in an LD group with a factor loading
≥|0.4|, the marker(s) that best capture(s) the underlying genetic variation. Because more markers are typically included in each LD group in the PCA-Genotype method compared to the PCA-Haplotype method, the two-step rather than the single-step PCA methodology was utilized here. As with the PCA-Haplotype method, we again mod-ified the "Complete" SNP sets for all 757 families to only include markers that were retained from the PCA analysis.
SNPLINK
the chromosome 21 data set would be similar to the out-put of SNPLINK had we been able to obtain it.
Results and Discussion
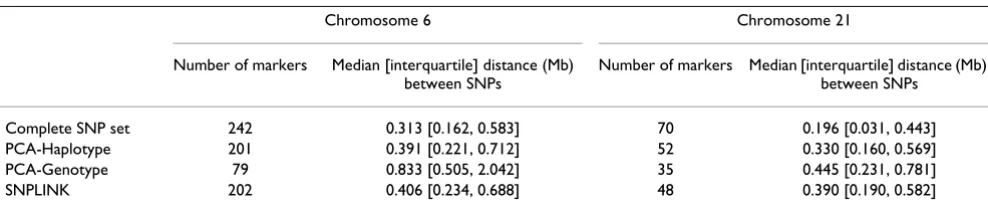
Descriptions of the peak region including the number of markers studied and the median and interquartile dis-tance between markers for the chromosome 6 and 21 regions are displayed in Table 1. The PCA-Genotype method resulted in the fewest number of markers studied. The PCA-Haplotype and SNPLINK methods resulted in a comparable number of markers being studied. The McLink-LD method, as described above, used the "Com-plete" SNP data sets.
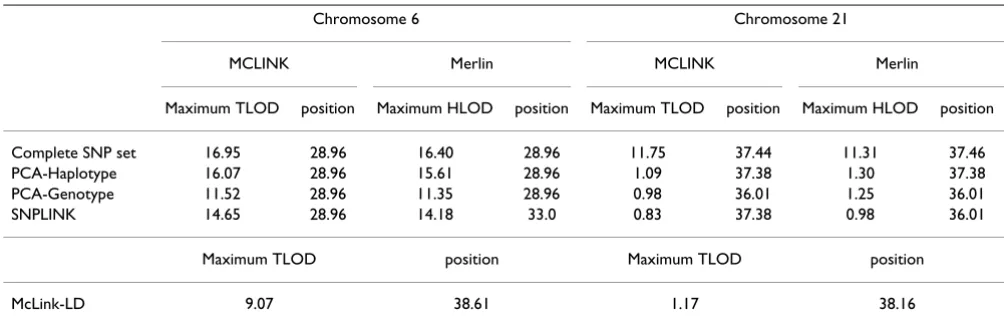
Graphical illustrations of the linkage results are provided for McLink-LD and the LD elimination methods analyzed in MCLINK in Figures 1 and 2. Because the Merlin peak profiles were similar to the MCLINK output, we do not provide a graphical illustration of those results. The max-imum TLOD scores from MCLINK and McLink-LD and the HLOD scores from Merlin are displayed in Table 2.
The linkage results after controlling for LD all consistently verified the conclusions of Amos et al. [6], that is that the chromosome 6 peak is a true-positive result and the chro-mosome 21 peak is a false-positive result. For chromo-some 21, all LD control methods behaved similarly with peak values of ~1.0. However, larger peak differences across methods were observed for chromosome 6 (range: 9.07 to 16.07). Peak position also varied on chromo-somes 6 and 21. For chromosome 6, all methods that removed high-LD SNPs peaked at 28.96 cM, whereas McLink-LD peaked at 38.61 cM. We note that the HLA-DRB1 gene, the best characterized single genetic risk factor contributing to rheumatoid arthritis, maps between two SNPs included in our data sets at 28.96 cM and 33.1 cM, which is the peak location obtained from analysis of the Complete data set and all LD elimination methods. Although here we reported TLOD results as this is cur-rently the only output of McLink-LD, rheumatoid arthritis is a complex disease, and heterogeneity LOD (HLOD) scores may more accurately reflect the true position of a peak. However, it should be noted that the HLOD scores
from Merlin were reported at identical (or nearly identi-cal) peak position values for the three LD-elimination methods using MCLINK at both the chromosome 6 and 21 regions.
While a method that incorporates the underlying LD structure should more accurately reflect the true linkage peak height and position for a chromosomal region, it may be too early to consider McLink-LD the 'gold stand-ard'. MCMC methods can be problematic due to compu-tational requirements and poor mixing properties and it may not be suitable for use in all cases. We note that an additional feature of the new McLink-LD program is max-imization of LOD scores across recombination fractions on the (0, 1) interval. The (0, 1) interval may better be able to incorporate model errors and improve mixing properties of the graphical LD model. Maximizing over the (0, 1) interval, we observed a peak TLOD score of 13.75 at 37.04 cM, which is more similar to the results for the high-LD SNP elimination methods. However, because the high-LD SNP elimination methods all used the tradi-tional (0, 0.5) interval, the comparison is not ideal. We also note that maximization of LOD scores over the (0, 1) interval resulted in general symmetry of the LOD function about a recombination fraction of 0.5. This is most likely due to a heavy reliance on two-generation pedigrees in the GAW15 NARAC data resource with no phase information. Any asymmetry in the chromosome 6 and 21 regions may be due to inadequate modeling of parameters [21] or fail-ure of the sampler to mix between phase states in the few three or more generation families.
The three high-LD elimination methods all peaked at the same position, but with different peak heights. We exam-ined residual LD between all pairs of SNPs for each of the LD elimination methods. Using a threshold for high LD of D' > 0.7, the number of pairs exceeding the threshold was less than 0.7% compared to the total number of pairwise comparisons for each method across both chromosomes, suggesting that the majority of high-LD SNPs pairs were captured. However, we do note that for chromosome 6, although the percentages were small, the number of pairs of SNPs exceeding the threshold tended to follow the
Table 1: Data description across peak regions
Chromosome 6 Chromosome 21
Number of markers Median [interquartile] distance (Mb) between SNPs
Number of markers Median [interquartile] distance (Mb) between SNPs
Complete SNP set 242 0.313 [0.162, 0.583] 70 0.196 [0.031, 0.443]
PCA-Haplotype 201 0.391 [0.221, 0.712] 52 0.330 [0.160, 0.569]
PCA-Genotype 79 0.833 [0.505, 2.042] 35 0.445 [0.231, 0.781]
Chromosome 6 linkage results using the complete SNP set Figure 1
Chromosome 6 linkage results using the complete SNP set.
Chromosome 21 linkage results using the complete SNP set Figure 2
same pattern as the peak TLOD results (i.e., LD threshold pattern: PCA-genotype < PCA-haplotype < SNPLINK). Thus, differences in peak height most likely are due to residual LD in each of the methods. Although not investi-gated here, it is also possible that the PCA-genotype method, which is the most conservative, may have dimin-ished power compared to the other two LD elimination methods as more SNPs were eliminated. The PCA meth-ods provided a logical approach to elimination of SNPs that were not based on a contiguous LD structure or ran-dom elimination of SNPs from a high-LD set as does SNPLINK. Because an automated PCA package for remov-ing high-LD SNPs is yet to be developed, we recommend that PCA be used only for follow-up of regions with at least suggestive linkage evidence.
Conclusion
Control for LD is an essential component of analyzing high-density SNP linkage data, and inflated linkage peaks may result if some method for controlling for LD is not implemented. Because we observed differences in linkage peak height and position across the four methods studied here, further work is needed to explore these and other LD control methods.
Competing interests
The author(s) declare that they have no competing inter-ests.
Acknowledgements
This work was supported by NIH NIGMS grant R21 GM070710 (AT) and CA098364-01 (NC).
This article has been published as part of BMC Proceedings Volume 1 Sup-plement 1, 2007: Genetic Analysis Workshop 15: Gene Expression Analysis and Approaches to Detecting Multiple Functional Loci. The full contents of the supplement are available online at http://www.biomedcentral.com/ 1753-6561/1?issue=S1.
References
1. John S, Shephard N, Liu G, Zeggini E, Cao M, Chen W, Vasavda N, Mills T, Barton A, Hinks A, Eyre S, Jones KW, Ollier W, Silman A, Gib-son N, Worthington J, Kennedy GC: Whole-genome scan, in a complex disease, using 11,245 single-nucleotide polymor-phisms: comparison with microsatellites. Am J Hum Genet
2004, 75:54-64.
2. Huang Q, Shete S, Amos CI: Ignoring linkage disequilibrium among tightly linked markers induces false-positive evidence of linkage for affected sib pair analysis. Am J Hum Genet 2004,
75:1106-1112.
3. Webb EL, Sellick GS, Houlston RS: SNPLINK: multipoint linkage analysis of densely distributed SNP data incorporating auto-mated linkage disequilibrium removal. Bioinformatics 2005,
21:3060-3061.
4. Allen-Brady K, Camp NJ: Characterization of the linkage dise-quilibrium structure and identification of tagging-SNPs in five DNA repair genes. BMC Cancer 2005, 5:99.
5. Camp NJ, Swensen J, Horne BD, Farnham JM, Thomas A, Cannon-Albright LA, Tavtigian SV: Characterization of linkage disequilib-rium structure, mutation history, and tagging SNPs, and their use in association analyses: ELAC2 and familial early-onset prostate cancer. Genet Epidemiol 2005, 28:232-243. 6. Amos CI, Chen WV, Lee A, Li W, Kern M, Lundsten R, Batliwalla F,
Wener M, Remmers E, Kastner DA, Criswell LA, Seldin MF, Gregersen PK: High-density SNP analysis of 642 Caucasian families with rheumatoid arthritis identifies two new linkage regions on 11p12 and 2q33. Genes Immun 2006, 7:277-286. 7. Thomas A: GMCheck: Bayesian error checking for pedigree
genotypes and phenotypes. Bioinformatics 2005, 21:3187-3188. 8. Thomas A, Gutin A, Abkevich V, Bansal A: Multipoint linkage
anal-ysis by blocked Gibbs sampling. Stat Comput 2000, 10:259-269. 9. Abkevich V, Camp NJ, Gutin A, Farnham JM, Cannon-Albright L,
Tho-mas A: A robust multipoint linkage statistic (tlod) for map-ping complex trait loci. Genet Epidemiol 2001, 21(Suppl 1):S492-S497.
10. Abecasis GR, Cherny SS, Cookson WO, Cardon LR: Merlin – rapid analysis of dense genetic maps using sparse gene flow trees. Nat Genet 2002, 30:97-101.
11. Ulgen A, Li W: Comparing single-nucleotide polymorphism marker-based and microsatellite marker-based linkage anal-yses. BMC Genet 2005, 6(Suppl 1):S13.
12. Alamanos Y, Voulgari PV, Drosos AA: Incidence and prevalence of rheumatoid arthritis, based on the 1987 American Col-lege of Rheumatology criteria: a systematic review. Semin Arthritis Rheum 2006, 36:182-188.
13. Thomas A, Camp NJ: Graphical modeling of the joint distribu-tion of alleles at associated loci. Am J Hum Genet 2004,
74:1088-1101.
14. Thomas A: Characterizing allelic associations from unphased diploid data by graphical modeling. Genet Epidemiol 2005,
29:23-35.
Table 2: Maximum TLOD and HLOD scores
Chromosome 6 Chromosome 21
MCLINK Merlin MCLINK Merlin
Maximum TLOD position Maximum HLOD position Maximum TLOD position Maximum HLOD position
Complete SNP set 16.95 28.96 16.40 28.96 11.75 37.44 11.31 37.46
PCA-Haplotype 16.07 28.96 15.61 28.96 1.09 37.38 1.30 37.38
PCA-Genotype 11.52 28.96 11.35 28.96 0.98 36.01 1.25 36.01
SNPLINK 14.65 28.96 14.18 33.0 0.83 37.38 0.98 36.01
Maximum TLOD position Maximum TLOD position
Publish with BioMed Central and every scientist can read your work free of charge "BioMed Central will be the most significant development for disseminating the results of biomedical researc h in our lifetime."
Sir Paul Nurse, Cancer Research UK
Your research papers will be:
available free of charge to the entire biomedical community
peer reviewed and published immediately upon acceptance
cited in PubMed and archived on PubMed Central
yours — you keep the copyright
Submit your manuscript here:
http://www.biomedcentral.com/info/publishing_adv.asp
BioMedcentral
15. Thomas A, Camp NJ: Maximum likelihood estimates of allele frequencies and error rates from samples of related individ-uals by gene counting. Bioinformatics 2006, 22:771-772. 16. Thomas A: Towards linkage analysis with markers in linkage
disequilibrium by graphical modelling. Hum Hered 2007,
64:16-26.
17. Horne BD, Camp NJ: Principal component analysis for selec-tion of optimal SNP-sets that capture intragenic genetic var-iation. Genet Epidemiol 2004, 26:11-21.
18. EMLD [https://cge.mdanderson.org/~qhuang/Software/pub.htm] 19. SNPHAP [http://www-gene.cimr.cam.ac.uk/clayton/software/] 20. Meng Z, Zaykin DV, Xu CF, Wagner M, Ehm MG: Selection of
genetic markers for association analyses, using linkage dise-quilibrium and haplotypes. Am J Hum Genet 2003, 73:115-130. 21. Ott J: Analysis of Human Genetic LinkageBaltimore: The Johns Hopkins