Volume 2008, Article ID 182042,7pages doi:10.1155/2008/182042
Research Article
WCDMA Uplink Interference Assessment from Multiple High
Altitude Platform Configurations
T. Hult,1D. Grace,2and A. Mohammed1
1Department of Signal Processing, Blekinge Institute of Technology, 372 25 Ronneby, Sweden
2Department of Electronics, University of York, York, YO10 5DD, UK
Correspondence should be addressed to T. Hult,[email protected]
Received 2 November 2007; Accepted 13 May 2008
Recommended by Marina Mondin
We investigate the possibility of multiple high altitude platform (HAP) coverage of a common cell area using a wideband code division multiple access (WCDMA) system. In particular, we study the uplink system performance of the system. The results show that depending on the traffic demand and the type of service used, there is a possibility of deploying 3–6 HAPs covering the same cell area. The results also show the effect of cell radius on performance and the position of the multiple HAP base stations which give the worst performance.
Copyright © 2008 T. Hult et al. This is an open access article distributed under the Creative Commons Attribution License, which permits unrestricted use, distribution, and reproduction in any medium, provided the original work is properly cited.
1. INTRODUCTION
Third-generation mobile systems are gradually being deployed in many developed countries in hotspot areas. However, owing to the amount of new infrastructures required, it will still be some time before 3G is ubiquitous, especially in developing countries. One possible cost effective solution for deployments in these areas is to use high altitude platforms (HAPs) [1–9] for delivering 3G (WCDMA) communications services over a wide coverage area [10– 14]. HAPs are either airships or planes that will operate in the stratosphere, 17–22 km above the ground. This unique position offers a significant link budget advantage compared with satellites and much wider coverage area than conventional terrestrial cellular systems. Such platforms will have a rapid rollout capability and the ability to serve a large number of users, using considerably less communications infrastructure than required by a terrestrial network [1]. In order to aid the eventual deployment of HAPs, the ITU has allocated spectrum in the 3G bands for HAPs [15], as well as in the mm-wave bands for broadband services at around 48 GHz worldwide [16] and 31/28 GHz for certain Asian countries [17].
Spectrum reuse is important in all wireless commu-nications systems. Cellular solutions for HAPs have been examined in [18, 19], specifically addressing the antenna beam characteristics required to produce an efficient cellular
structure on the ground, and the effect of antenna sidelobe levels on channel reuse plans [19]. HAPs will have relatively loose station-keeping characteristics compared with satel-lites, and the effects of platform drift on a cellular structure and the resulting intercell handover requirements have been investigated [20]. Cellular resource management strategies have also been developed for HAP use [21].
Configurations of multiple HAPs can also reuse the spectrum. They can be used to deliver contiguous coverage and must take into account coexistence requirements [11, 12]. A technique not widely known is their ability to serve the same coverage area reusing the spectrum to allow capacity enhancement. Such a technique has already been examined for TDMA/FDMA systems [22–24]. In order to achieve the required reduction in interference needed to permit spectrum reuse, the highly directional user antenna is used to spatially discriminate between the HAPs. The degree of bandwidth reuse and resulting capacity gain is dependent on several factors, in particular the number of platforms and the user antenna sidelobe levels.
In addition to the spectral reuse benefits, there are three main benefits for a multiple HAP architecture as follows.
(i) The configuration also provides for incremental rollout: initially only one HAP needs to be deployed. As more capacity is required, further HAPs can be brought into service, with new users served by newly deployed HAPs.
(ii) Multiple operators can be served from individual HAPs, without the need for complicated coexistence criteria since the individual HAPs could reuse the same spectrum.
(iii) HAPs will be payload power, volume and weight constrained, limiting the overall capacity delivered by each platform. Capacity densities can be increased with more HAPs. Moreover, it may be more cost effective to use much lower capability HAPs [25] (e.g., solar powered planes), rather than one big HAP (e.g., solar powered airship), when covering a large number of cells.
The paper is organised as follows: in Section 2 the mul-tiple HAP scenario is explained. The interference analysis is presented in Section 3. In Section 4, we examine the completely overlapping coverage area case, different numbers of platforms, and simulation results showing the achievable capacity enhancement are presented. Finally, conclusions are presented inSection 5.
2. MULTIPLE HAP SYSTEM SETUP
In this paper, we use a simple geometric positioning of the high altitude platforms to create signal environments that can easily be compared and analysed. In each constellation, the HAPs are located with equal separation along a circular contour, as shown inFigure 1.
The separation distance dm along the line from the vertical projection of the HAP on the ground to the cell centre is varied from 70 km to zero (i.e., all the HAPs will be located on top of each other in the latter case).
All HAPs in this paper are assumed to be flying in the stratosphere at an altitude of 20 km. The size of the coverage area assigned to each HAP is governed by the shape of the base station antenna pattern. If we assume that we only have one cell per HAP, then the coverage area is also synonymous with the total cell area of the HAP.
2.1. User positioning geometry
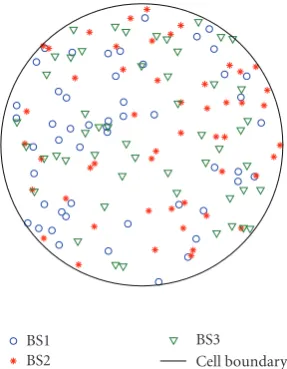
Each user equipment (UE) is positioned inside the cell according to an independent uniform random distribution over the cell coverage area with radius R, as shown in Figure 2. The position of each UE inside each cell is defined relative to the HAP base station that it is connected to and also relative to every other HAP borne base station. This is necessary in order to evaluate the impact of interference between the different UE-HAP transmission paths.
HAPCOS HAPCOS
R θm
dm
Figure1: An example of a system simulation setup withN = 2 HAPs with overlapping cells of radiusR.dmis the distance on the
ground between the cell centre and the vertical projection of the HAP on the ground andθmis the elevation angle towards the HAP.
BS1 BS2
BS3
Cell boundary
Figure2: A plot showing a sample distribution of 150 UE, where 50 UEs are assigned to each of the three base stations (BS1, BS2, and BS3).
2.2. Base station antenna pattern
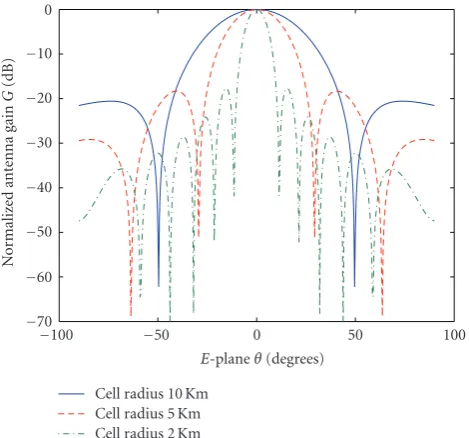
The base station antenna pattern for the simulations was chosen to be simple but detailed enough to show the effects of the main and sidelobes, especially in the null directions, as illustrated in Figure 3. A simple rotationally symmetric pattern based on a Bessel function is used for this purpose, and is defined by [26]
G(ϕ)≈0.7·
2·J1
70π/ϕ3 dB) sin(ϕ
sin(ϕ)
2
, (1)
whereJ1 is a Bessel function of the first kind and order 1,
ϕ3 dBis the 3 dB beam width in degrees of the main antenna
lobe. The 3 dB beam width of the antenna is computed from the desired cell radius according to
ϕ3 dB=2·atan
cellradius HAP altitude
. (2)
2.3. User equipment antenna pattern
−70
E-planeθ(degrees) Cell radius 10 Km
Cell radius 5 Km Cell radius 2 Km
Figure3: HAP base station antenna patterns for different cell radii.
station. Using this assumption, we only need to set the desired maximum gain of the UE antenna we want to use, as shownTable 1. The antenna pattern of the directive antennas is calculated according to (1), but with a fixed maximum gain Gmax instead of a fixed main beamwidth, the beamwidth is
thenϕ(Gmax).
2.4. UE-HAP radio propagation channel model
In this paper, we use the combined empirical fading model (CEFM) together with the free space loss (FSL) model. CEFM combines the results of the empirical roadside shadowing (ERS) model [27] for low-elevation angles with the high-elevation angle results from [28] for the L and S bands. Using the FSL model, the path loss from UEnto HAP base stationmis given by
lFSL
where dm,n is the line of sight distance between the UE n and HAPm. The receiverGrx
m,nand transmitterGtxm,nantenna gain patterns are calculated using (1) and (2). The carrier frequency fc used in the simulation is 1.9 GHz which gives a wavelength λ of 0.1579 meters. The CEFM fading loss associated to HAPmis calculated as
Lf
θm
=a·loge(p) +b[dB], (4)
where p is the percentile outage probability, and the data fitting coefficientsaandbare calculated according to [27]
a=0.002·θ2
m−0.15·θm−0.7−0.2·fc,
b=27.2 + 1.5·fc−0.33·θm,
(5)
whereθmis the elevation angle of HAPm. The total channel
Table1: Antenna gains used in the simulation setup.
User equipment Maximum antenna gain [dBi]
Mobile phone 0
Data terminal 2, 4, 12
gain from UEnto HAPmis then given by
The different service parameters used in this paper are collected from the 3GPP standard [29] and are summarised in Table 2. In order to account for the relative movement between the UE and the base stations, a fading propagation channel model based on (6) is simulated. This results in a block error rate (BLER) requirement of 1% for the 12.2 kbps voice service and a BLER of 10% for 64, 144, and 384 kbps data packet services, respectively.
3. INTERFERENCE ANALYSIS
Assuming that we have a setup ofMdifferent HAPs covering the same cell area and N users connected to each HAP, we can denote each UE position as (xm,n,ym,n), wheren = {1, 2,. . .,N} and m = {1, 2,. . .,M}. An example of a scenario setup with N = 50 and M = 3 is shown in Figure 2. The maximum powerptx
m,nthat the user in location (xm,n,ym,n) is transmitting is dependent of the type of service used and can be obtained fromTable 2. In WCDMA systems, power control is a powerful and essential method exerted in order to mitigate the near-far problem. The power received at base station (HAP)mfrom usernis
prxm,n
is the total link gain, as defined in (6), between UE transmitter n and its own cell’s BS receiver m. To be able to maintain a specific quality of service, we need to assert that we maintain a good enough signal-to-interference-plus-noise ratio (SINR) level. FromTable 2, we can see the requiredEb/N0 values for different services, and
we can express the required SINR,γm,nfor usernat HAP base
whereRis the data rate of the service andWis the “chip rate” of the system. The required SINR can then be expressed as
Table2: WCDMA service parameters employed in the simulation.
Parameters Type of service
Voice Data Data Data
Chip rate,W 3.84 Mcps
Data rate,R 12 kbps 64 kbps 144 kbps 384 kbps
RequiredEb/N0 11.9 dB 6.2 dB 5.4 dB 5.8 dB
MaximumtxPower,ptx
m,n 125 mW (21 dBm) 125 mW (21 dBm) 125 mW (21 dBm) 250 mW (24 dBm)
Voice activity 0.67 1 1 1
which can be formulated as
γreqi = is the additive white Gaussian noise (AWGN) at the receiver, where γreqm,n ⇒ γireq, gm,n(θm) ⇒ gk(θm), gm,n(θm) ⇒
gi(θm), and pmtx,n(θm)⇒pktx(θm) are performed according
to the index mapping rules in (9b). To solve for the transmitter power ptx
k of each of the K individual UE simultaneously, (9b) can be reformulated into a matrix form as
ptx=(I−A)−1b, (10)
where the calculated vector ptx contains the necessary transmitter power level assigned to each of theKUE to fulfil the SINR requirement and where matrix [A]K×K and vector [b]K×1are defined as multiplication andgis the total channel gain vector [gk]K×1
for allk= {1, 2,. . .,K}users, then all elements in the vector
ptx for each block that contain the UE of each of the M cells are balanced. The total cell interference can then be
calculated as interference from the UE within the own cellm, andIoth
m (θm) is the interference from the UE in the M −1 other cells, whereMis the total number of cells. We can now calculate iUL
θm
which defines the other to own interference ratio for the uplink to HAPmand is given by
iUL
This is a performance measure of the simulated system capacity at a specific elevation angleθm towards the HAP (see Figure 1). If iUL
θm
is between zero and one, there is possibility to have multiple HAP base stations covering the same coverage area. The actual number of users that can access the HAP base stations is also dependent of which data rate each user is using for transmission.
4. SIMULATION RESULTS
In this simulation, we assume thatM HAPs are uniformly located along a circular boundary, with the centre of the circular boundary acting as the pointing direction of the HAPs base station antennas which simulate several overlap-ping cells; seeFigure 1. The beamwidth of these base station antennas is determined by the radius of the cell coverage area (see Figures1and2).
The aim of the simulation is to assess the effect of adding more HAPs on the system capacity. The distancedmbetween the cell centre and the vertical projection of the HAP on the earth surface is denoted as “distance on the ground” and is varied from 0 to 70 km with a fixed cell position, as shown inFigure 4. The distance to the cell centre is also changing the elevation angleθm towards the HAP base stationmas seen from the user. The cell radius has been set to 10 km and 30 km, and the HAP altitude is 20 km. Each HAP base station serves 100 users within each corresponding cell.
HAPCOS
R θm
dm
Figure4: A plot illustrating the change of HAP positiondmto create different elevation anglesθm.
0 0.2 0.4 0.6 0.8 1 1.2 1.4 1.6 1.8
Other
to
o
w
n
int
erfer
enc
e
ratio
iUL
0 10 20 30 40 50 60 70
Distance on the grounddm(Km)
2 HAPs 3 HAPs
4 HAPs 5 HAPs (a)
0 0.2 0.4 0.6 0.8 1 1.2 1.4 1.6
Other
to
o
w
n
int
erfer
enc
e
ratio
iUL
0 10 20 30 40 50 60 70
Distance on the grounddm(Km)
2 HAPs 3 HAPs
4 HAPs 5 HAPs (b)
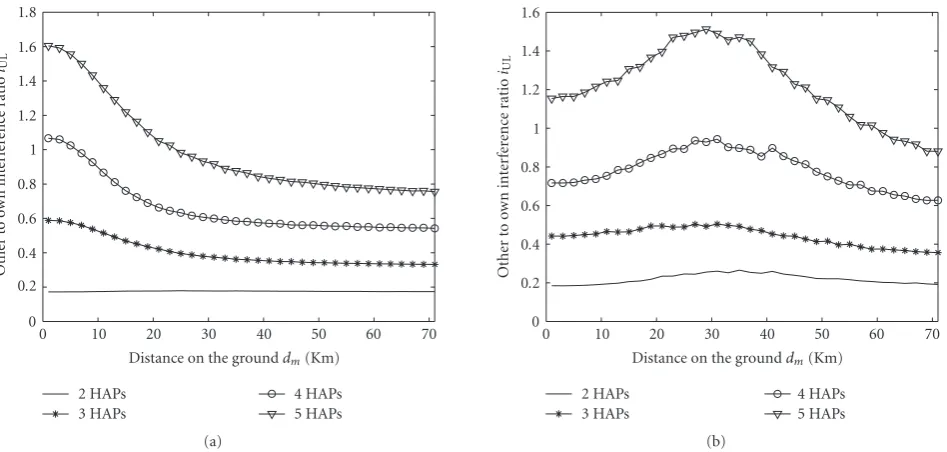
Figure5: The performance of the voice service (12 kbps) from one HAP in combination with the data service (384 kbps) on the remaining HAPs for cell radius of 10 km (a) and 30 km (b). The distance on the grounddmis varied from 0 to 70 km.
are stacked on top of each other at 90 degrees elevation angle from the cell centre (i.e., at a distancedm on the ground of 0 km). In the larger cell radius case (30 m), the worst case scenario happens approximately at 30 km which is at the edge of the cell.
Comparing Figure 5(b) with the two diagrams in Figure 6, we can see that if we utilize a maximum allowed other-to-own interference ratio equal to one, then as the service data rate decreases, the number of possible HAP base stations covering the same area can increase from 2–4 HAPs (depending on the distancedm between the cell centre and the vertical projection of the HAP on the ground) for the combined service (12 kbps and 384 kbps) to 6 HAPs with the same service (12 kbps on all HAPs). It is also clear from Figure 6 that the worst case distance (highest interference level) is at approximately 30 km, and consequently a worst case elevation angle of 34 degrees. This maximum interfer-ence level depends on the cell radius chosen for the HAP base
station as shown inFigure 7. Simulations have shown that for cell radii larger than 10 km the maximum interference level will occur at the cell boundary.
5. CONCLUSIONS
0.1
Distance on the grounddm(Km)
5 HAPs
Distance on the grounddm(Km)
6 HAPs
Figure6: The other-to-own interference ratio obtained for a 30 km cell radius for (a) the performance of the voice service (12 kbps) from one HAP in combination with the data service (144 kbps) on the remaining HAPs and (b) the performance when we have voice services (12 kbps) on all HAPs. The distance on the grounddmis varied from 0 to 70 km.
0
Distance on the grounddm(Km)
50 Km 30 Km 20 Km
10 Km 5 Km
Figure 7: Illustrating the effect of HAP base station cell radius on interference levels. A system of 3 HAPs is utilized here and a voice service (12 kbps) from one HAP in combination with the data service (384 kbps) on the other HAPs. The distance on the ground
dmis varied from 0 to 70 km.
ACKNOWLEDGMENTS
This work has been developed as part of a short-term scientific mission at the University of York, UK, and organised through COST 297 (http://www.hapcos.org/). The funding of the European Community and the hospitality of University of York is greatly acknowledged.
REFERENCES
[1] R. Steele, “Guest editorial—an update on personal communi-cations,”IEEE Communications Magazine, vol. 30, no. 12, pp. 30–31, 1992.
[2] D. Grace, N. E. Daly, T. C. Tozer, A. G. Burr, and D. A. J. Pearce, “Providing multimedia communications services from high altitude platforms,”International Journal of Satellite
Communications, vol. 19, no. 6, pp. 559–580, 2001.
[3] G. M. Djuknic, J. Freidenfelds, and Y. Okunev, “Establishing wireless communications services via high-altitude aeronau-tical platforms: a concept whose time has come?” IEEE
Communications Magazine, vol. 35, no. 9, pp. 128–135, 1997.
[4] M. J. Collela, J. N. Martin, and I. F. Akyildiz, “The HALO networkTM,”IEEE Communications Magazine, vol. 38, no. 6, pp. 142–148, 2000.
[5] T. C. Tozer and D. Grace, “High-altitude platforms for wireless communications,”Electronics & Communication Engineering
Journal, vol. 13, no. 3, pp. 127–137, 2001.
[6] J. Thornton, D. Grace, C. Spillard, T. Konefal, and T. C. Tozer, “Broadband communications from a high-altitude platform: the European HeliNet programme,”Electronics &
Communication Engineering Journal, vol. 13, no. 3, pp. 138–
144, 2001.
[7] D. Grace, M. H. Capstick, M. Mohorcic, J. Horwath, M. B. Pallavicini, and M. Fitch, “Integrating users into the wider broadband network via high altitude platforms,”IEEE Wireless
Communications, vol. 12, no. 5, pp. 98–105, 2005.
[8] R. Miura and M. Oodo, “Wireless communications system using stratospheric platforms,”Journal of the Communication
Research Laboratory, vol. 48, no. 4, pp. 33–48, 2001.
[9] J.-M. Park, B.-J. Ku, Y.-S. Kim, and D.-S. Ahn, “Technol-ogy development for wireless communications system using stratospheric platform in Korea,” inProceedings of the 13th IEEE International Symposium on Personal, Indoor and Mobile
Radio Communications (PIMRC ’02), vol. 4, pp. 1577–1581,
[10] F. Dovis, R. Fantini, M. Mondin, and P. Savi, “Small-scale fading for high-altitude platform (HAP) propagation channels,”IEEE Journal on Selected Areas in Communications, vol. 20, no. 3, pp. 641–647, 2002.
[11] Y. C. Foo, W. L. Lim, and R. Tafazolli, “Performance of high altitude platform station (HAPS) in delivery of IMT-2000 W-CDMA,” inProceedings of the Stratospheric Platform Systems
Workshop, Tokyo, Japan, September 2000.
[12] E. Falletti, M. Mondin, F. Dovis, and D. Grace, “Integration of a HAP within a terrestrial UMTS network: interference analy-sis and cell dimensioning,”Wireless Personal Communications, vol. 24, no. 2, pp. 291–325, 2003.
[13] S. Masumura and M. Nakagawa, “Joint system of terrestrial and high altitude platform station (HAPS) cellular for W-CDMA mobile communications,”IEICE Transactions on
Com-munications, vol. E85-B, no. 10, pp. 2051–2058, 2002.
[14] M. A. V´azquez-Castro, D. Belay-Zelek, and A. Curieses-Guerrero, “Availability of systems based on satellites with spatial diversity and HAPS,”Electronics Letters, vol. 38, no. 6, pp. 286–288, 2002.
[15] Recommendation ITU-R M.1456, “Minimum performance characteristics and operational conditions for high altitude platform stations providing IMT-2000 in the bands 1885– 1980 MHz, 2010–2025 MHz and 2110–2170 MHz in the regions 1 and 3 and 1885–1980 MHz and 2110–2160 MHz in region 2,” International Telecommunications Union, 2000. [16] Recommendation ITU-R F.1500, “Preferred characteristics
of systems in the fixed service using high-altitude platform stations operating in the bands 47.2–47.5 GHz and 47.9– 48.2 GHz,” International Telecommunications Union, 2000. [17] M. Oodo, R. Miura, T. Hori, T. Morisaki, K. Kashiki, and
M. Suzuki, “Sharing and compatibility study between fixed service using high altitude platform stations (HAPS) and other services in the 31/28 GHz bands,” Wireless Personal
Communications, vol. 23, no. 1, pp. 3–14, 2002.
[18] B. El-Jabu and R. Steele, “Cellular communications using aerial platforms,”IEEE Transactions on Vehicular Technology, vol. 50, no. 3, pp. 686–700, 2001.
[19] J. Thornton, D. Grace, M. H. Capstick, and T. C. Tozer, “Optimizing an array of antennas for cellular coverage from a high altitude platform,” IEEE Transactions on Wireless
Communications, vol. 2, no. 3, pp. 484–492, 2003.
[20] J. Thornton and D. Grace, “Effect of lateral displacement of a high-altitude platform on cellular interference and handover,”
IEEE Transactions on Wireless Communications, vol. 4, no. 4,
pp. 1483–1490, 2005.
[21] D. Grace, C. Spillard, J. Thornton, and T. C. Tozer, “Channel assignment strategies for a high altitude platform spot-beam architecture,” in Proceedings of the 13th IEEE International Symposium on Personal, Indoor and Mobile Radio
Communi-cations (PIMRC ’02), vol. 4, pp. 1586–1590, Lisbon, Portugal,
September 2002.
[22] D. Grace, J. Thornton, G. Chen, G. P. White, and T. C. Tozer, “Improving the system capacity of broadband services using multiple high-altitude platforms,”IEEE Transactions on
Wireless Communications, vol. 4, no. 2, pp. 700–709, 2005.
[23] G. Chen, D. Grace, and T. C. Tozer, “Performance of multiple high altitude platforms using directive HAP and user antennas,”Wireless Personal Communications, vol. 32, no. 3-4, pp. 275–299, 2005.
[24] Y. Liu, D. Grace, and P. D. Mitchell, “Effective system spectral efficiency applied to a multiple high-altitude platform system,”
IEE Proceedings: Communications, vol. 152, no. 6, pp. 855–860,
2005.
[25] D. Grace and P. Likitthanasate, “A business modelling approach for broadband services from high altitude plat-forms,” in Proceedings of the International Conference on
Telecommunications (ICT ’06), Madeira, Portugal, May 2006.
[26] C. A. Balanis,Antenna Theory: Analysis and Design, chapter 6, John Wiley & Sons, New York, NY, USA, 1997.
[27] J. Goldhirsch and W. J. Vogel, “Propagation effects for land mobile satellite systems: overview of experimental and model-ing results,” NASA Reference Publication 1274, February 1992. [28] M. A. N. Parks, G. Butt, B. G. Evans, and M. Richharia, “Results of multiband (L, S, Ku band) propagation mea-surements and model for high elevation angle land mobile satellite channel,” inProceedings of the 17th NASA Propagation Experimenters Meeting (NAPEX 17) and the Advanced Com-munications Technology Satellite (ACTS) Propagation Studies
Miniworkshop, pp. 193–202, Pasadena, Calif, USA, June 1993.