The aim of this paper was to assess the availability of RTK GPS (Real-Time Kinematic Global Positioning Systems) under some challenging environmental conditions. Testing was performed under two of these condi-tions, i.e. a small tree-covered garden and a pylon for high-voltage electricity supply. The increase in the number of satellites had many benefits for the integer ambiguity resolution, but no significant contribution to the accuracy of RTK positions and PDOP (Precision Dilution of Position). The results of RTK testing were compared against results from Total Station surveying as a further quality check. The results indicate that integrating RTK GPS system with Total Station is favoured for surveying in urban environments.
Key words:RTK-GPS, Total Station surveying, urban environments, garden, pylon.
1.
Introduction
Global Positioning Systems (GPS) have become more and more important for Earth science (e.g. disaster monitor-ing), geodesy, land surveying, cadastral surveying and mar-itime surveying, etc. But unfortunately, on their own, they do not guarantee the centimetre level of accuracy (Martinet al., 2000).
For scientific applications of GPS, a static GPS is now widely utilized, especially for geophysical phenomena, by measuring the carrier phase of a GPS signal. It is expected that highly accurate static positioning measurements will be useful for detecting the motion of tectonic plates and predicting earthquakes and volcanic processes. GPS can also be used to measure the precipitable water vapour from propagation delay of GPS satellite signals (Yoshiharaet al., 2000). Atmospheric sensing is possible through the real-time GPS networks (Wareet al., 2000).
To achieve more accurate coordinates of positions, dif-ferential GPS technique is required, which allows even cen-timetre level accuracy in positioning using the so-called in-teger ambiguity resolution technique. The basic concept of differential technique is to mitigate the main error sources, such as ionospheric and tropospheric delay, orbit errors and satellite clock errors by receiving satellite signals at a well-known location. All common errors between base receiver and the rover unit are cancelled out (Landauet al., 2001).
Nowadays, this differential technique is used in real time as well as in post-processing of data. And real-time data transfer is routinely possible, which enables real time com-putation of baseline vectors (Hofmann-Wellenhof et al., 1997) and has led to the Real-Time Kinematic (RTK) tech-nique.
Copyright cThe Society of Geomagnetism and Earth, Planetary and Space Sci-ences (SGEPSS); The Seismological Society of Japan; The Volcanological Society of Japan; The Geodetic Society of Japan; The Japanese Society for Planetary Sci-ences; TERRAPUB.
This paper focuses on assessing the availability of RTK GPS for Earth science under some challenging environmen-tal conditions.
2.
Earth Surveying Methods
2.1 RTK GPS
In the 1980’s and early 1990’s, results from all GPS sur-veys were only available after the survey had been com-pleted and the data post-processed. Post-processing pro-vides robust baseline estimates as all measurements can be manipulated a number of times using least squares estima-tion techniques. The restricestima-tions of post-processing from the surveyors perspective are that field checks and setouts cannot be performed (Timothy and George, 1999).
RTK GPS is the dynamic GPS positioning technique us-ing short observation time; this system provides precise re-sults in real time. To achieve higher positioning accura-cies (decimeter or centimeter level) in real time, the double differencing technique should be implemented using carrier phase data.
Carrier phase-based positioning relies on the ability to eliminate, or significantly reduce the common measurement biases across observations made simultaneously by ground receivers to the ensemble of visible GPS satellites. If GPS observations made by a receiver to several satellites are differenced, the receiver dependent biases are eliminated (principally the receiver clock bias).
Furthermore, the pseudo-range measurements are made using the C/A code on the L1 carrier. The same procedure may be applied to carrier phase measurements (which can be made on either the L1 or L2 carrier), to yield in metric units, a similar relation: Where is carrier phase measurement, λ is the
Fig. 1. RTK GPS.
length (L1 or L2), N is a constant representing the un-known integer ambiguity, ν, lower measurement noise. Note that∇Nkisq, the double-differenced ambiguity term is an integer. The noise of the double-differenced phase observable is less than one centimeter (Rizos, 1999). The use of double-differenced carrier phase is problematic be-cause any data processing scheme must ensure the estima-tion of two classes of parameters: (a) the baseline parame-tersxki, yki, zki(contained within the geometric range termρsqki), and (b) the ambiguity parameter∇Nkisq (for each pair of independent satellites s, q). Once the ambigu-ities have been resolved, all carrier phase data can be con-verted to a range-like observable, which can be used for precise (centimeter-level) instantaneous positioning.
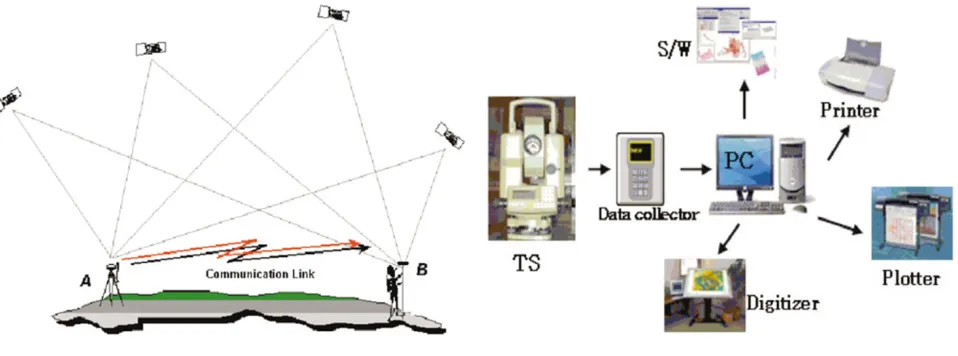
There are an increasing number of applications for high precision carrier phase based positioning, for machine and vehicle guidance and control. Nowadays kinematic carrier phase based positioning can be carried out in real-time if an appropriate communications link is provided over which the carrier phase data collected at a static base receiver can be made available to the rover receiver’s onboard computer to generate the double-differences, resolve the ambiguities and perform the position calculations (Rizos, 1999). This is defined as “Real Time Kinematic” (RTK) GPS positioning. Figure 1 presents a graphical overview of RTK GPS.
2.2 Total Station surveying
In the past, a slat and a rope ruler, Electromagnetic Dis-tance Meter (EDM), and Total Station (TS) were used in Earth surveying. But there is a range of shortcomings, e.g., time consuming, laborious and costly, and the need for a di-rect line of sight. TS is one of the representative and popular equipments in ground surveys. Generally, distance is mea-sured by EDM, and angle, by Transit or Theodolite, but TS can deliver these combined functions. Nowadays, compu-tation and drawing in batch processing could be done with TS. The application tools of TS were shown in Fig. 2.
3.
Case Study 1—At a Garden
3.1 Field observations
In order to assess RTK GPS under various environmental conditions, a test site was surveyed twice, once in the winter and once in the spring. Herein, RTK1 refers to performance
Fig. 2. Application tools of Total Station.
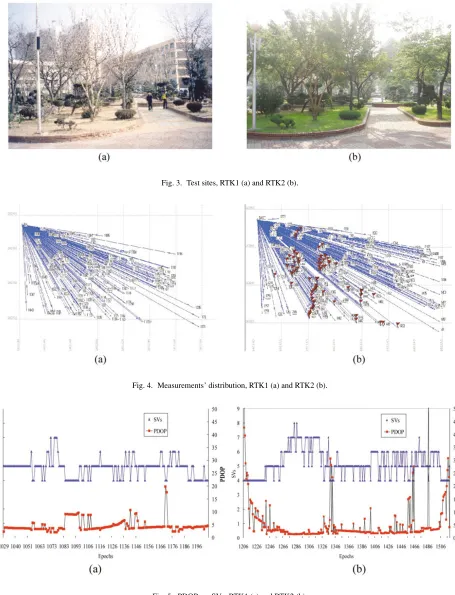
assessment carried out in the winter and RTK2, that in the spring. Figure 3 presents a photograph of a test site taken in the winter and in the spring. In the winter, trees were naked of their leaves and in the spring, full of green foliage.
For this campaign, GPS equipment consisted of a pair of Trimble dual-frequency 4700SSi receivers with firmware allowing RTK GPS observations. The manufacturer’s spec-ifications for GPS receivers in horizontal component are
±(20 mm+2 ppm RMS) (single frequency), ±(5 mm+1 ppm RMS) (double frequency) in static mode, and ±(20 mm+2 ppm RMS) in RTK GPS mode when more than 5 satellites are tracked for at least 2 epochs. And to estab-lish a robust wireless data broadcast network for real-time, high-precision GPS, the proper radio modem is required. The optimal and typical ranges of TRIMTALK 450S radio modem utilized in this study are 10 km and 3–5 km respec-tively.
On the other hand, TS, Leica TC-1000 model has the accuracy of the order of 1 second in angle measurement and±(2 mm+2 ppm RMS) in distance measurement. TS surveying was carried out to check the performance of RTK GPS.
The area of the test site is 5881.043 m2. The maximum distance between base and the other end of a test site is about 147.643 m. And the number of observables collected through the data collector, TSC1, made by Trimble Naviga-tion Limited, is 178 (RTK1) and 314 (RTK2).
3.2 Processing and analysis
This section deals with the accuracy of positions mea-sured, the variation of Position Dilution of Precision (PDOP) with respect to the number of satellite visible. Fig-ure 4 presents the distribution of RTK1 and RTK2 measFig-ure- measure-ments.
Fig. 3. Test sites, RTK1 (a) and RTK2 (b).
Fig. 4. Measurements’ distribution, RTK1 (a) and RTK2 (b).
Fig. 5. PDOP vs. SVs, RTK1 (a) and RTK2 (b).
fixed solutions (47.77%).
To obtain the fixed solutions of integer ambiguity, at least 5 satellites must be tracked and the quality of signals from satellites also have to be favourable.
Hence, because a good geometry were maintained in RTK2 during the surveyed time, these results were very likely.
Mean RMS errors in horizontal and vertical components
Fig. 6. RMS vs. Epochs, RTK1 (a) and RTK2 (b).
Fig. 7. RMS, PDOP vs. SVs, RTK1 (a) and RTK 2 (b).
Table 1. Accuracy of points.
CASE\ACCURACY Horizontal Vertical Mean RMS (m) Mean RMS (m)
RTK1 1.069 1.848
RTK2 0.786 1.490
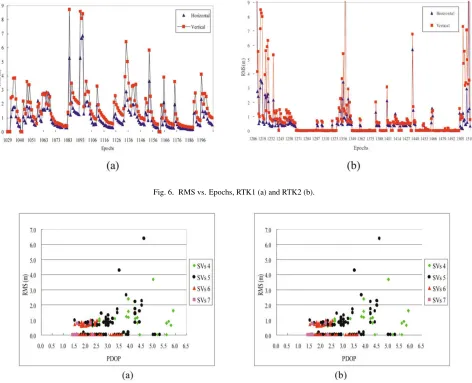
Secondly, the variation of PDOP with respect to the num-ber of visible satellites tracked was investigated. Dilution of Precision (DOP) is a measure of the quality of the GPS data being received from the satellites and is a mathematical representation for the quality of the GPS position solution. The main factors affecting DOP are the number of satellites tracked and where these satellites are positioned in the sky. As shown in Fig. 5, the average number of visible satel-lites in RTK1 and RTK2 was 4.85 and 5.22 and PDOP, 5.2 and 5.41 respectively. Variation of PDOP in RTK2 was rather more turbulent than that in RTK1, although more satellites in RTK2 were tracked (Timothy and George, 1999). Table 1 contains the accuracy of points in horizontal and vertical components.
Figure 6 indicates the RMS in horizontal and vertical components according to epochs. Figure 6(a) showed a
big variation (where the RMS of points changes unsteadily) than that of Fig. 6(b), even though trees lose their leaves in the winter. Especially big jumps in RMS were shown at the initial, the middle, and the end part of epochs in RTK2. These were due to GPS rover unit located near and/or under trees with a massive amount of foliage.
Figure 7 (a) and (b) present the RMS, PDOP, versus the number of satellites. These figures show no significant correlation between the RMS and the number of satellites. This is also as is the similar case with PDOP.
In the above, the relation between the number of visible satellites, PDOP and the accuracy were analysed.
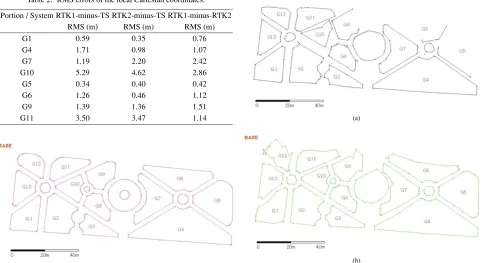
At this stage, garden maps of a test site made by TS and RTK system were shown in Fig. 8 and 9. The procedure for these works is as follows:
• Downloading the local Cartesian coordinate of points from each system’s storage memory to PC,
• Editing the data using commercially available Com-puter Aided design (CAD) package, and
• Drawing the garden map.
por-Fig. 8. A garden map by TS.
tions of a garden map derived from TS. The gardens map of Fig. 9(b) looked alike that of Fig. 8, except for some por-tions.
But, still many mismatches remained on some portions (e.g., G9, G12, and G13) of Fig. 8 and 9(b). Even though many satellites in RTK2 were tracked, in some portions, such as G8 and G10, PDOP was very high and float solution of integer ambiguity often occurred.
Additionally, a radio link was interrupted now and then, even though the base-rover separation was within 100 m. So this could result in Single Point Positioning (SPP) using code only because rover did not obtain any kinds of observ-ables from the base station.
Lastly, three garden maps based on the same coordinate frame were overlapped (Fig. 10) and then, the local Carte-sian coordinates of overlapped portions using CAD package were extracted. Local Cartesian coordinates extracted were not included in this paper due to limited space.
Table 2 shows only RMS errors of the difference of lo-cal Cartesian coordinates between three systems, that is, RTK1, RTK2, and TS. Mean RMS errors of RTK1-minus-TS, RTK2-minus-RTK1-minus-TS, and RTK1-minus-RTK2 were 2.811 m, 2.245 m, and 1.767 m respectively. These large errors might be caused due to the degradation of the accuracy of positioning by RTK test, with all kinds of factors being mixed together. And large RMS errors of coordinate dif-ferences between each system occurred at several portions of the garden map such as G4, G7, G9, G10, and G11.
4.
Case Study 2—At an Electric Power Pylon
4.1 Field Observations
A test site was selected, considering the possibility of the detection of the factors affecting the accuracy of RTK GPS. Figure 11 shows two electric power pylons. Among them,
Fig. 9. Garden maps from RTK1 (a) and RTK2 (b).
Fig. 10. Overlapped maps from TS, RTK1 and RTK2 surveys.
one has 43 meters of vertical clearance above the ground, 154 kV in voltage, and has no obstructions to blockade tracking the signal of GPS satellites (Fig. 11(a)), and the other, 22 m in height, the same voltage as previous one, but was surrounded with a few trees (Fig. 11(b)). The distance between two electric pylons is about 150 meters.
These experiments consisted of three categories as fol-lowings: (i) static GPS, (ii) RTK GPS, and (iii) TS survey-ing. And for these campaigns, the same type of GPS and TS system used in Case study1 was used.
In the static GPS, 14 stations were established near the two electric power pylons.
Fig. 11. Electric power pylons, a static GPS, Pylon -A (a) and Pylon-B (b).
Fig. 12. Electric power pylon, RTK GPS (Pylon-B).
Two stations were used as base stations during the sub-sequent static GPS and TS surveying. A total of seven ses-sions were observed with continuous observations at two stations. Each session was approximately 20 minutes long with 15-seconds epoch interval in static mode. And at least 4 satellites were tracked throughout the surveyed time. Fig-ure 11 illustrates the overview of a static GPS implemen-tation on spot. Currently, GPS antenna was located at the center of both pylons in Fig. 11.
4.2 GPS data processing and adjustment
Baseline and network adjustment was processed using a commercially available GPS software with following set-ting: a cut-off angle of 15 (deg), troposphere model, Hop-field; ionosphere model, standard L1 and L2 linear phase combination; ephemeris, broadcast; data type, code and phase L1+L2. Figure 13(a) presents the baseline overview of a static GPS and the diagram of network adjustment.
For the purpose of RTK test, GPS receivers were set at 1-second epoch rate with a cut-off angle of 15 (deg). Observations at the rover unit were made manually using the TDC1 data collector. And one of two stations used in a static GPS and TS surveying was utilized as the base station throughout the surveyed time. Observations were
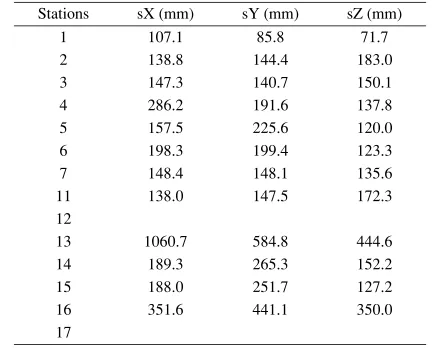
Table 3. RMS errors of adjusted coordinates in WGS-84 coordinate frame.
Stations sX (mm) sY (mm) sZ (mm)
1 107.1 85.8 71.7
2 138.8 144.4 183.0
3 147.3 140.7 150.1
4 286.2 191.6 137.8
5 157.5 225.6 120.0
6 198.3 199.4 123.3
7 148.4 148.1 135.6
11 138.0 147.5 172.3
12
13 1060.7 584.8 444.6
14 189.3 265.3 152.2
15 188.0 251.7 127.2
16 351.6 441.1 350.0
17
conducted by occupying the other stations around the pylon in sequence. Generally, it took 10 to 30-seconds per one station to obtain the fixed or floating solution of carrier phase integer ambiguity.
Figure 12 shows the overview of RTK GPS implementa-tion on spot. Currently, GPS antenna was located at staimplementa-tion, about 5 m away from one of pillars of pylon in Fig. 11(b).
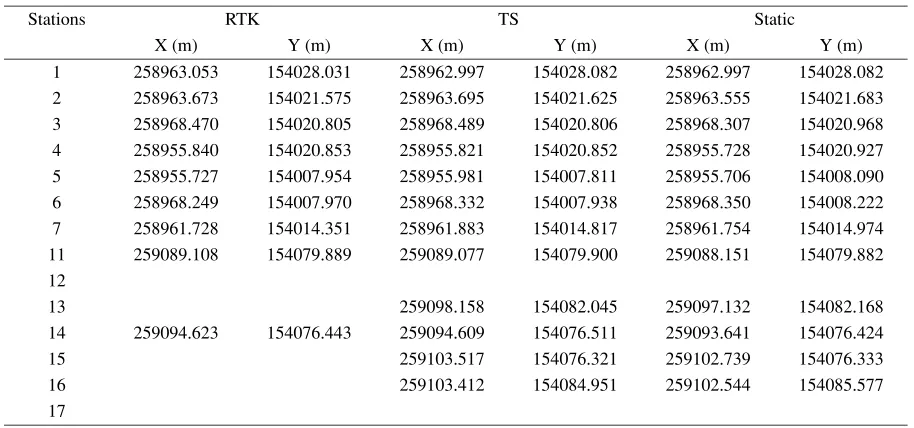
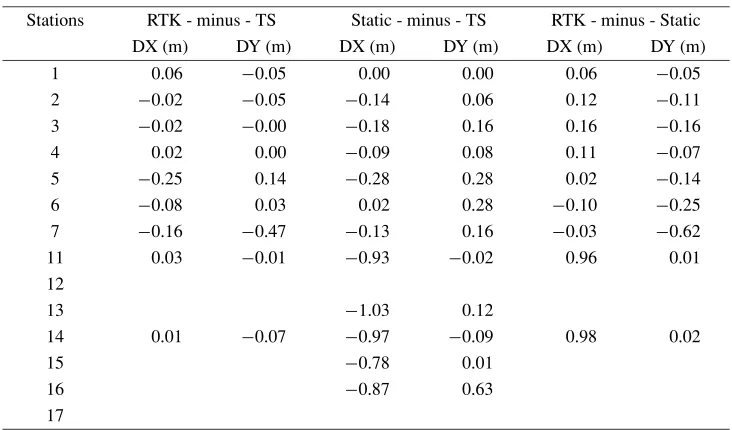
Table 3 contains RMS errors of adjusted coordinates of stations in WGS-84 coordinate frame. In Table 3, station 1 to 7 had best accuracy of decimeter level in X, Y and Z components in WGS-84 coordinate frame, but not so, in stations 11 to 17. Especially, stations 12 and 17 were not adjusted in the network, leading to no values in Table 3. This might be attributed to the interference of satellite signal due to tree canopy and the electric power pylon itself. Table 4 contains the local Cartesian coordinates obtained from RTK, a static GPS, and TS surveying and Table 5 shows the coordinate differences in horizontal components between RTK, a static GPS, and TS surveying.
RTK-minus-TS had the average coordinate differences of
Fig. 13. Baseline processing (a) and network adjustment (b).
Fig. 14. Location diagram from RTK (), Static GPS (), and TS (2) for Pylon-A (a) and Pylon-B (b).
Table 4. Comparison of local Cartesian coordinates.
Stations RTK TS Static
X (m) Y (m) X (m) Y (m) X (m) Y (m)
1 258963.053 154028.031 258962.997 154028.082 258962.997 154028.082
2 258963.673 154021.575 258963.695 154021.625 258963.555 154021.683
3 258968.470 154020.805 258968.489 154020.806 258968.307 154020.968
4 258955.840 154020.853 258955.821 154020.852 258955.728 154020.927
5 258955.727 154007.954 258955.981 154007.811 258955.706 154008.090
6 258968.249 154007.970 258968.332 154007.938 258968.350 154008.222
7 258961.728 154014.351 258961.883 154014.817 258961.754 154014.974
11 259089.108 154079.889 259089.077 154079.900 259088.151 154079.882
12
13 259098.158 154082.045 259097.132 154082.168
14 259094.623 154076.443 259094.609 154076.511 259093.641 154076.424
15 259103.517 154076.321 259102.739 154076.333
16 259103.412 154084.951 259102.544 154085.577
17
location diagram of the stations computed from RTK (), a static GPS (), and TS (2). In Pylon-A, RTK, a static GPS and TS surveying showed the similar coordinates of positions at each station 1–7 (Table 4).
But at stations 11–16 around Pylon-B, RTK was
13 −1.03 0.12
14 0.01 −0.07 −0.97 −0.09 0.98 0.02
15 −0.78 0.01
16 −0.87 0.63
17
carrier phase more accurately and stably.
Large differences between Static GPS and TS surveying occurred at stations 15 and 16. These could be attributed to the lack of the number of satellites being tracked at that moment and the interference of satellite signal due to tree canopy and electric power pylon itself (Alsalman, 2001).
5.
Conclusions
This paper dealt with the performance assessment of RTK GPS at small garden under the urban environments, in two different seasons, and underneath the electric power pylon surrounded by tree canopy. In addition, Total Station surveying as ground truth was conducted at the same time.
In Case study 1, the analysis of result showed that many satellites were tracked during the surveyed time, although a test site was full of a mass of green foliage in the spring, except for under the tree canopy and/or very close to build-ings. And it was proven that the number of satellites tracked had no significant influence on the position accuracy and PDOP.
In Case study 2, electric power pylon surveying was suc-cessfully performed in Static GPS, but not so good in RTK GPS. But, in open area, RTK GPS is expected to be very useful tool for electric power pylon surveying.
The two case studies highlighted the weakness of RTK GPS due to e.g. the blockage of satellite signals near the buildings and/or under the tree canopy. Therefore, the usage of RTK GPS will be dependent on the applications, the error tolerance of the applications, and the size of fields.
Acknowledgments. This work was supported by the Post-doctoral Fellowship Program of Korea Science & Engineering Foundation (KOSEF).
References
Alsalman, A. S. A., Effects of electric power lines on the accuracy of GPS positioning,Survey Review,36, 279, 54–61, 2001.
Hofmann-Wellenhof, B., H. Lichtenegger, and J. Collins,GPS: Theory and Practice, pp. 100–138, Springer-Verlag, Wien New York, 1997. Landau, H., U. Vollath, A. Deking, and C. Palels, Virtual reference Station
Networks - Recent Innovations by Trimble, Technical Paper, Trimble Terrasat GmbH, November, pp. 1–14, 2001.
Martin, S. and C.-H. Jahn, Experiences in set-up and usage of a geodetic real-time differential correction network, LETTER,Earth Planet Space, 52, 851–855, 2000.
Rizos, C., GPS enhancements, inNotes on Basics GPS Positioning and Geodetic Concepts, edited by C. Rizos, School of Surveying and Spatial Information, University of New South Wales, pp. 15–16, electronic version, 1999.
Timothy, R. L. and P. G. George, The Influence of the Number of Satel-lites on the Accuracy of RTK GPS Positions,THE AUSTRALIAN SUR-VEYOR, Vol. No. 1, 64–70, 1999.
Ware, R. H., D. W. Fulker, S. A. Stein, D. N. Anderson, S. K. Avery, R. D. Clark, K. K. Droegemeier, J. P. Kuettner, J. Minster, and S. Soroosh, Real-time national GPS networks: Opportunities for tmospheric sens-ing,Earth Planets Space,52, 901–905, 2000.
Yoshihara, T., T. Tsuda, and K. Hirahara., High time resolution measure-ments of precipitable water vapor from propagation delay of GPS satel-lite signals,Earth Planets Space,52, 479–493, 2000.