ANALYTICAL METHOD DEVELOPMENT AND VALIDATION FOR THE SIMULTANEOUS
ESTIMATION OF EMTRICITABINE AND TENOFOVIR BY REVERSED-PHASE HIGH
PERFORMANCE LIQUID CHROMATO
GRAPH
Y IN BULK AND TABLE
T DOSAGE FORMS
SUFIYAN AHMAD
1*, Md. RAGEEB Md. USMAN
21Department of Quality Assurance, Gangamai College of Pharmacy, Nagaon, Dhule, Maharashtra, India. 2Department of Pharmacognosy,
Smt. S. S. Patil Chopda College of Pharmacy, Chopda, Maharashtra, India. Email: [email protected] Received: 05 June 2017, Revised and Accepted: 11 July 2017
ABSTRACT
Objective: Asimple rapid, accurate, precise, and reproducible validated reversed-phase high performance liquid chromatography method was developed for the determination of emtricitabine (EMB) and tenofovir (TEN) in bulk and tablet dosage forms.
Methods: The quantification was carried out using symmetry Premsil C18 (250 mm×4.6 mm, 5 µm) Younglin (S.K.) gradient way using mobile phase comprising of methanol:water (70:30 v/v) pH 3 and a detection wavelength of 273 nm, and injection volume of 20 µL, with a flow rate of 1 ml/minutes.
Results: In the developed method, the retention time of EMB and TEN were found to be 3.1667 minutes and 7.5000 minutes. The developed method was validated according to the International Conference on Harmonization (ICH) guidelines.
Conclusion: The linearity, precision, range, robustness was within the limits as specified by the ICH guidelines. Hence, the method was found to be simple, accurate, precise, economic, and reproducible. Hence, it is worthwhile that the proposed methods can be successfully utilized for the routine quality control analysis EMB and TEN in bulk drug as well as in formulations.
Keywords: Emtricitabine and tenofovir, Method development, Validation, Simultaneous estimation, High performance liquid chromatography.
INTRODUCTION
Emtricitabine (EMB) and tenofovir (TEN) are antiretroviral drugs used for the treatment of Human Immune Syndrome [1]. Forstavir - EM is the combination of the two drugs containing 150 mg of EMB and 300 mg of TEN. EMB is chemically 4-Amino-5-fluoro-1-[2-(hydroxyl methyl)-1, 3-oxathiolan-5-yl]-pyrimidin-2-one [2,3]. It is a nucleoside reverse transcriptase inhibitor (Fig. 1). Chemically TEN is 1-(6-aminopurin-9-yl)-prapan-2-yl-oxymethylphosphonic acid [3,4]. It is a nucleotide analogue reverse transcriptase inhibitor (Fig. 2). Extensive literature survey revealed that only liquid chromatography mass spectroscopy (LC-MS/MS) and reversed-phase high performance liquid chromatography (RP-HPLC) [5,6] methods for the determination of EMB and TEN in human plasma, RP-HPLC [7] for determination of TEN in plasma, LC/MS/ MS for determination of plasma TEN concentrations [8], LC-MS method for determination of plasma TEN concentrations [9], and HPLC with fluorimetric detection for determination of EMB in human plasma [10] have been reported so far. There is no evidence of determination of the drug combination by HPLC. Thus, this study is to develop simple, precise, and accurate HPLC methods for the quantification of EMB and TEN in combined dosage form.
METHODS
Reagents and materials
The analysis of the drug was performed on Youngline (S.K.) gradient system ultraviolet (UV) detector. Equipped with Reverse Phase (premsil) c18 column (4.6 mm×250 mm; 5 µm), a SP930D pump, a 20 µl injection loop and UV730D Absorbance detector and running autochro-3000 software.
EMB and TEN in the form of gift samples were kindly supplied by R. S. I. T. C, Jalgaon. AR grade methanol used for HPLC method and methanol: Water (0.1% orthophosphoric acid [OPA]), prepared in
solvent double distilled water was used as solvent throughout the study. A combination of EMB (20 mg) and TEN (30 mg) in tablet formulation was procured from local pharmacy (Travin-EM, Emcure Pvt., Ltd).
Chromatographic conditions
Column C18 (250 mm×4.6 mm); particle size packing 5 µm; detection wavelength 271 nm; flow rate 0.5 ml/minutes; temperature ambient; sample size 20 µl; mobile phase acetonitrile: Water (0.05% OPA with pH 3) (50+50% v/v); run time 10 minutes.
Preparation of standard stock solution
Preparation of standard EMB solution: (Stock I)
From the freshly prepared standard stock solution (1000 μg/ml), 0.1 ml
stock solution was pipette out in 10 ml of volumetric flask and volume was made up to 10 ml with mobile phase to get final concentration of
10 μg/ml(Fig. 3).
Preparation of standard TEN solution: (Stock II)
From the freshly prepared standard stock solution (1000 μg/ml), 0.1 ml
stock solution was pipette out in 10 ml of volumetric flask and volume was made up to 10 ml with mobile phase to get final concentration
10 μg/ml (Fig. 4).
Preparation of standard EMB and TEN solution: (Stock III) From the freshly prepared standard stock solution (1000 μg/ml), 0.1 ml
stock solution was pipette out in 10 ml of volumetric flask and volume was made up to 10 ml with mobile phase to get final concentration
10 μg/ml. In the standard mixture of EMB and TEN theoretical plates
(TP) were found above 2000, i.e., for EMB 4085.3 and TEN 11229.0 at minimum retention time (RT) 3.1667 and 7.500, respectively (Fig. 5 and Table 1).
© 2017 The Authors. Published by Innovare Academic Sciences Pvt Ltd. This is an open access article under the CC BY license (http://creativecommons. org/licenses/by/4. 0/) DOI: http://dx.doi.org/10.22159/ajpcr.2017.v10i11.20477
Method development and validation
Working standard of concentrations was prepared by taking aliquots of standard solution and diluted to get required concentration for calibration plot and which was injected [11,12].
Assay preparation for commercial formulation
Weigh 20 EMB and TEN combination tablets weigh 14.98 g and calculated the average weight of powder 0.749 g accurately weigh and transfer the sample equivalent to 49.93 mg EMB and TEN into 10 ml volumetric flask. Add about 10 ml methanol of diluents and sonicate to dissolve it completely and make volume up to the mark with diluents. Mix well and filter through 0.45 µm filter. Further pipette 0.1 ml of the
above stock solution into a 10 ml volumetric flask and dilute up to the mark with diluents. (10 µg/ml). The simple chromatogram of test EMB and TEN shown in Fig. 6. The amounts of EMB and TEN per tablet were calculated by extrapolating the value of area from the calibration curve. Analysis procedure was repeated five times with tablet formulation. Analysis of marketed formulation was also % Label Claim was found to be 99-101% satisfactory are concluded (Table 2).
RESULTS
Linearity and range
The data obtained in the calibration experiments when subjected to linear regression analysis showed a linear relationship between peak areas and concentrations in the range 10-50µg/ml for EMB and 15-75 µg/ml for TEN (Tables 3 and 4]depict the calibration data of EMB and TEN The respective linear equation for EMB was y=62.06x+0.546 and TEN equation y=47.73x+55.11 where x is the concentration and y is area of peak. The correlation coefficient was 0.999. The calibration curve of EMB and TEN is depicted in Figs. 7 and 8.
Accuracy
It is defined as closeness of agreement between the actual (true) value and analytical value and obtained by applying test method for a number of times. The accuracy of the methods was determined at three different concentration levels, i.e. ,80%, 100%, and 120% (Figs. 9-11) in triplicate for each drug as per International Conference on Harmonization guidelines. From the total amount of drug found, the percentage recovery was fond in range of 99-101% (Tables 5 and 6).
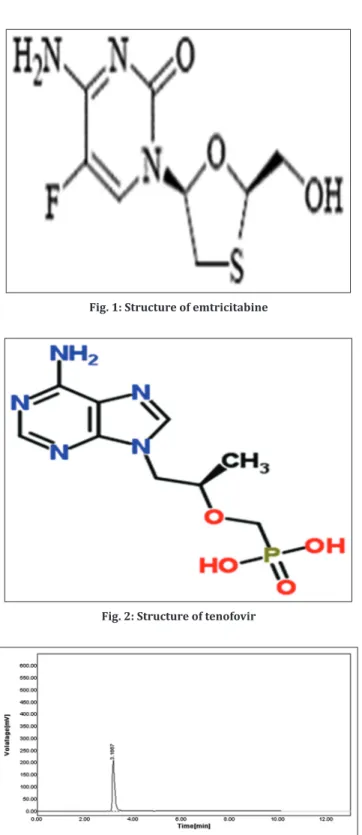
Fig. 1: Structure of emtricitabine
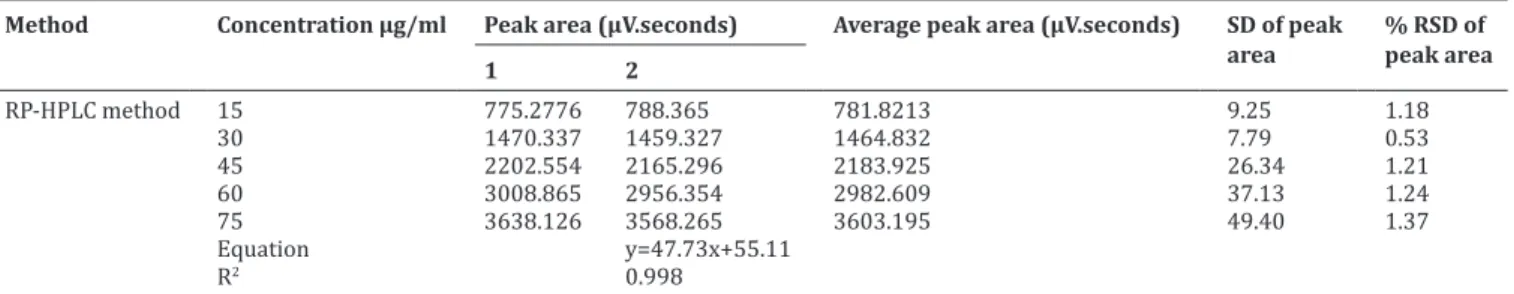
Fig. 2: Structure of tenofovir
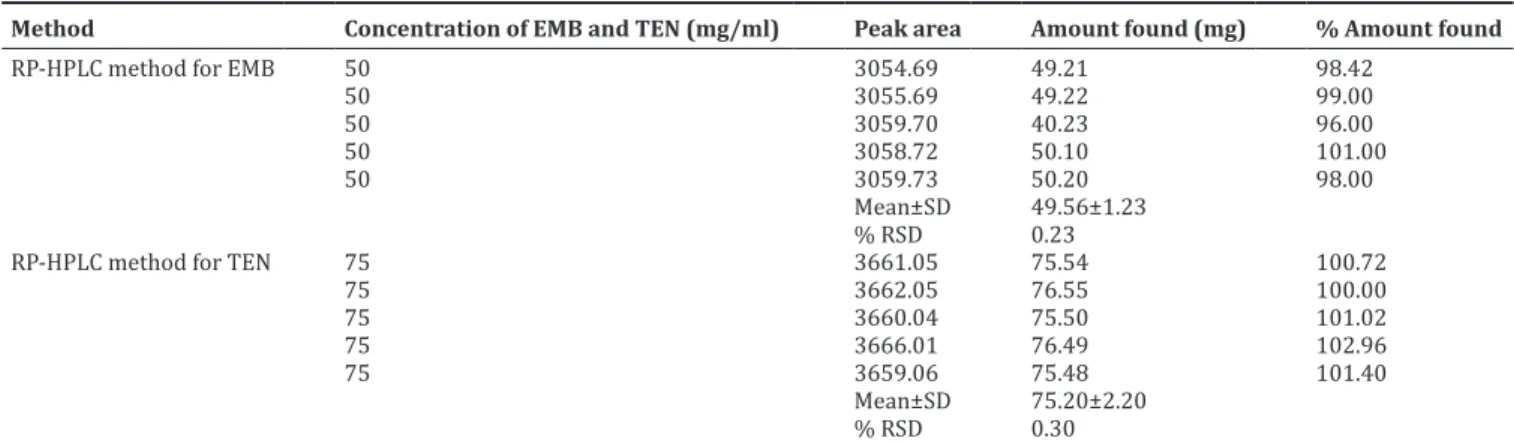
Fig. 3: Chromatogram of standard emtricitabine
Fig. 4: Chromatogram of standard tenofovir
Fig. 5: Chromatogram of standard combination of emtricitabine
and tenofovir
Table 1: Details of chromatogram of standard combination containing EMB and TEN
RT
(minutes) Area (mV*s) Area (%) TP TF Resolution 3.1667 1470.3370 54.64 4085.3 1.3333 0.0000 7.5000 1220.3994 45.36 11229.0 1.1667 15.2941
2690.7363
Precision
Precision was studied to find out intra- and interday variations in the test method of EMB and TEN. Intraday precision was determined by analyzing three concentration in three replicate measurements of
within linearity range of drugs on three different times in the same day. Interday precision was conducted during routine operation of the system over a period of 3 consecutive days. Intra- and Interday
Table 2: Analysis of marketed formulation
Assay Drug Label claimed Amount found % Label claim SD % RSD
RP-HPLC method EMB 10 9.90 99.0 0.15 0.37
TEN 15 15.28 101.87 0.13 0.27
EMB 10 10.11 101.10 0.27 0.27
TEN 15 15.09 100.60 0.34 0.27
EMB: Emtricitabine, TEN: Tenofovir, SD: Standard deviation, RSD: Relative standard deviation, RP-HPLC: Reversed-phase high performance liquid chromatographic, RT: Retention time
Table 3: Linearity data for EMB
Method Concentration µg/ml Peak area (µV. seconds) Average peak
area (µV.seconds) SD of peak area % RSD of peak area
1 2
RP-HPLC method 10 623.5154 600.25 611.8876 16.44 2.69
20 1220.399 1298.35 1259.379 55.13 4.38
30 1819.49 1902.35 1860.924 58.60 3.15
40 2441.527 2498.36 2469.947 40.19 1.63
50 3050.95 3168.26 3109.607 82.95 2.67
Equation y=62.06x+0.546
R2 0.999
RP-HPLC: Reversed-phase high performance liquid chromatographic, RSD: Relative standard deviation, SD: Standard deviation, EMB: Emtricitabine
Fig. 6: Chromatogram for marketed formulation
Fig. 7: Calibration curve of emtricitabine
Fig. 8: Calibration curve of tenofovir
Fig. 9: Chromatogram of accuracy 80%
Fig. 10: Chromatogram of accuracy 100%
precision studies on HPLC method for EMB and TEN which shows the high precision % amount in between 98% and 100% indicates to analytical method that concluded (Table 7 and Figs. 12-14).
Limit of detection (LOD) and limit of quantification (LOQ) LOD is the lowest amount of analyte in a sample that can be detected but not necessarily quantify under the stated experimental conditions. LOQ is the lowest concentration of analyte in a sample that can be determined with the acceptable precision and accuracy under stated experimental conditions.
Robustness
The robustness is measure of its capacity to remain unaffected by small and deliberate variations in method parameters and provides an indication of its reliability during normal usage; hence, the following are performed by slight variations in parameters. The changes were did flow rate (±1 ml/minute−1), pH of mobile phase composition
(±1 ml/minute−1), and Wavelength (±1 ml/minute−1). % relative
standard deviation (RSD) for peak area was calculated which should be <2%. The result is shown in Tables 8 and 9.
Repeatability
Repeatability studies on HPLC method for EMB and TEN were found to be, the % RSD was <2%, which shows high percentage amount found in
Table 4: Linearity data for TEN
Method Concentration µg/ml Peak area (µV.seconds) Average peak area (µV.seconds) SD of peak
area % RSD of peak area
1 2
RP-HPLC method 15 775.2776 788.365 781.8213 9.25 1.18
30 1470.337 1459.327 1464.832 7.79 0.53
45 2202.554 2165.296 2183.925 26.34 1.21
60 3008.865 2956.354 2982.609 37.13 1.24
75 3638.126 3568.265 3603.195 49.40 1.37
Equation y=47.73x+55.11
R2 0.998
RP-HPLC: Reversed-phase high performance liquid chromatographic, SD: Standard deviation, RSD: Relative standard deviation, TEN: Tenofovir
Table 5: Recovery data for EMB and TEN
Method Drug Level (%) Amount taken (μg/ml) Amount added (μg/ml) Mean*±SD
Absorbance Amount recovered % Recovery RP-HPLC
method EMB 10080 2010 1020 35.99±0.2739.94±0.30 15.99±0.2720.58±0.30 99.96±1.7099.72±1.48
120 20 24 43.85±0.27 23.85±0.27 101.58±1.15
TEN 80 30 24 54.20±0.42 24.20±0.42 100.8±1.75
100 30 30 60.46±0.34 20.58±0.34 101.5±1.74
120 30 36 66.40±0.30 36.40±0.30 101.5±0.84
*Mean of each 3 reading for RP-HPLC method. RP-HPLC: Reversed-phase high performance liquid chromatographic, SD: Standard deviation, EMB: Emtricitabine, TEN: Tenofovir
Table 6: Statistical validation of recovery studies EMB and TEN
Method Level of
recovery (%) Drug Mean % recovery SD* % RSD RP-HPLC
method 80 EMTRITENO 99.96100.83 1.701.75 1.701.74
100 EMTRI 99.72 1.48 1.49
TENO 101.53 1.74 1.12
120 EMTRI 101.58 1.15 1.93
TENO 101.58 0.84 0.84
*Denotes average of three determinations for RP-HPLC.
RP-HPLC: Reversed-phase high performance liquid chromatographic, SD: Standard deviation, RSD: Relative standard deviation, EMB: Emtricitabine, TEN: Tenofovir
Fig. 12: Chromatogram of precision
Fig. 13: Chromatogram intraday precision
between 98% and 102% indicates the analytical method that concluded (Table 10).
DISCUSSION
The proposed method utilize two medium, i.e., methanol + water (acetic acid 0.1% [OPA]) (70: 30%) v/v) 273 nm, 1.0 ml, pH 3.0 gave adequate RT at 3.166 minutes and 7.500 minutes with good peak shape (TP of 4085.3of EMB and 11229.0 of TEN. The values of % RSD are within the prescribed limit of 2%, showing high precision of methods and recovery was close to 100% for both the drugs. The comparison of method with already published two methods shows that the developed method is more accurate and economic as compared to other two methods further the method complies
with detection of drugs as per their label claim also no further derivatization or modification in spectra is required so the proposed method can be said as simple accurate and economic as compared to other published method.
CONCLUSION
The developed HPLC methods were found to be more accurate, precise, and reproducible. The analysis of tablets containing two drugs gave the satisfactory results. The statistical parameter of these methods showed good results. The recovery studies revealed excellent accuracy and high precision of the method. The methods were found to be simple and timesaving. All proposed methods could be applied for routine analysis in quality control laboratories.
Table 8: Robustness study of EMB
Parameters Concentration (µg/ml) Amount of detected (mean±SD) % RSD
Chromatogram of flow change 0.9 ml 50 2544.24±39.39 1.55
Chromatogram of flow change 1.1 ml 50 2331.6±21.55 0.92
Chromatogram of composition change 69 ml MEOH+21 ml water 50 1113.7±17.27 1.55
Chromatogram of composition change 71 ml MEOH+37 ml water 50 1182±2002 1.69
Chromatogram of composition change wavelength change 272 nm 50 3135.9±33.46 1.07
Chromatogram of composition change wavelength change 274 nm 50 3016.2±21.10 0.70
RSD: Relative standard deviation, SD: Standard deviation, EMB: Emtricitabine
Table 9: Robustness study of TEN
Parameters Concentration (µg/ml) Amount of detected (mean±SD) % RSD
Chromatogram of flow change 0.9 ml 75 3487.84±30.90 0.89
Chromatogram of flow change 1.1 ml 75 3547.77±30.24 0.85
Chromatogram of composition change 69 ml MEOH+21 ml water 75 1154.7±12.50 1.08
Chromatogram of composition change 71 ml MEOH+37 ml water 75 1282.80±20.02 1.56
Chromatogram of composition change wavelength change 272 nm 75 3628.8±23.31 0.64
Chromatogram of composition change wavelength change 274 nm 75 3562.41±51.13 1.44
RSD: Relative standard deviation, SD: Standard deviation, TEN: Tenofovir
Table 10: Repeatability studies on RP‑HPLC for EMB and TEN
Method Concentration of EMB and TEN (mg/ml) Peak area Amount found (mg) % Amount found
RP-HPLC method for EMB 50 3054.69 49.21 98.42
50 3055.69 49.22 99.00
RP-HPLC method for TEN 75 3661.05 75.54 100.72
75 3662.05 76.55 100.00
RSD: Relative standard deviation, SD: Standard deviation, RP-HPLC: Reversed-phase high performance liquid chromatographic, EMB: Emtricitabine, TEN: Tenofovir
Table 7: Intra‑ and interday precision studies on RP‑HPLC method for EMB and TEN
Method Drug Concentration (µg/ml) Intraday precision Inter‑day precision
Mean±SD % Amount found Mean±SD % Amount found
RP-HPLC method EMB 20 19.74±21.74 97.77 1475.3±29.75 102.70
30 29.64±28.43 102.18 2245.1±45.88 98.20
40 39.26±26.54 102.8 39.30±38.77 98.25
TEN 30 145.0±19.52 97.77 142.30±29.75 99.19
45 224.7±14.80 102.18 2245.1±45.88 101.96
60 298.6±44.18 102.38 259.57±61.58 102.63
ACKNOWLEDGMENTS
The authors are grateful to Emcure Pvt. Ltd. (Pune, Maharashtra, India) for providing gift samples of EMB and TEN. Authors are also thankful to Management and Principal of Gangamai College of Pharmacy, Nagaon, Dhule, Maharashtra for providing timely support for the research work.
REFERENCES
1. Martindale A. The Complete Drug Reference. 35th ed. London:
Pharmaceutical Press; 2007. p. 811.
2. Indian Pharmacopoeia. Government of India, Ministry of Health and Family Welfare. Vol. II. Ghaziabad: The Indian Pharmacopoeia Commission; 2010. p. 1272-3.
3. The Merck Index. An Encyclopedia of Chemicals, Drugs and Biological. 13th ed., Vol. 630. Merck Research Laboratories; 2007.p. 1631-2.
4. Indian Pharmacopoeia. Government of India, Ministry of Health and Family Welfare. Vol. III. Ghaziabad: The Indian Pharmacopoeia Commission; 2010. p. 2188-93.
5. Gomes NA, Vaidya VV, Pudage A, Joshi SS, Parekh SA. Liquid chromatography-tandem mass spectrometry (LC-MS/MS) method for simultaneous determination of tenofovir and emtricitabine in human plasma and its application to a bioequivalence study. J Pharm Biomed Anal 2008;48(3):918-26.
6. D’Avolio A, Sciandra M, Siccardi M, Baietto L, Gonzalez de Requena D, Bonora S, et al. A new assay based on solid-phase extraction procedure with LC-MS to measure plasmatic concentrations of tenofovir and emtricitabine in HIV infected patients. J Chromatogr Sci 2008;46(6):524-8.
7. Sentenac S, Fernandez C, Thrillers A, Lachat P, Aymard G. Sensitive determination of tenofovir in human plasma samples using reverse phase liquid chromatography. J Chromatogr B 2003;793(2):317-24. 8. Delahunty T, Bushman L, Fletcher CV. Sensitive assay for determining
plasma tenofovir concentrations by LC/MS/MS. J Chromatogr B Analyt Technol Biomed Life Sci 2006;830(1):6-12.
9. Takahashi M, Kudaka Y, Okumura N, Hirano A, Banno K, Kaneda T. Determination of plasma tenofovir concentrations using a conventional LC-MS method. Biol Pharm Bull 2007;30(9):1784-6.
10. Droste AH, Aarnoutse RE, Burger DM. Determination of emtricitabine in human plasma using HPLC with fluorimetric detection. J Liq Chromatogr Relat Technol 2007;30:2769-78.
11. Reddy GS, Kumar SA, Debnath M, Kumar VR. Analytical method development and validation for simultaneous determination of dutasteride and tamsulosin in bulk as well as in pharmaceutical dosage form by using RP-HPLC. Int J Pharm Pharm Sci 2014;6(3):77-84. 12. Patel MM, Patel HD. Development and validation of RP-HPLC