Abstract
The widespread deployment of infrastructure WLANs has made Wi-Fi an integral part of today’s Internet access technology. Due to the inherent characteristics of the wireless medium in WLAN systems, the capture effect significantly affects the system performance; a receiver can successfully decode a collided frame given that its signal-to-interference and noise ratio is sufficiently high enough, but results in an unfair channel access share among the wireless nodes. In this article, we propose fair capture effect aware MAC (FC-MAC) algorithm, which achieves channel access fairness using a feedback control mechanism. We determine the average waiting time as a common control reference, which provides fair channel access even when the capture effect is present. In result, the algorithm enables each node to converge to a fair channel access share. Among multiple points that yields fair channel access, we determine the optimal target reference that maximizes the aggregate throughput. Through both dynamic system modeling and extensive simulation studies, we show that the FC-MAC algorithm is stable and achieves fairness while improving the aggregate throughput.
Keywords:802.11 DCF, Capture effect, Fairness, Feedback control
1. Introduction
The last decade has witnessed a rapid technology deve-lopment in wireless networks. The IEEE 802.11 [1] WLAN standard has widely been deployed as a means for low-cost and easy wireless network access. IEEE 802.11 Medium Access Control (MAC) commonly uses the mandatory distributed coordination function (DCF) for channel access, due to its simplicity and efficiency in the operation of data transmission. In the mean time, the capture effect frequently takes place in such WLAN environment [2,3]. The capture effect takes place when two or more nodes transmit simultaneously, i.e., a colli-sion occurs at the common receiver. Even though the data frames may collide at the receiver, the data frame with the strongest received signal strength can still be successfully decoded, given that the signal-to-interfer-ence and noise ratio (SINR) is sufficiently high enough. This capture effect significantly increases the system throughput since it mitigates the performance reduction due to collisions [4]. Moreover, in wireless multi-hop
networks, the capture effect also improves the spatial reuse, thus increases the overall network performance [5,6].
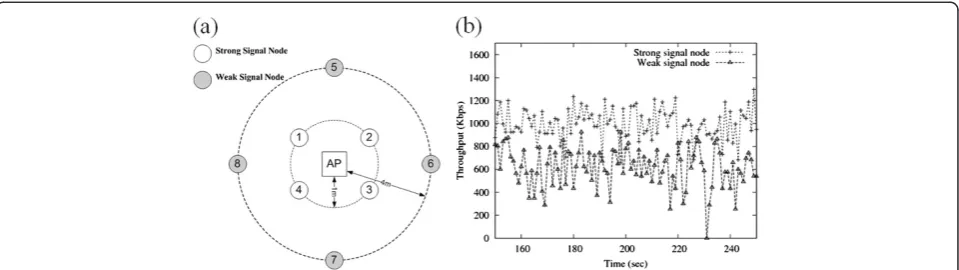
The capture effect, however, leads to persistent channel access unfairness among nodes. As shown in Figure 1a, let us consider a simple example where four nodes are placed on a radius of 1 m and the other four nodes on a radius of 4 m from an access point (AP) located at the center. The AP generally receives a much stronger signal from the 1–m away nodes than those from the 4–m away nodes when the nodes transmit at the same transmission power. We refer to the former as the strong signal node and the latter as the weak signal node, respectively. Figure 1b shows the throughput dynamics of a strong signal node and a weak signal node using ns-2 [7] simulation with conventional DCF. We observe persistent throughput unfairness between the strong and weak signal nodes. Due to the capture effect, the AP will successfully decode the data frame transmit-ted by the strong signal node when both strong and weak signal nodes simultaneously transmit. Here, the strong signal node resets its Contention Window (CW) [1] to the minimum CW for the next transmission, while the weak signal node carries out the binary exponential backoff (BEB) and doubles its current CW in order to * Correspondence:[email protected]
2
School of Electrical Engineering, Kookmin University, Seoul 136702, South Korea
Full list of author information is available at the end of the article
retransmit the failed data frame. Therefore, the weak signal node persistently has less chance of accessing the wireless channel resulting in channel access unfairness.
The channel access fairness can offer either through-put or temporal fairness by using diverse methods. If the conventional DCF is deployed, then the fair channel access gives throughput fairness. In the mean time, if methods such as transmission opportunity (TXOP) [1] are employed, where nodes may transmit multiple data frames in a predefined time duration, then temporal fairness can be achieved. In this article, we use the DCF so that throughput fairness can be provided. Several approaches have been proposed to offer channel access fairness in WLANs [8-10]. In these approaches, each node employs a common target CW size for fair channel access. However, despite the common CW settings, the strong signal nodes will still gain more channel access with capture effect in place. Therefore, we need a new common control reference that provides channel access fairness while not being affected by the capture effect.
In this article, we develop a reference-based fair capture effect aware MAC algorithm (FC-MAC). We first deter-mine the average waiting time as the common control reference, by which each node adjusts its own CW size. Second, we design the FC-MAC algorithm based on feed-back control, and also model a dynamic system to validate its stability. We determine the target reference value so that the aggregate throughput is improved while gaining channel access fairness. Finally, we give extensive ns-2 simulations to show that FC-MAC achieves channel access fairness and improves the aggregate throughput when the capture effect is present.
The remainder of the article is organized as follows. Section 2 discusses the related work. In Section 3, we give the motivation and Section 4 shows the design of our proposed algorithm, FC-MAC. Section 5 presents the target reference to improve the system throughput. Section 6 shows a method to estimate the number of
nodes. We provide simulation studies in Section 7, and finally, we draw our conclusions in Section 8.
2. Related work
Many MAC-related studies have been studied in 802.11 WLANs [6,8-18]. Bianchi [8] proposes a simple and accurate Markov chain model for the DCF under the saturation condition after the BEB behavior of a node is observed. The optimal CW is presented using the analytic model when the number of nodes is given. Cali et al. [9] propose a MAC protocol based onp-persistent CSMA after observing the system behavior. They resolve the transmission probability p to maximize the system throughput. Heusse et al. [10] have presented a MAC algorithm called the Idle sense, which adjusts its CW using the additive increase multiplicative decrease (AIMD) method so as to make the length of the measured idle period become a target CW, in result, maximizes the system throughput. Nevertheless, they do not consider the misbehavior due to capture effect or channel error.
The results given in [3] demonstrate that the capture effect phenomenon occurs frequently in the practical 802.11-based WLANs. Furthermore, the throughput for each sender becomes unfair depending on the spatial difference from a sender to a receiver on the assumption that all the senders use the same sending power level [2]. Boer et al. [19] propose a scheme that a data frame can be decoded by delivering the indication which notifies the occurrence of capture effect or the arrival of a new signal in PHY to the PHY layer management entity (PLME). In [20], the SINR threshold values are provided according to different transmission rates for 802.11a/b. The SINR value plays an important criterion in determining whether the capture effect occurs or not. Ganu et al. [21] have presented that AIFS+TxOP control may improve the throughput fairness under capture effect, but they do not propose any algorithms or protocols that can actually realize it. The main reason is
that it requires a central coordinator to find the weak-signal receivers that are suffering from throughput unfairness. Furthermore, it also requires a control system to adjust these parameters. Meanwhile, this study proposes a feed-back system that can be used as an algorithm that controls the parameters to converge to a fair state, in a distributed manner. Bejeranoa et al. [22] consider the capture effect unfairness. They view this problem in a multi-cell envir-onment, where the interference from neighboring cells aggravates this phenomenon. They propose a frequency planning algorithm to solve this problem.
In summary, although there have been some considerations on the unfairness due to capture effect, the previous work either do not propose a protocol to solve this or focus on a different system. To the best of the authors’ knowledge, this is the first study to propose a feedback-based control system that focuses on this problem.
3. Motivation
In this article, we consider an infrastructure-based 802.11 WLANs with a single AP and multiple wireless nodes which are associated with the AP. Since the focus of this article is on the unfairness stemming from the capture effect, only the upstream (from node to AP) traffic is considered. Again, the main objective of this article is to solve the unfairness resulting from the capture effect.
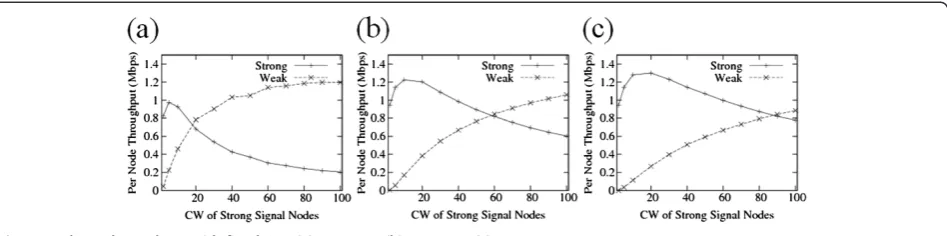
We first observe the variation of per-node throughput between the strong and weak signal nodes when the CW size is varied. Figure 2 shows the simulation results with eight nodes (i.e., four nodes are near from the AP and the other four nodes are far from the AP). We denote the CW size of the strong signal node and that of the weak signal node as Ws and Ww, respectively. Ww is
fixed to 10, and Ws varies from 2 to 100. Figure 2a
shows that the strong and weak signal nodes obtain the same throughput when Ws is around 19. This indicates
that fairness can be achieved by selecting the different CWs for each node under the capture effect. Further-more, we observe that there is more than a single point that satisfies fairness. Ww is set to 50 in Figure 2b and
80 in Figure 2c. Each figure shows different cross point
to achieve fairness. Since there are multiple points that yield fair channel access, we should determine the best one that maximizes the aggregate throughput.
Figure 3 plots the variation of aggregate throughput with different CWs under the throughput fairness condition between weak and strong signal nodes. It shows a concave curve where the maximum aggregate throughput is achieved whenWwis around 75. From this intuition, we
aim to design the MAC algorithm that improves the aggregate throughput under the fairness constraint.
4. Reference-based fair MAC
This section describes a reference-based fair MAC algo-rithm with the physically unfair environment due to the capture effect. We first determine a control reference that is not affected by the capture effect. Then, we present the FC-MAC algorithm via modeling the system dynamics. Finally, we analyze the system stability of the algorithm, and provide the range of the parameters that maintains the system to be stable.
4.1. Control reference
We introduce the average waiting time as a common control reference. Unlike the common CW size, the
Figure 3Aggregate throughput provided that the fair throughput share is achieved.
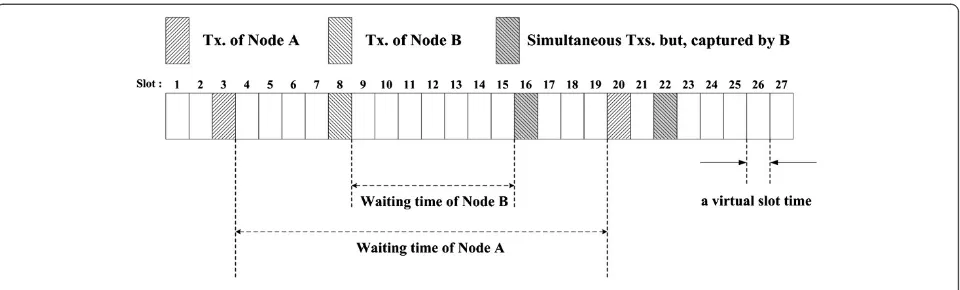
average waiting time can provide channel access fairness even when the capture effect takes place. Figure 4 shows an example to explain the concept of the average waiting time. Node A is strong signal node and node B is weak signal one. The waiting time is defined as the number of virtual slots [8,9] between two consecutive successful transmissions, rather than an absolute elapsed time. In the case of the third transmission, in which nodes A and B simultaneously transmit at the same virtual slot, node B’s transmission is successfully decoded by the receiver, whereas node A’s transmission fails (i.e., collision). For example, from slot 3 to 20 of Figure 4, the waiting time of node A is 16 and that of node B is 7.
In computing the waiting time, we discriminate between the successful capture and failed reception due to collisions. Therefore, the average waiting time of each node is in inverse proportion to its own channel access opportunity [2,23]. In other words, if the waiting time of node B is made to be equal to that of node A, both nodes would gain the same channel access opportunities. In result, the average waiting time is employed as the control reference for FC-MAC.
4.2. Feedback control system and its modeling
The FC-MAC algorithm can be presented by modeling the system dynamics. We assume that nodes are clas-sified into M capture classes. Let N and Ni denote
the total number of nodes and the number of nodes in the class i (1 ≤ i ≤ M), respectively. Then, it is clear thatN=N1+· · · +NM.
Nodes in the same class have the same capture priority. Suppose a class-i node and a class-jnode simultaneously transmit data frame. Ifi<j, then the data frame of class-i
node is captured (i.e., successfully transmitted) but that of class-jnode is dropped due to collision. We assume that data frame with higher capture priority can be decoded regardless of any data frames with lower priority. Ifi=j, then both data frames are dropped.
Figure 5 shows a block diagram of the proposed WLAN system. It consists of two main blocks: plant and FC-MAC (i.e., reference-based feedback controller). Plant represents the wireless channel characteristics. When the transmission probability of class-i node, τi(t)
for all i is given, the plant determines the waiting time of class-i node,Ti(t). Ti(t) depends on the success
pro-bability of data frame transmission, pis(t). It is clear that
pis(t) = 1–pi(t) + picapture(t) wherepi(t) is the probability
that the data frame transmission of class-i node simul-taneously occurs with other node’s transmission and picapture(t) is the capture probability, that is, the class-iis
the highest priority among simultaneous transmissions. The probabilitypi(t) is thus
pið Þ ¼t 1 Y
1≤k≤M;k≠i
1τkð Þt
ð ÞNk 1τ
ið Þt
ð ÞNi1: ð1Þ
Some of those frames can be captured when the class-i is the highest priority among simultaneous transmissions, that is, nodes in higher or same priority than class-i do not transmit a data frame and at least one node in lower priority than class-itransmits a data frame at timet. The capture gain probabilitypicapture(t) is
The number of virtual slots for successful transmission is geometrically distributed with the probability of success, τi(t)pis(t). Thus, we obtain the waiting time of class-inode
pcapturei ð Þ ¼t Y
1≤k<i
1τkð Þt
ð ÞNk
1τið Þt
ð ÞNi1
1 Y i<j≤M
1τjð Þt
Nj
!
if 1≤i<M
0 if i¼M
: 8
> < >
: ð2Þ
at timet,Ti(t), that is, the expected number of virtual slots
between two consecutive successful transmissions as the following:
Tið Þ ¼t 1
τið Þt ⋅ 1 ps
ið Þt
1
¼ 1
τið Þt ⋅
1 1τið Þt
ð ÞNi1Y
1≤k<i
1τkð Þt
ð ÞNk1:
ð3Þ
Note again that the capture effect affects the performance of fair control. Each node then measures its waiting time on the wireless medium and feeds back the information to the FC-MAC block. The FC-MAC block determinesτi(t) of
a class-i node according to ei(t), the difference between a
measured waiting timeTi(t) and a target waiting timeTref.
The target waiting timeTrefis given by the control
algo-rithm and assumed that every node has the same value. We will later study on the method of determining the target waiting time in Section 5. It is known from [8] thatτi(t) is shown as follows:
τið Þ ¼t 2 Wið Þ þt 1;
ð4Þ
whereWi(t) is the CW size of a class-inode. In order to
achieve fairness among WLAN nodes, we propose to adjustWi(t) as follows [24,25]:
Wið Þ ¼t eið Þ þt β⋅WiðtCÞ
where eið Þ ¼t α⋅ðTrefTiðtCÞÞ ð 5Þ
Here, the CW size is updated everyCinterval. The key notations used in Section 4 are summarized in Table 1.
5. Target reference to improve the system throughput
In this section, we present the target referenceTrefto give
satisfactory results for a wide range of the network top-ologies. To resolve this issue, we establish the upper and
lower bounds of maximizing the system throughput. Then, through simulation studies, we determine a value within the bound that can enhance the throughput to be commonly exploited irrespective of the network topology.
5.1. Two extreme cases
We consider two extreme topologies: the no-capture topology and the always-capture topology. WhenM= 1, the capture effect does not occur, i.e., a collision always results in a frame reception error. On the other hand, whenNi= 1 for all 1≤i≤M(>1), the capture effect always
occurs whenever multiple nodes transmit simultaneously.
5.1.1. The no capture case
We consider the no capture case (M = 1) first, which is studied in the previous work [8]. Bianchi [8] has proposed a simple and accurate Markov chain model for the DCF under the saturation condition after the BEB behavior of a
Figure 5State block diagram for the FC-MAC and its dynamic system.
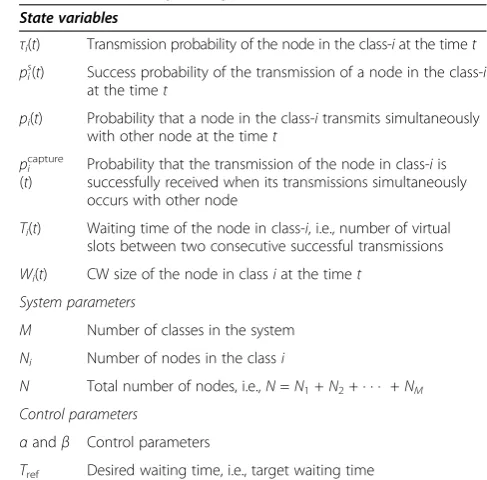
Table 1 A summary of key notations
State variables
τi(t) Transmission probability of the node in the class-iat the timet pis(t) Success probability of the transmission of a node in the class-i
at the timet
pi(t) Probability that a node in the class-itransmits simultaneously
with other node at the timet
picapture
(t)
Probability that the transmission of the node in class-iis successfully received when its transmissions simultaneously occurs with other node
Ti(t) Waiting time of the node in class-i, i.e., number of virtual
slots between two consecutive successful transmissions
Wi(t) CW size of the node in classiat the timet
System parameters
M Number of classes in the system
Ni Number of nodes in the classi
N Total number of nodes, i.e.,N=N1+N2+ · · · +NM
Control parameters
αandβ Control parameters
node is thoroughly observed, and solved the optimal transmission probability using the analytic model when the number of nodes is given. The aggregate throughput is maximized when
τ¼ 1
NpffiffiffiffiffiffiffiffiffiffiffiTF=2 ð6Þ
whereTF* =TF/σis the duration of a collision normalized
by a slot time units σ, and Nis total number of nodes. The optimal target waiting time Tref can be obtained
from (3) and (6). Since M is 1 in no capture case, τi
andNi (i.e.,i= 1) in (3) becomeτandN, respectively.
Then, applying Equation (6) and approximating it for sufficiently largeN, we have
Tref¼
5.1.2.The always capture case
We consider another extreme topology, the always cap-ture case (Ni= 1 for all 1≤i≤M(>1) andN=M). The
throughputSifor a class-inode is defined as the fraction
of time the channel is used to successfully transmit pay-load bits. To calculateSi, let us analyze what can happen
in randomly chosen slot time. Thus,Siis given by
Si¼
E½payload length of classitransmitted inavirtual slot time E½length of a virual slot time
that a successful transmission for classioccurs, average MSDU size, the average successful transmission time, the average collision time, a slot time, and the probability that the channel is busy, respectively. To achieve channel access fairness among the nodes, Psucci for each node
should be the same
Psucc1 ¼Psucc2 ¼P3succ¼⋯¼PMsucc: ð9Þ Considering that this is the always capture case, thus Ni= 1 for all 1≤i≤M, a transmission at a class-inode
will succeed when there is no transmission from a higher class, i.e., classes higher than i. Therefore, the probability of successful transmission for class-inode is
Psucci ¼τi Y
1≤k<i 1τk
ð Þ: ð10Þ
By directly applying Equation (10) to (9), we obtain
τi¼ τi
There will be at least one transmission occurrence in a slot time, unless all of the nodes in each class stay idle. In other words, the probability that there is at least one transmission in the considered slot time is given by
Ptr¼1 Y
1≤i≤M 1τi
ð Þ ¼Mτ1: ð12Þ
We apply the result in (11) to obtain the above final result. Next, we assume that the average successful transmission time and the average collision time are equal, i.e.,T=TF. Since there is only one node per class,
thusM=N. Therefore, (8) becomes
Si¼ τ1
of a class-inode is equivalent to that of class-1 node. And we obtain from the conditionρ(utilization) < 1 in [23] for system stability that
Ptr¼N⋅τ1<1⇒τ1<
1
N: ð14Þ
Si is maximized as τ1 gets closer to 1/N. Applying
τ1= 1/Nto (3), the optimal Trefis given by
Tref ¼N1: ð15Þ
5.1.3. Bounds of reference
From (7) and (15), the following bounds of the desired Trefare obtained
N1<Tref≤N
ffiffiffiffiffiffiffiffiffiffiffi TF=2 p
1
⇒Tref ¼N⋅K⋅
ffiffiffiffiffiffiffiffiffiffiffi TF=2 p
1 where ffiffiffiffiffiffiffiffiffiffiffi1 TF=2
p <K≤1:
ð16Þ
Note that the optimal Kwhich maximizes the system throughput varies according to the topologies. In the next section, we will explain the effect of K and try to find a commonKfor an arbitrary topology.
5.2. Finding the target waiting time
We conducted extensive simulations on a wide range of the network topologies to heuristically determine a desired Tref which gives satisfactory results. We first
build a metric that measures the capture effect in a quantitative fashion, i.e., we introduce the ratio (ψ) of collisions over simultaneous transmissions. This ratio can be expressed as
ψ¼1 P
cap
Psimul ð17Þ
where Psimul and Pcap denote the probability of one or more simultaneous transmissions occurring in a time slot and the probability that successful transmission occurs due to the capture effect, respectively.
When the simultaneous transmissions always yield in capture effect,ψbecomes 0. Conversely,ψbecomes 1 when the simultaneous transmissions always result in collision.
To observe the average ψin an arbitrary topology, we conducted simulations while varying number of nodes from 2 to 128. We repeated the simulations with 100 random topologies for each data point. Figure 6 shows the averageψobserved as the number of nodes increases from 2 to 128. The error-bar depicts 95% confidence interval.a We observe that the mean and the deviation
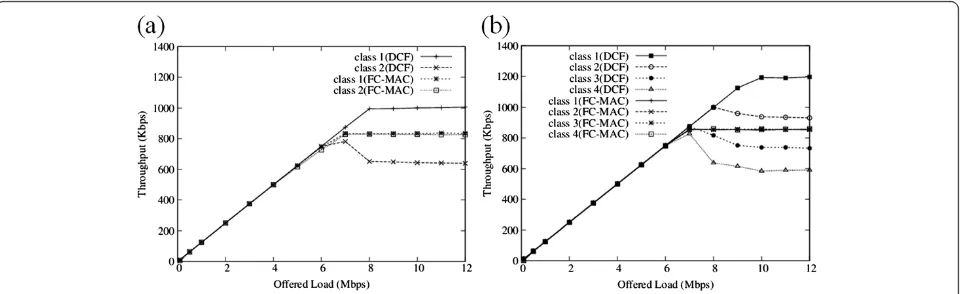
Figure 8Throughput of DCF and FC-MAC as a function of offered load: (a) Number of classes = 2 (M= 2), (b) Number of classes = 4 (M= 4). Figure 7Aggregate throughput as a function ofψ.( ffiffiffiffiffiffiffiffiffiffiTF=2
p
forψ decrease gradually. 95% confidence interval ofψis within the range of 0.53–0.79 over all the network topologies. Since the majority of data points ofψ reside within the ranges of 0.53–0.79, we only consider those points in finding the best Tref. Notice that finding the
best Tref is equivalent to optimizing K becauseTref is a
function ofKas shown in (16).
Figure 7 illustrates the simulation results of aggregate throughput obtained with many different Kvalues. The number of nodes in Figure 7 is 8 and 32, respectively. The figure shows that higher throughput is achieved whenKis larger than 0.69 in the range whereψis 0.5 to 0.8. Therefore, we heuristically employ K = 0.86 as a default value for the simulation runs in Section 7.
6. Estimating number of nodes
In this section, we present the method to compute the number of active nodes. To achieve improved aggregate throughput, the FC-MAC acquires the number of active nodes or the traffic amount in a distributed manner by employing the method used in [16].
To correctly estimate the traffic amount or the number of active nodes, the capture effect should be excluded. Thus, we introduce a marked ACK approach, where all the nodes sample the same Psimul by using Type and
Subtypefields of ACK control frame. When a data frame is successfully decoded due to the capture effect, Type and Subtype fields for the marked ACK are marked to 01 and 0111 (reserved value), respectively. The nodes receiving or overhearing this marked ACK regard a preceding transmission as a simultaneous transmission, and calculates its Psimul accordingly. The number of active nodes can be estimated by inputting the measuredPsimul into the following equation:
^
N ¼ X
1≤k≤M
Nk¼1þ log 1P
simul
log Trefcurrent
Tcurrent ref þ1
ð18Þ
where Tcurrent
ref is the reference in use which is obtained
from the preceding estimation.
We also employ the invention in [19] enabling the marking technique to be utilized. In [19], when the capture effect occurs, the information is transferred between the layer management entities. Namely, if the medium interface senses the capture effect, it sends PHY_CAPTURE.ind message to PLME. The MAC layer management entity requests the information to PLME, and to notify the capture effect occurrence to the MAC sublayer. Finally, the
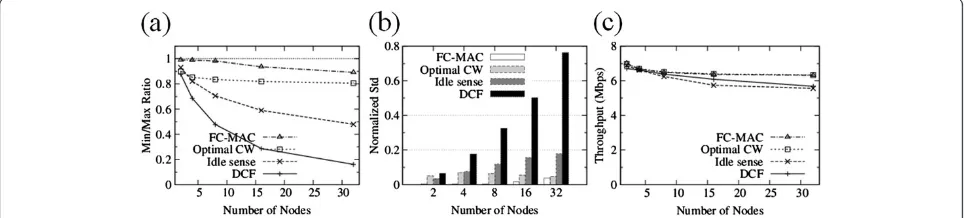
Figure 9Performance of FC-MAC as the number of nodes varies: (a) Aggregate throughput, (b) Min/Max throughput ratio, (c) normalized Std.
MAC sublayer decides whether it should send the marked ACK or a normal ACK according to the notification.
7. Simulations
In this section, we validate the channel access fairness and aggregate throughput of FC-MAC algorithm using the ns-2 simulator. The BSS data rate for data frames and basic rate for control frame (e.g., ACK) are set to 11 and 2 Mbps, respectively. The physical frame headers, e.g., preamble and PLCP header, are transmitted at 1 Mbps. We generated CBR over UDP traffic and the MSDU is set to 1500 bytes. The other system parameters are set by using the default values of the 802.11 specifications [1].
We compare the performance of FC-MAC with the conventional DCF, Optimal CW, and Idle sense. InOptimal CW, the nodes set their CW size to an optimal value according to [8], so that the system throughput is maximized under the saturated traffic load. Note that, since this scheme does not consider the capture effect, it results
in channel access unfairness. Furthermore, it over-estimates the optimal CW, resulting in less than maximum through-put. InIdle sense[10], each node observes its idle time, i.e., E[idle], and adjusts its CW size using an AIMD control algorithm. The AIMD algorithm is controlled based on a theoretically derived value, ntarget, which is calculated by E[idle] when N → ∞. Thus, Idle sense does not employ the runtime adaptive estimation reflecting the number of active nodes. Furthermore, since all the nodes within a system observe the same E[idle], and they regulate their CW size based on the E[idle], thus do not achieve fairness when the capture effect occurs. The Idle sense usesε= 0.001 and 1/α= 1.2 for the control parameters and selects 5.68 for the ntarget. The FC-MAC usesα= 0.5 andβ= 1 for control parameters and selects 0.86 for K. The CW control interval and the target reference adjustment interval are set to 50 and 100 ms, respectively.
We use the following performance metrics in the simulations.
Figure 12The performance evaluation in random topology: (a) Min/Max throughput ratio, (b) normalized Std., (c) aggregate throughput. Figure 11Performance of FC-MAC in a error-prone environment: (a) Min/Max throughput ratio (BER = 1 × 10⁻⁶), (b) normalized Std.
– Aggregate throughput: total throughput obtained by all the nodes in the system
Aggregate throughput¼X n
i¼1
ri, where ri is ith node’s
throughput.
– Min/Max throughput ratio: the ratio of lowest node throughput over highest node throughput in a system
Min=Max ratio¼ minf gri
maxf gri :
– Normalized standard deviation (Std.): the dispersion of per-node throughputs from the average node throughput
Normalized Std:¼
ffiffiffiffiffiffiffiffiffiffiffiffiffiffiffiffiffiffiffiffiffiffiffiffiffiffiffiffiffiffi Xn
i¼1
rir
ð Þ2=
n
s
r :
7.1. Offered load
Figure 8 illustrates per-node throughput of DCF and FC-MAC as a function of offered load when the number of nodes is 8. The simulations are conducted with two different topologies: M = 2 and M = 4. All the classes have the same number of nodes in the two topologies.
As shown in Figure 9, as the offered load increases, the throughput of the nodes grow equivalently until a saturation point is reached. When the channel is saturated, the DCF shows throughput unfairness since the stronger signal nodes gain more channel access compared to the weaker signal nodes. As expected, FC-MAC consistently maintains fairness between the strong and weak signal nodes irrespective of the number of classes even in the saturation regions.
7.2. Number of nodes
Next, we compare the performance of FC-MAC with other schemes when the number of nodes is varied (from 2 to 32). An equal number of nodes are assigned to each strong and weak signal class, and offered load is set to 10 Mbps. Figure 9a shows the aggregate through-put of each scheme. The FC-MAC shows similar throughput compared to Optimal CW while outper-forming the other two algorithms, by up to 13%. Meanwhile, the fairness of FC-MAC shows major per-formance enhancement. Figure 9b plots the Min/Max throughput ratio as a function of the number of nodes. The Min/Max ratio of FC-MAC always maintains a level above 0.9 while those of Optimal CW, Idle sense, and DCF decrease significantly as the number of nodes increases. Figure 9c illustrates the normalized standard deviation of per-node throughput. The normalized stand-ard deviation of FC-MAC is smaller compared to those of the other three algorithms. From Figures 9b,c, we see that the FC-MAC achieves better channel access fairness regardless of the number of nodes.
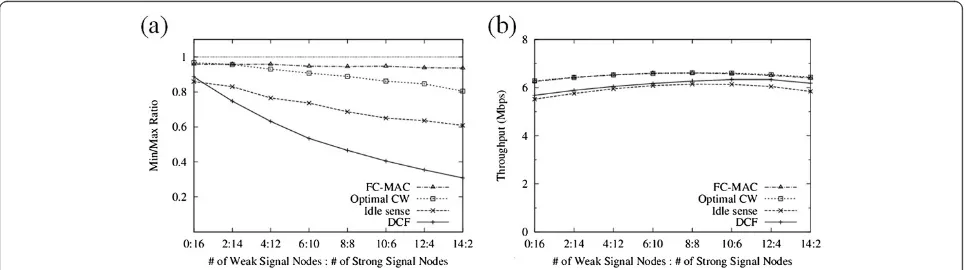
7.3. Ratio between weak and strong signal nodes
Next, we study the performance variation according to the ratio between the number of weak and strong signal nodes. Figure 10a shows the Min/Max throughput ratio. The number of weak signal nodes increases from 0 to 14 while the number of strong signal nodes decreases from 16 to 2. The FC-MAC is relatively fair irrespective of the number of strong signal nodes, whereas Optimal CW, DCF, and Idle sense are notably unfair. When the number of strong signal nodes is large, most of the simultaneous transmissions lead to more failed receptions, rather than capture effect, due to the increased competition between the strong nodes. Thus, there is not much difference between the throughput of strong and weak nodes. In contrast, if the number of weak signal nodes is large, the data frames from the strong signal node are almost always captured when simultaneous transmissions occur. In result, the fairness is significantly deteriorated. Figure 10b demonstrates the aggregate throughput for each approach. The FC-MAC continuously achieves higher throughput than those of the other algorithms.
7.4. Error-prone environment
We consider how FC-MAC operates with random channel error. The channel error may affect the fair channel access control, since it may not only reduce the overall network capacity but also occur randomly at the nodes. Figure 11 shows the Min/Max ratio and aggregate throughput as a function of the number of nodes. For each simulation run, the given bit error rate (BER) levels are 1 × 10⁻⁶ (Figure 11a–c) and 1 × 10⁻⁵(Figure 11d–f ). The number of nodes increases from 2 to 32.
As depicted in Figure 11a,d, with the increasing number of nodes, the fairness of DCF decreases dramatically and those of Optimal CW and Idle sense decline moderately. In Figure 11d, Min/Max ratio of FC-MAC is approxi-mately 0.827 even when the channel error is severe and the number of nodes is 32. As shown in Figure 11b,e, the FC-MAC is better than the other algorithms in terms of fairness. Figure 11c,f plot the aggregate throughputs of DCF, Idle sense, Optimal CW, and FC-MAC for different BER values. As shown in Figure 11c,f, the FC-MAC also
achieves higher throughput than those of the DCF and Idle sense. In summary, the FC-MAC is still efficient and robust even in the error-prone environment.
7.5. Random topology
Since FC-MAC is designed based on the assumption that all nodes are categorized into separate capture classes, we need to show that FC-MAC performs well in various randomized environments. Therefore, we conduct simulations in random topologies. We set up eight topologies where all nodes are randomly located within a 20 × 20 m2space and AP is at the center of the space.
Figure 12 illustrates Min/Max throughput ratio, normalized Std., and aggregate throughput as the num-ber of nodes increases from 2 to 32. In Figure 12a,b, the FC-MAC persistently achieves fairness regardless of the number of nodes, whereas the fairness of Optimal CW, DCF, and Idle sense significantly declines as the number of nodes increases. We observe that Optimal CW, DCF, and Idle sense suffer from a more severe unfairness due to the random characteristic of topology. Figure 12c shows that the FC-MAC attains similar aggregate throughput with Optimal CW, while achieving higher throughput than DCF and Idle sense.
8. Conclusions
The 802.11 DCF uses random channel access, thus resulting in frequent simultaneous transmissions, i.e., collisions. Even when a collision takes place, the receiver may capture the data frame of a significantly stronger received signal, so that it is decoded successfully. There is a strict tradeoff when this capture effect occurs; the system throughput increases since the errors due to collisions may be salvaged by the capture effect, but the nodes may experience unfair channel access.
In this article, we proposed a MAC algorithm based on a feedback control approach, called FC-MAC, where each node uses the waiting time as a target reference to gain channel access fairness. By computing the opti-mal target reference, the nodes improve the aggregate throughput as well as achieve fairness even when capture effect is present. Then, FC-MAC is compared with other MAC algorithms via ns-2 simulations. The simulation results show that FC-MAC consistently yields the best fairness irrespective of the number of nodes, error-prone channels or topologies, while im-proving the aggregate throughput. Last but not least, we envision that FC-MAC can relatively easily be deployed into the common Wi-Fi devices, and leave the real implementation of FC-MAC as a part of our future research.
The proposed algorithm should be proven to be stable. The system model obtained from Equations (1) to (5) is nonlinear. To study the stable region, Equations (3)–(5) are linearized at the equilibrium point (τi*, Wi*) for each
variable. LetWi(t) =Wi*+δWi(t),τi(t) =τi*+δτi(t). Then,
the following is obtained
δWið Þ ¼t δeið Þ þt β⋅δWiðtCÞ
We analyze the stability of the linearized model (19) using its characteristic polynomial. By taking the Laplace transform of (19), the characteristic polyno-mial can be obtained.
sTeið Þ ¼s
For simplicity, we approximate the characteristic polynomial using time delay as the first-order lag, i.e., esC≈ 1
1þsC The characteristic polynomial obtained from the calculation is as follows:
sTeið Þ ¼s Equation (21) is briefly represented using a matrix
sT seð Þ ¼A⋅T seð Þ
where A¼MM matrix: ð22Þ
The authors of [24,25] present the theorem that equation dx/dt = Ax is asymptotically stable if and only if the real parts of all the eigenvalues of A are negative, i.e., left half plane. From this theorem, the system becomes stable if the following equation is satisfied:
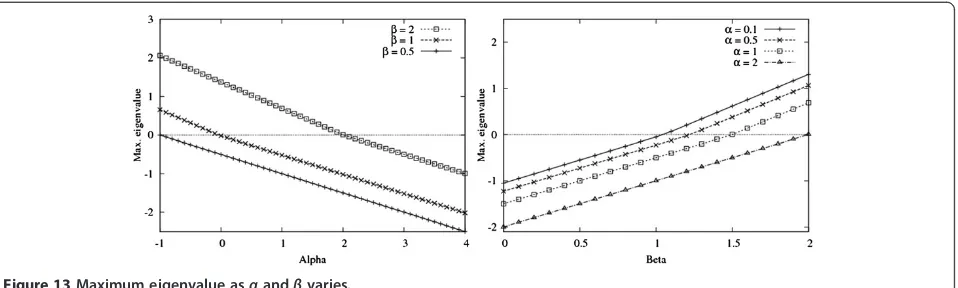
Equation (24) means that the system is stable if the maximum eigenvalue among M eigenvalues is negative. We tune the parametersα and β via ns-2 simulations while observing the impact on system performance. The adjusting interval C for feedback control is set to 1 s. Figure 13 plots that the maximum eigenvalues as control parametersαandβare varied when number of classes is 5 and the number of nodes in each class is 10. In Figure 13, the region satisfying the system stability becomes smaller asβgrows larger. For example, ifβis set as 2,αshould be set to be over 2.3 in order to satisfy the stabilized condition. On the other hand, when β is below 1, the system is always stable for allαvalues larger than 0.1.
Figure 14 illustrates the aggregate throughput and the standard deviation for per-node throughput as β is changed to 0.7, 0.9, and 1 when the number of nodes is 8 and α is fixed to 0.5. We observe that the system throughput is improved and the standard deviation decreases asβincreases. As a result,βshould be as close to a value of 1 as possible.
Figure 15 describes each CW of strong and weak signal nodes for different α values whenβ is fixed to 1. In Figure 15, the lines in both cases of α= 1 and α= 2 considerably fluctuate in comparison with the case when α= 0.5. The settling time of α= 0.5 is 15 s within 5% error band while those of α= 1 and α= 2 are 21 and 29 s, respectively. Furthermore, the overshoot in both case ofα= 1 andα= 2 is higher than that in a case of α= 0.5. Here, the settling time is the time it takes the system transients to decay. The overshoot is the maximum amount the system overshoots its final value divided by its final value. Consequently, we confirm that value close to 0.5 is suitable forα. Figure 16 plots the maximum eigenvalue as the number of classes and the number of nodes in each class are varied withα= 0.5 andβ= 1. We observe that the system is always stable because all the maximum eigenvalues are in the negative part.
Competing interests
The authors declare that they have no competing interests.
Acknowledgments
This research was supported by the Basic Science Research Program through the National Research Foundation of Korea (NRF) funded by the Ministry of Education, Science and Technology (2011–0023856) and by the research program of Kookmin University in Korea.
Author details
1Samsung Electronics, Suwon 443742, South Korea.2School of Electrical Engineering, Kookmin University, Seoul 136702, South Korea.3Department of Software Design & Management, Gachon University, Seongnam 461701, South Korea.
Received: 30 May 2012 Accepted: 29 January 2013 Published: 26 February 2013
References
1. Std. 802.11-2007, Part 11, Wireless LAN Medium Access Control (MAC) and Physical Layer (PHY) specifications(ANSI/IEEE Std, 2007). 802.11-2007
3.
A Kochut, A Vasan, A Shankar, A Agrawala, Sniffing out the correct physical layer capture model in 802.11b, inProceedings of the IEEE ICNP(Berlin, Germany, 2004), pp. 252–261
4. S Choi, K Park, C Kim, Performance impact of interlayer dependence in infrastructure WLANs. IEEE Trans. Mob. Comput.5(7), 829–845 (2006) 5. X Yang, N Vaidya, On the physical carrier sense in wireless ad-hoc networks,
inProceedings of the IEEE INFOCOM(Miami, FL, USA, 2005), pp. 2525–2535 6. Z Chen, X Yang, N Vaidya, Dynamic spatial backoff in fading environments,
inProceedings of the IEEE MASS(Atlanta, GA, USA, 2008), pp. 255–264 7. CMU Monarch Group,CMU Monarch extensions to ns. http://www.monarch.
cs.rice.edu
8. G Bianchi, Performance analysis of the IEEE 802.11 distributed coordination function. IEEE J. Sel. Areas Commun.18(3), 535–547 (2000)
9. F Cali, M Conti, E Gregori, Dynamic tuning of the IEEE 802.11 protocol to achieve a theoretical throughput limit. IEEE/ACM Trans. Netw.8(6), 785–799 (2000) 10. M Heusse, F Rousseau, R Guillier, A Duda, Idle sense: an optimal access
method for high throughput and fairness in rate diverse wireless LANs, in Proceedings of the ACM SIGCOMM(Philadelphia, PA, USA, 2005), pp. 121–132 11. H Kim, J Hou, Improving protocol capacity with model based frame
scheduling in IEEE 802.11-operated WLANs, inProceedings of the ACM MOBICOM(San Diego, CA, USA, 2003), pp. 190–204
12. D Qiao, K Shin, Achieving efficient channel utilization and weighted fairness for data communications in IEEE 802.11 WLAN under the DCF, in Proceedings of the IEEE IWQoS(Miami Beach, FL, USA, 2002), pp. 227–236 13. Y Yang, J Wang, R Kravets, Distributed optimal contention window control
for elastic traffic in wireless LANs, inProceedings of the IEEE INFOCOM (Miami, FL, USA, 2005), pp. 35–46
14. C Hu, J Hou, A novel approach to contention control in IEEE 802.11e-operated WLANs, inProceedings of the IEEE INFOCOM(Anchorage, AK, USA, 2007), pp. 1190–1198
15. B Sadeghi, V Kanodia, A Sabharwal, E Knightly, Opportunistic media access for multirate ad hoc networks, inProceedings of the ACM MOBICOM (Atlanta, GA, USA, 2002), pp. 24–35
16. J Choi, J Yoo, C Kim, A distributed, fair scheduling scheme with a novel analysis model in IEEE 802.11 wireless LANs. IEEE Trans. Veh. Technol. 57(5), 3083–3093 (2008)
17. P Gupta, P Kumar, The capacity of wireless networks. IEEE Trans. Inf. Theory 46(2), 388–404 (2000)
18. N Vaidya, P Bahl, S Gupta, Distributed fair scheduling in a wireless LAN, in Proceedings of the ACM MOBICOM(Boston, MA, USA, 2000), pp. 167–178 19. J Boer, H Bokhorst, W Diepstraten, A Kamerman, R Mud, H Driest, R
Kopmeiners,Wireless LAN With Enhanced Capture Provision, 1999. US Patent 5987033
20. J Yee, H Pezeshki-Esfahani, Understanding wireless LAN performance trade-offs, inCommunication Systems Design, 2002, pp. 32–35. http://i.cmpnet.com/ commsdesign/csd/2002/nov02/feat3-nov02.pdf
21. S Ganu, K Ramachandan, M Gruteser, I Seskar, J Deng, Methods for restoring MAC layer fairness in IEEE 802.11 networks with physical layer capture, in Proceedings of the ACM REALMAN(, Florence, Italy, 2006), pp. 7–14 22. Y Bejeranoa, S-J Han, M Smith, A novel frequency planning algorithm for
mitigating unfairness in wireless LANs. Elsevier Comput. Netw.54(15), 2575–2590 (2010)
23. L Kleinrock,Queueing Systems, Volume I: Theory(Wiley-Interscience, New York, 1975)
24. G Franklin, J Powell, A Emami-Naeini,Feedback Control of Dynamic Systems, 4th edn. (Addison-Wesley, Reading, MA, 2002)
25. C Chen,Linear System Theory and Design, 3rd edn. (Oxford University Press, Oxford, MA, 1999)
doi:10.1186/1687-1499-2013-50
Cite this article as:Jeonget al.:Reference-based fair MAC algorithm in Wi-Fi WLANs with capture effect.EURASIP Journal on Wireless
Communications and Networking20132013:50.
Submit your manuscript to a
journal and benefi t from:
7Convenient online submission
7Rigorous peer review
7Immediate publication on acceptance
7Open access: articles freely available online
7High visibility within the fi eld
7Retaining the copyright to your article