REVERSE PHASE HIGH PERFORMANCE LIQUID CHROMATOGRAPHY METHOD
DEVELOPMENT AND VALIDATION FOR THE SIMULTANEOUS ESTIMATION OF
GATIFLOXACIN AND FLURBIPROFEN IN PHARMACEUTICAL DOSAGE FORM
SRIDHAR SIDDIRAJU
1, RAYALA KAVITHA
2*, MUVVALA SUDHAKAR
21Department of Pharmaceutical Chemistry, Malla Reddy College of Pharmacy, Hyderabad, Telangana, India. 2Department of Pharmaceutical Analysis and Quality Assurance, Malla Reddy College of Pharmacy, Hyderabad, Telangana, India.
Email: [email protected]
Received: 23 October 2014, Revised and Accepted: 10 November 2014
ABSTRACT
Objective: The aim of this work was focused on to develop and validate an accurate, simple reverse phase high-performance liquid chromatography (HPLC) method for simultaneous estimation of gatifloxacin and flurbiprofen in pharmaceutical dosage form.
Methods: The chromatographic separation was performed on a kromosil C18 column (150 mm × 4.6 mm × 5 µ), with a mobile phase comprising of a mixture of potassium dihydrogen orthophosphate and acetonitrile (48:52) and pH is adjusted to 7.5 by adding 1 ml triethylamine, at a flow rate of 0.8 ml/minutes, with detection at 245 nm.
Results: Retention times of gatifloxacin and flurbiprofen were found to be 2.3 minutes and 5.6 minutes respectively. The developed method was validated according to ICH guidelines. Linearity of gatifloxacin was found to be in the range of 75-450 µg/ml and that for flurbiprofen was found to be in the range of 7.5-45 µg/ml. The percentage recoveries for both drugs were found in the range of 99-101%. The limit of detection and limit of quantification values for gatifloxacin were found to be 0.38 and 1.16 µg/ml and that for flurbiprofen were found to be 0.05 and 0.14 µg/ml, respectively.
Conclusion: The proposed HPLC method is simple, rapid, isocratic, specific, accurate and precise. Hence, this method can be recommended for the estimation of gatifloxacin and flurbiprofen in pharmaceutical dosage form.
Keywords: Gatifloxacin, Flurbiprofen, Reverse phase high performance liquid chromatography method, Validation.
INTRODUCTION
Gatifloxacin is an antibiotic of the fourth-generation fluoroquinolone family. IUPAC name of 1-cyclopropyl-6-fluoro-8-methoxy-7-(3-methylpiperazin-1-yl)-4-oxo-1-4-dihydroquinoline-3-carboxylic acid (Fig. 1). Gatifloxacin acts by inhibiting bacterial enzymes DNA gyrase and topoisomerase IV. Gatifloxacin is a broad spectrum antibiotic indicated for the treatment of bacterial conjunctivitis, keratitis as well as for pre- and post-operative infections of the eye and is effective against many Gram-positive and Gram-negative bacteria and it is administered orally in the treatment of chronic bronchitis, acute sinusitis, community acquired pneumonia, gonorrhea, pyelonephritis, urinary tract infections. Flurbiprofen is a propionic acid derivative, and it is a non-steroidal anti-inflammatory agent with antipyretic and analgesic activity. IUPAC name of flurbiprofen is 2-(3-fluoro 4-phenylphenyl) propanoic acid (Fig. 2). Flurbiprofen acts by inhibiting prostaglandin synthesis by interfering with cyclooxygenase needed for biosynthesis. Flurbiprofen is administered orally in the treatment of arthritis, bursitis, tendinitis, ankylosing spondylitis, soft tissue injuries and dysmenorrheal. Flurbiprofen may also be used topically prior to ocular surgery to prevent or reduce intraoperative miosis. A single enantiomer of flurbiprofen tarenflurbil (R-flurbiprofen) is currently in clinical trials for the treatment of metastatic prostate cancer [1-5].
Literature reveals that some methods are available for estimation of gatifloxacin by ultraviolet (UV) spectrophotometry [6], high-performance liquid chromatography (HPLC) [1,3,6,7], europium-sensitized fluorescence spectrophotometry [8], spectrofluorimetry [9], potentiometry [10], high-performance thin layer chromatography [11], capillary zone electrophoresis [12,13]. Methods available for the estimation of flurbiprofen are UV
spectrophotometry [14,15], HPLC [2,3,16,17], high-performance thin layer chromatography [18], spectro fluorimetry [9], liquid chromatography-mass spectrometry (LC-MS) [19-21], capillary zone electrophoresis [22], gas chromatography-MS [23], chiral phase LC [24].
Fig. 1: Structure of gatifloxacin
The literature survey was carried out for the simultaneous estimation of gatifloxacin and flurbiprofen, there was only single method was available in combination of both the drugs. Individual methods are also available for both the drugs. Therefore, attempts were made to develop and validate a simple, accurate, precise, selective reverse phase HPLC (RP-HPLC) method for simultaneous determination of both the drugs.
METHODS
Active pharmaceutical ingredients gatifloxacin and flurbiprofen were kindly gifted by spectra Pharma Research Solutions, Hyderabad. Pharmaceutical dosage form was purchased from the local pharmacy. Solvents used are of HPLC grade and obtained from Merck Specialties Private Limited, Mumbai.
Instrumentation
Analysis was performed on an HPLC system consist of waters 2695 with 2996 module-photo diode array detector equipped with a quaternary solvent delivery pump, automatic sample injector and column thermostat. The data acquisition and analysis was performed using Empower software.
Chromatographic conditions
The chromatographic separation was performed using kromosil C18 column (150 mm × 4.6 mm × 5 µ). Flow rate was kept at 0.8 ml/minutes. The column temperature was maintained at 30°C. The mobile phase was made up of potassium dihydrogen orthophosphate buffer and acetonitrile in 48:52 ratio. The method was optimized at 245 nm. Run time was taken as 10 minutes, and all the determinations are carried out at an ambient temperature.
Standard solution preparation
Accurately weighed and transferred 30 mg and 3 mg of gatifloxacin and flurbiprofen into 10 ml volumetric flasks separately. Add 3/4th amount of diluent and sonicated for 30 minutes and make up the final volume with water and acetonitrile in 50:50 ratio, then the solutions consist of 3000 µg/ml and 300 µg/ml of gatifloxacin and flurbiprofen, respectively. From the above stock, solutions take 1 ml into 10 ml volumetric flask and makeup the final volume with diluent. The final standard solution consists of 300 µg/ml of gatifloxacin and 30 µg/ml of flurbiprofen.
Sample preparation
The commercial eye drops consist of 0.3% of gatifloxacin and 0.03% of flurbiprofen in 5 ml bottle. 20 bottles were taken and transferred into a beaker. From the above solution pipette out 5 ml of sample and transferred into clean and dry 10 ml volumetric flask and the final volume was made up to 10 ml with water and acetonitrile in 50:50 ratio. The final sample solution consists of 1500 µg/ml of gatifloxacin and 150 µg/ml of flurbiprofen, respectively. From the above stock solution, pipette out 2 ml into 10 ml volumetric flask and the final volume was made up to 10 ml with diluent.
Buffer (0.02 N KH2PO4) preparation
Accurately weighed 2.72 g of potassium dihyrogen orthophosphate is taken in a 1000 ml of volumetric flask, add about 900 ml of milli-Q water and degas to sonicate and finally make up the volume with water.
Preparation of linearity solutions
Pipette out 0.25, 0.5, 0.75, 1, 1.25, 1.5 ml from stock solution into clean and dry 10 ml volumetric flasks and made the volume up to 10 ml using acetonitrile and water (50:50) as diluent to prepare concentration range of 75-450 µg/ml of gatifloxacin and 7.5-45 µg/ ml of flurbiprofen.
Method validation
The developed method was validated according to ICH guidelines. Validation parameters included are linearity, accuracy, limit of detection (LOD) and limit of quantification (LOQ), precision, and robustness.
System suitability parameters
The system suitability parameters were determined by preparing standard solutions of gatifloxacin and flurbiprofen and the solutions were injected 5 times and the parameters like peak tailing, resolution and US Pharmacopeia (USP) plate count were determined.
Linearity
The linearity of the method was determined by preparing six different concentrations of both gatifloxacin and flurbiprofen in the concentration range of 75-450 µg/ml and 7.5-45 µg/ml. Each solution was prepared in triplicate. The calibration curves were obtained by plotting peak area versus concentration.
Precision
Method precision (repeatability)
The method precision/repeatability was determined by injecting six working standard solutions and six sample injections. The areas of all the injections were taken and standard deviation, % relative standard deviation (RSD), % assay were calculated.
Intermediate precision
The intermediate precision was determined by injecting six working standard solutions and six sample injections on different days by different operators or by different instruments. The areas of all the injections were taken and standard deviation, % RSD, % assay were calculated. The results obtained were within the acceptance criteria.
Accuracy
The accuracy of the method was determined at three different concentration levels 50%, 100% and 150% by spiking known quantities of the drug analytes and % recoveries were calculated.
LOD and LOQ
LOD and LOQ of gatifloxacin and flurbiprofen were determined by calibration curve method. Prepare the solutions of gatifloxacin and flurbiprofen in the linearity range and inject the solutions in triplicate. Average peak areas were calculated and plot a graph between average peak areas versus concentration. The LOD and LOQ are calculated as:
LOD=3.3 σ/S and LOQ=10 σ/S; where σ is the standard deviation of
the lowest standard concentration and S is the slope of the standard curve.
Robustness
The robustness can be determined by varying the following parameters:
1. Flow rate: It was determined by varying the flow rate from 0.8 ml/ minutes to 1 ml/minutes. The standard solution of gatifloxacin and flurbiprofen were prepared and was injected by varying the flow
rate from 0.8 ml/minutes to 1 ml/minutes along with the optimized method
2. Column temperature: A study was conducted to determine the effect
of variation in column temperature. Standard solution of gatifloxacin and flurbiprofen was prepared and was injected into the HPLC system
by keeping the column temperature at 25°C and 35°C
3. Mobile phase: It was determined by changing the organic mobile
phase composition by ±10%. The standard solution of gatifloxacin and flurbiprofen was prepared and was injected by changing organic
mobile phase composition by ±10% along with the optimized method.
RESULTS AND DISCUSSIONS
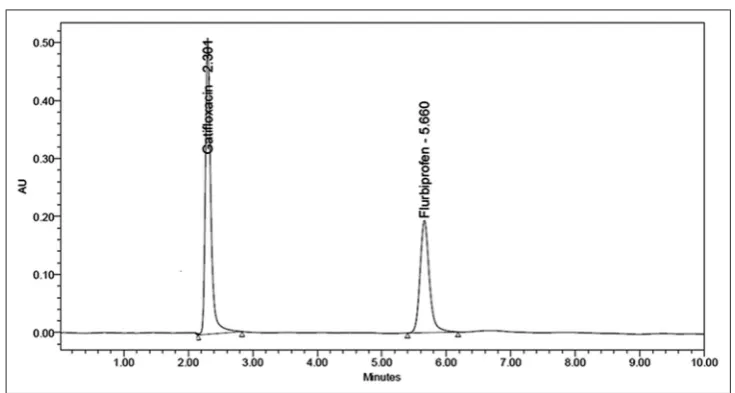
mobile phases such as acetonitrile and sodium dihydrogen phosphate and acetonitrile and potassium dihydrogen orthophosphate were used in different compositions with different flow rates. Hence, peak resolution, tailing factor, retention time were not satisfactory. Hence, finally acetonitrile and potassium dihydrogen orthophosphate was selected as a buffer in the composition ratio of 52:48 with a flow rate of 0.8 ml/minutes. The chromatographic separation was done by using different columns like Altima, XDB (150 mm × 4.6 mm × 5 µ) and base deactivated silica (250 mm × 4.6 mm × 5 µ). But resolution, retention time, and tailing were not within the specified limits. So, finally the actual chromatographic separation was done by using kromosil column (150 mm × 4.6 mm × 5 µ) with a flow rate of 0.8 ml/minutes with a run time of 10min and with the optimized wavelength of 245 nm (Fig. 3).
System suitability parameters
The system suitability tests were conducted before performing the validation and the parameters were within the acceptance criteria like retention times were 2.3 and 5.6 minutes for gatifloxacin and flurbiprofen, plate count was >2000, peak tailing was <2 and the
% RSD of peak areas of six injections were ≤2% (Table 1). Hence, the proposed method was successfully applied to routine analysis without any problems.
Linearity range
The linearity range was in the interval of 75-450 µg/ml gatifloxacin and 7.5-45 µg/ml of flurbiprofen, respectively. These were represented by a linear regression equation as follows:
y (gatifloxacin)=10431x+2002 (r2=0.999) (Fig. 4), y (flurbiprofen)=65063x+ 7555 (r2=0.999) (Fig. 5) and regression line was established by least squares method. Hence, the curves established were linear (Table 2).
Table 1: System suitability of gatifloxacin and flurbiprofen
S. No Gatifloxacin Flurbiprofen
Rt Area USP plate count USP tailing Rt Area USP plate count USP tailing
1 2.297 2942639 3958 1.32 5.658 1928452 7907 1.19
2 2.299 2904792 3888 1.28 5.663 1910940 8053 1.18
3 2.300 2895786 3848 1.29 5.664 1920293 8027 1.17
4 2.304 2934212 4036 1.29 5.667 1926049 7971 1.18
5 2.312 2985983 4151 1.35 5.676 1922498 7989 1.17
Mean 2932682 1921646
SD 35642.9 6761.6
% RSD 1.2 0.4
SD: Standard deviation, RSD: Relative standard deviation, Rt: Retention time, USP: US Pharmacopeia
Precision
Six replicates injections in the same concentration were analyzed on the same day and 2 different days for verifying the variation in the precision and the % RSD for gatifloxacin and flurbiprofen were within an acceptable limit
of ≤2. Hence, the method is reproducible on different days with different
analyst and column. This indicates that the method is precise (Table 3).
Accuracy
The percentage recoveries for gatifloxacin and flurbiprofen were found to be 99.93% and 100.09%, respectively. The results of the recovery studies undoubtedly demonstrate accuracy of the proposed method (Table 4).
LOD and LOQ
The determined values of LOD and LOQ were calculated by using slope and Y-intercept. The LOD and LOQ values for gatifloxacin were found
Fig. 3:High performance liquid chromatography of standard solution (i.e. gatifloxacin and flurbiprofen) Table 2: Determination of linearity
S. No. Gatifloxacin Flurbiprofen
Concentration Peak area Concentration Peak area
1 75 746516 7.5 506287
2 150 1608339 15 1003491
3 225 2383069 22.5 1471913
4 300 3106397 30 1919532
5 375 3895122 37.5 2437405
6 450 4703181 450 2961625
Slope 10431 65063
Y-intercept 2002 7555
Correlation
to be 0.38 and 1.16 µg/ml and flurbiprofen were found to be 0.05 and 0.14 µg/ml, respectively (Table 5).
Robustness
Robustness of the proposed method demonstrated a non-significant alteration through analysis of the sample and standard gatifloxacin and flurbiprofen solution. After this, the results obtained were compared with that of optimized method. It was confirmed that by the deliberate changes in the parameters there was no any significant changes in standard deviation, RSD, theoretical plates, retention time and USP tailing factor (Table 6).
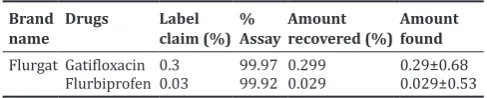
Assay
The content of gatifloxacin and flurbiprofen in the pharmaceutical dosage form was found by using the developed method. The percentage purity of gatifloxacin and flurbiprofen were found to be 99.97% and 99.92% and % RSD values for both gatifloxacin and flurbiprofen were
within the limit of ≤2 (Table 7).
CONCLUSION
The proposed HPLC method was simple, rapid, isocratic, specific, accurate and precise than existing method. The newly developed method differs from already existing method in the aspects of parameters like mobile phase composition, column, retention times of the drugs. In newly developed method the column used was kromosil C18 column and mobile phase was buffer (potassium dihydrogen orthophosphate pH 7.5) and acetonitrile in 48:52 (v/v) ratio, retention times of gatifloxacin and flurbiprofen were 2.3 and 5.6 minutes, respectively. Method validation was performed by testing its linearity, accuracy, precision, LOD, LOQ, robustness. Hence, this method can be recommended for the estimation of gatifloxacin and flurbiprofen in pharmaceutical dosage form.
ACKNOWLEDGMENTS
The authors were thankful for Spectra Pharma Research Solutions, Table 4: Determination of accuracy of gtifloxacin and flurbiprofen
Gatifloxacin Flurbiprofen
Standard ppm Added ppm Found ppm % Recovery Standard ppm Added ppm Found ppm % Recovery
300 150 150.48 100.33 30 15 14.96 99.73
300 150 148.72 99.15 30 15 15.07 100.49
300 150 150.34 100.23 30 15 15.04 100.29
300 300 300.47 100.16 30 30 29.87 99.57
300 300 298.05 99.35 30 30 30.20 100.70
300 300 299.00 99.67 30 30 30.10 100.35
300 450 448.82 99.74 30 45 45.19 100.42
300 450 450.77 100.17 30 45 44.69 99.33
300 450 452.64 100.59 30 45 44.98 99.96
Mean 99.93 100.09
SD 0.48 0.47
RSD 0.48 0.47
SD: Standard deviation, RSD: Relative standard deviation
Table 5: LOD and LOQ for gatifloxacin and flurbiprofen
S.No Gatifloxacin Flurbiprofen
Slope Y‑intercept Slope Y‑intercept
1 10458 1860 65155 6792
2 10401 3272 64884 8608
3 10433 873.7 65148 7265
Mean 10431 2002 65062.33 7555
SD 1205.4 942.1
LOD 0.38 0.05
LOQ 1.16 0.14
SD: Standard deviation, LOD: Limit of detection, LOQ: Limit of quantification
Fig. 4: Linearity graph of gatifloxacin Fig. 5: Linearity graph of flurbiprofen
Table 3: Determination of repeatability and intermediate precision for gatifloxacin and flurbiprofen
Drug Repeatability Intermediate precision
Peak area SD % RSD Peak area SD % RSD
Gatifloxacin 2943526 20135.1 0.68 2924704 8675.8 0.3
Flurbiprofen 1927824 10296.3 0.53 1918754 11616.3 0.6
Hyderabad for providing gatifloxacin and flurbiprofen reference standards as a gift sample to carry out the research work.
REFERENCES
1. Prathap B, Rajendran SS, Dinakar A, Srinivasa G, Ashok Kumar J, Roosewelt C. Simultaneous determination of gatifloxacin and ambroxol hydrochloride from tablet dosage form using RP-HPLC. Int J Res Pharm Sci 2010;1(3):325-7.
2. Najma S, Saeed Arayne M, Rubina S, Safila N. RP-HPLC Method for the simultaneous determination of lisinopril and NSAIDS in API, pharmaceutical formulations and human serum. Am J Anal Chem 2012;3:147-52.
3. Khan IU, Naeem SR, Irfana M, Muhammad A, Syed SR. Stability-indicating RP-HPLC method for simultaneous determination of gatifloxacin and flurbiprofen in binary combination. Quim Nova 2013;37:1-6.
4. Razzaq SN, Mariam I, Khan IU, Ashfaq M. Development and validation of liquid chromatographic method for gatifloxacin and ketorolac tromethamine in combined dosage form. J Liq Chromatogr 2012;35(4):651-61.
5. Prathap B, Nagarajan G, Dinakar A, Srinivasa G, Ranjit Singh BR, Shahul H. Spectrophotometric method for simultaneous estimation of gatifloxacin and ambroxol hydrochloride in tablet dosage form. Der Pharm Lett 2011;3(3):62-8.
6. Srinivas N, Narasu L, Shankar BP, Mullangi R. Development and validation of a HPLC method for simultaneous quantitation of gatifloxacin, sparfloxacin and moxifloxacin using levofloxacin as internal standard in human plasma: Application to a clinical pharmacokinetic study. Biomed Chromatogr 2008;22(11):1288-95. 7. Mahmoud MS, El-Shanawany AA, El-Adl SM, Abdel-Aziz LM,
Hisham AH. Rapid RP-HPLC method for simultaneous estimation of sparfloxacin, gatifloxacin, metronidazole and tinidazole. Asian J Pharm Res 2011;1(4):119-25.
8. Guo C, Dong P, Chu Z, Wang L, Jiang W. Rapid determination of gatifloxacin in biological samples and pharmaceutical products using europium-sensitized fluorescence spectrophotometry. Luminescence 2008;23(1):7-13.
9. Jinal MD, Vishnu MP, Rajesh P, Dushyant S. Development and validation of spectrofluorometric method for analysis of gatifloxacin and flurbiprofen sodium in ophthalmic dosage form. Inventi Rapid Pharm Anal Qual Assur 2014;ppaqa/1421/14.
10. Hasna M, Amir AS, Bassam N. Potentiometric determination of gatifloxacin, ciprofloxacin in pharmaceutical formulations. Int J Pharm Pharm Sci 2012;4(4):537-42.
11. Suhagia BN, Shah SA, Rathod IS, Patel HM, Shah DR, Marolia BP,
et al. Determination of gatifloxacin and ornidazole in tablet dosage
forms by high-performance thin-layer chromatography. Anal Sci 2006;22(5):743-5.
12. Faria AF, de Souza MV, de Oliveira MA. Validation of a capillary zone electrophoresis method for the determination of ciprofloxacin, gatifloxacin, moxifloxacin and ofloxacin in pharmaceutical formulations. J Braz Chem Soc 2008;19(3):389-96.
13. Sun H, Wei L, Zuo Y, Wu Y. Effective separation and simultaneous detection of gatifloxacin, amino methyl benzoic acid, cefazolin and cefminox in human urine by capillary zone electrophoresis. J Iran Chem Soc 2011;8(4):1043-51.
14. Sajeev C, Pravin RJ, Ravi Shankar D, Saha RN. Determination of flurbiprofen in pharmaceutical formulations by UV spectrophotometry and liquid chromatography. Anal Chim Acta 2002;463:207-17. 15. Emrah A, Bilal Y. Determination of flurbirofen in pharmaceutical
preparations by first-order derivative spectrophotometry method. Indian J Pharmacol 2014;1(2):130-7.
16. Hirai T, Matsumoto S, Kishi I. Simultaneous analysis of several non-steroidal anti-inflammatory drugs in human urine by high-performance liquid chromatography with normal solid-phase extraction. J Chromatogr B Biomed Sci Appl 1997;692(2):375-88.
17. Park KM, Gao ZG, Kim CK. Assay of flurbiprofen in rat plasma using HPLC with fluorescence detection. J Liq Chromatogr 1997;20(12):1849-55.
18. Dhavse VV, Parmar DV, Devarajan PV. High-performance thin-layer chromatographic determination of flurbiprofen in plasma. J Chromatogr B Biomed Sci Appl 1997;694(2):449-53.
19. Vinci F, Fabbrocino S, Fiori M, Serpe L, Gallo P. Determination of fourteen non-steroidal anti-inflammatory drugs in animal serum and plasma by liquid chromatography/mass spectrometry. Rapid Commun Mass Spectrom 2006;20(22):3412-20.
20. Giancarlo A, Marina C, Marica O, Roberto MF, Gary LW. Metabolic profile of NO-flurbiprofen in rat brain and plasma: A LC-MS study. Life Sci 2002;71(13):1487-500.
21. Déglon J, Thomas A, Daali Y, Lauer E, Samer C, Desmeules J, et al. Automated system for on-line desorption of dried blood spots applied to LC/MS/MS pharmacokinetic study of flurbiprofen and its metabolite. J Pharm Biomed Anal 2011;54:359-67.
22. Hamoudová R, Pospísilová M. Determination of ibuprofen and flurbiprofen in pharmaceuticals by capillary zone electrophoresis. J Pharm Biomed Anal 2006;41:1463-7.
23. Chao SH, Ho HT, Chen FA, Lin PY, Yu YC, Wu AB, et al. Identification of flurbiprofen and its photoproducts in methanol by gas chromatography-mass spectrometry. Biomed Chromatogr 2007;21(5):527-33.
24. Patel BK, Valentova J, Hutt AJ. Stereospecific analysis of flurbiprofen and its major metabolites in plasma and urine by chiral-phase liquid chromatography. Chromatographia 2003;57(1):7-18.
Table 6: Robustness data
Parameter Gatifloxacin Flurbiprofen
Mean area SD % RSD Mean area SD % RSD
Flow minus (0.8 ml/minutes) 2862982 3797.9 0.1 1905337 17188 0.9
Flow plus (1 ml/minutes) 2621903 27357.8 1 1717843 7584.4 0.4
Temperature minus (25°C) 2830328 28693.2 1.1 1965513 1332.3 0.1
Temperature plus (35°C) 2974557 10584.2 0.4 1969590 4061.6 0.2
Organic solvent ratio (−10%) 2912727 8355 0.3 1909563 4441.5 0.1
Organic solvent ratio (+10%) 2892868 4551.4 0.2 1908925 15979.2 0.8
SD: Standard deviation, RSD: Relative standard deviation
Table 7: Assay of gatifloxacin and flurbiprofen Brand Flurgat Gatifloxacin 0.3 99.97 0.299 0.29±0.68